Whale Dumps $1M in PUMP—Is This Token Running on Fumes?

A crypto whale just cut losses with a $1 million exit—and now traders are asking if PUMP's liquidity pool is evaporating.
Liquidity crunch or just FUD?
The token's price action looks shaky after the whale's abrupt departure. No fancy charts needed—when big players bail, retail often gets left holding the bag.
The irony of 'PUMP'
Funny how these meme-coins always promise moonshots but deliver more exit scams than Lambos. Another day, another 'degen' play learning the hard way that liquidity is a two-way street.
Whale Eyes $1 Million Sell-Off Despite PUMP Price Rising 8%
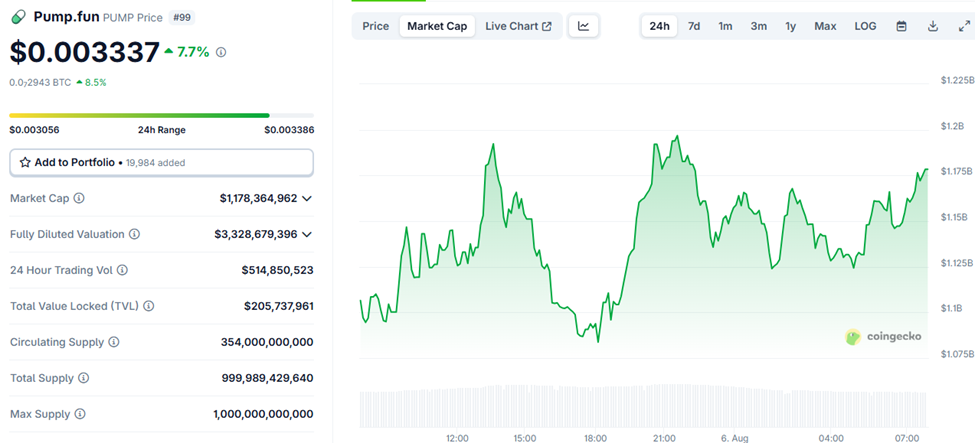
The meme coin market cap is down by nearly 7% in the last 24 hours, reflecting the broader market sentiment. Amidst the drop, Pump.fun token, PUMP, is bucking the trend, rising by nearly 8% in the same timeframe.
However, one whale, holding over one million PUMP tokens, may be at the cusp of exiting despite the public sale buying spree.
According to blockchain analytics firm Lookonchain, the whale had spent $5 million to buy 1.25 million worth of PUMP meme coins during the public sale, spreading the portfolio across five wallets.
During the early hours of the Wednesday session, this whale deposited their entire buy into the Kraken exchange, a move often associated with plans to sell. Notably, the prospective sell-off WOULD mean a loss of nearly $1 million.
Whale BfL4vh deposited 1.25B $PUMP($4.09M) into #Kraken 10 minutes ago.
This whale spent 5M $USDC to buy 1.25B $PUMP in the public sale across 5 wallets.
Selling now would result in a loss of nearly $1M.https://t.co/4YppkgR0qv pic.twitter.com/c2KEFxud6Q
Meanwhile, while this whale mulls an exit, another bought 1.06 billion PUMP tokens for $3.28 million on Tuesday. They also proceeded, opening a 3x long position on the meme coin.
These plays reflect an existing divergence in whale sentiment. Some see upside potential in PUMP, while others are losing confidence and cutting losses. This suggests short-term exit liquidity concerns, especially where some whales fear no further upside.
Further, it could also indicate broader meme coin market exhaustion, in which only new buyers with a higher risk appetite are still entering.
Pump.fun Price Outlook as PUMP Tests Resistance
The PUMP/USDT trading pair on the 4-hour timeframe shows Pump.fun token’s price testing the multi-week resistance due to the 78.6% Fibonacci retracement level at $0.003416.
A decisive daily candlestick close above this level on the 4-hour timeframe could see the meme coin retrace the most critical Fibonacci level, 61.8%, at $0.004161.
Based on the RSI (Relative Strength Index), momentum is rising, which increases the odds of PUMP price extending the gains. Its position at 67 shows PUMP is still not overbought, which means the gains could extend.
Similarly, the 50- and 100-day SMAs (Simple Moving Averages) at $0.002841 and $0.003028 accentuate the bullish thesis, providing support and offering an entry point for late bulls.
A successful reclamation of the 61.8% Fibonacci retracement level as support above $0.004161 could confirm a trend reversal. Such a MOVE would constitute a 20% climb above current levels and potentially set the stage for further gains.
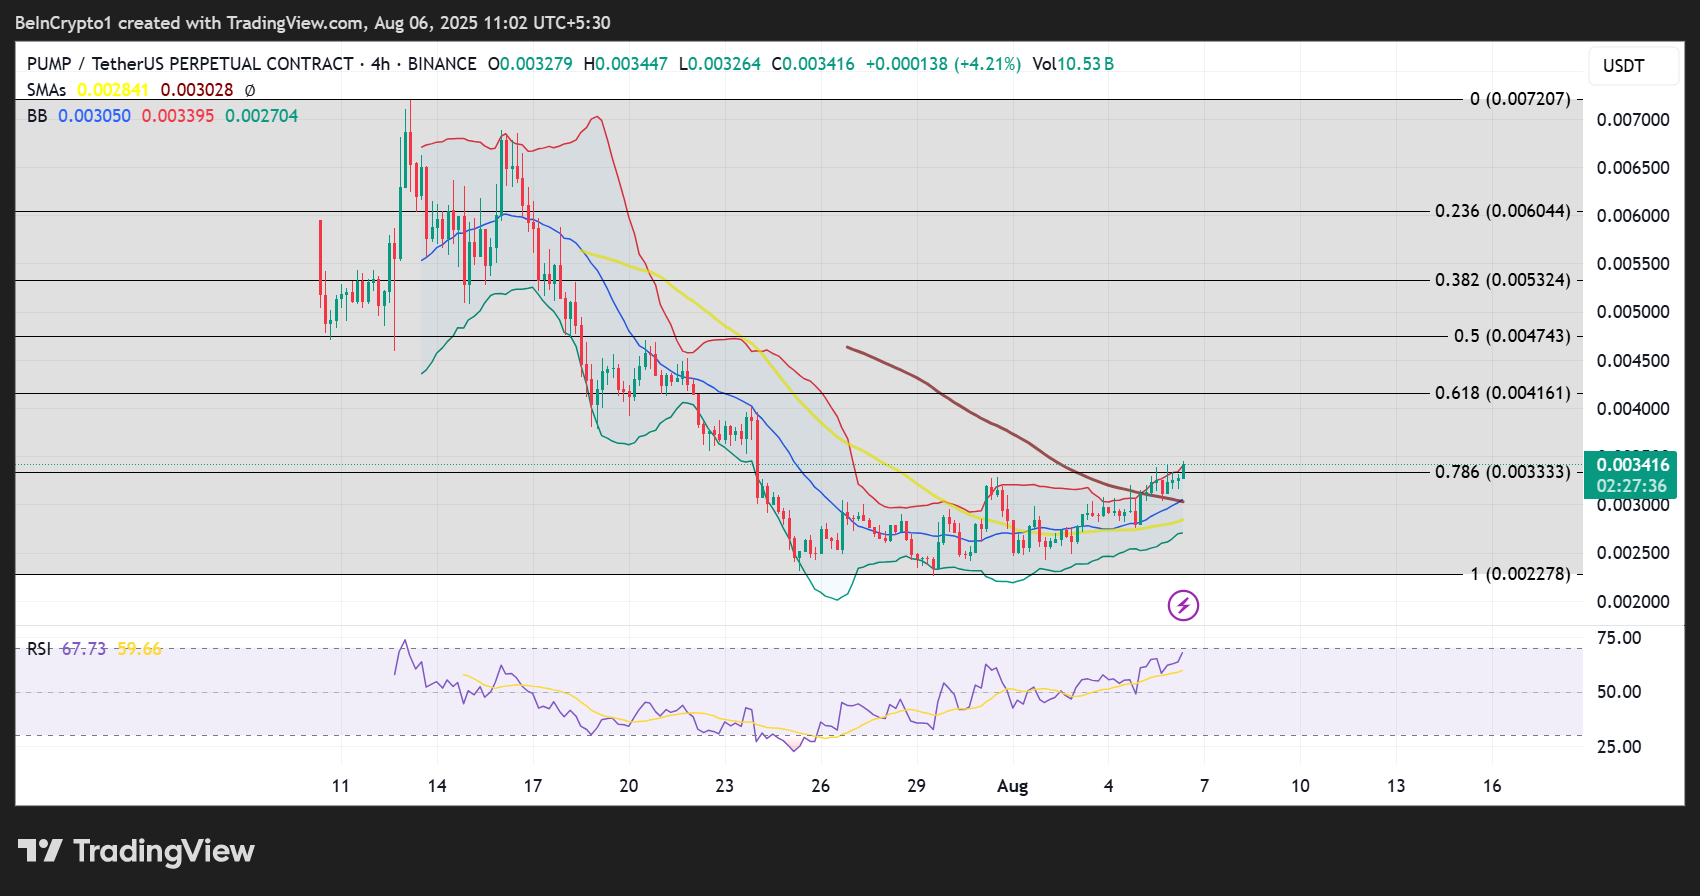
Conversely, with the PUMP price testing the upper boundary of the Bollinger Bands, a correction may be due amid buyer exhaustion.
If this happens, the midline of the Bollinger Bands could provide initial support where it converges with the 100-day SMA at $0.003050. This could be a good entry for bulls looking to capitalize on a near-term correction before the potential next leg up.
In a dire case, enhanced seller moment could see PUMP price slip below the midline of the Bollinger Bands at $0.003052, bringing the next level of support at $0.002842 due to the 50-day SMA.
Below this, the price could extend a leg lower, testing the lower boundary of the Bollinger Bands at $0.002697 before a possible bounce.
