Bitcoin’s Make-or-Break Moment: RSI Signals $95K Plunge or $119K Surge Ahead

Bitcoin traders, brace yourselves—the king of crypto is flashing its most volatile signal in months.
The Relative Strength Index (RSI) just painted a fork in the road: either a gut-wrenching correction to $95K or a moonshot to $119K. No middle ground.
Technical Tug-of-War
Market technicians are glued to their screens as Bitcoin's weekly RSI teeters at a critical inflection point. Last time these conditions appeared, BTC either rallied 40% or bled 25% within two weeks.
Institutional traders are reportedly positioning for both scenarios—because why pick one narrative when you can over-leverage on both? Classic Wall Street hedging meets crypto's signature volatility.
Retail's Gamble
Meanwhile, retail traders are splitting into two camps: 'Buy the dip' maximalists versus 'Short the top' contrarians. Exchange order books show massive liquidity clusters at both $95K and $119K—like a high-stakes game of pinball waiting to launch.
One thing's certain: someone's about to be very right, and someone's about to post 'rekt' screenshots. Welcome to crypto's perpetual casino.
Technical Signals Creating Short-Term Market Sentiment Divergence
Bitcoin (BTC) is facing two opposing scenarios shaped by momentum indicators, with the RSI (Relative Strength Index) at the center across multiple timeframes. According to analyst Ali, the last two times, the weekly RSI dropped below the 14-period SMA. As a result, Bitcoin corrected between 20% and 30%.
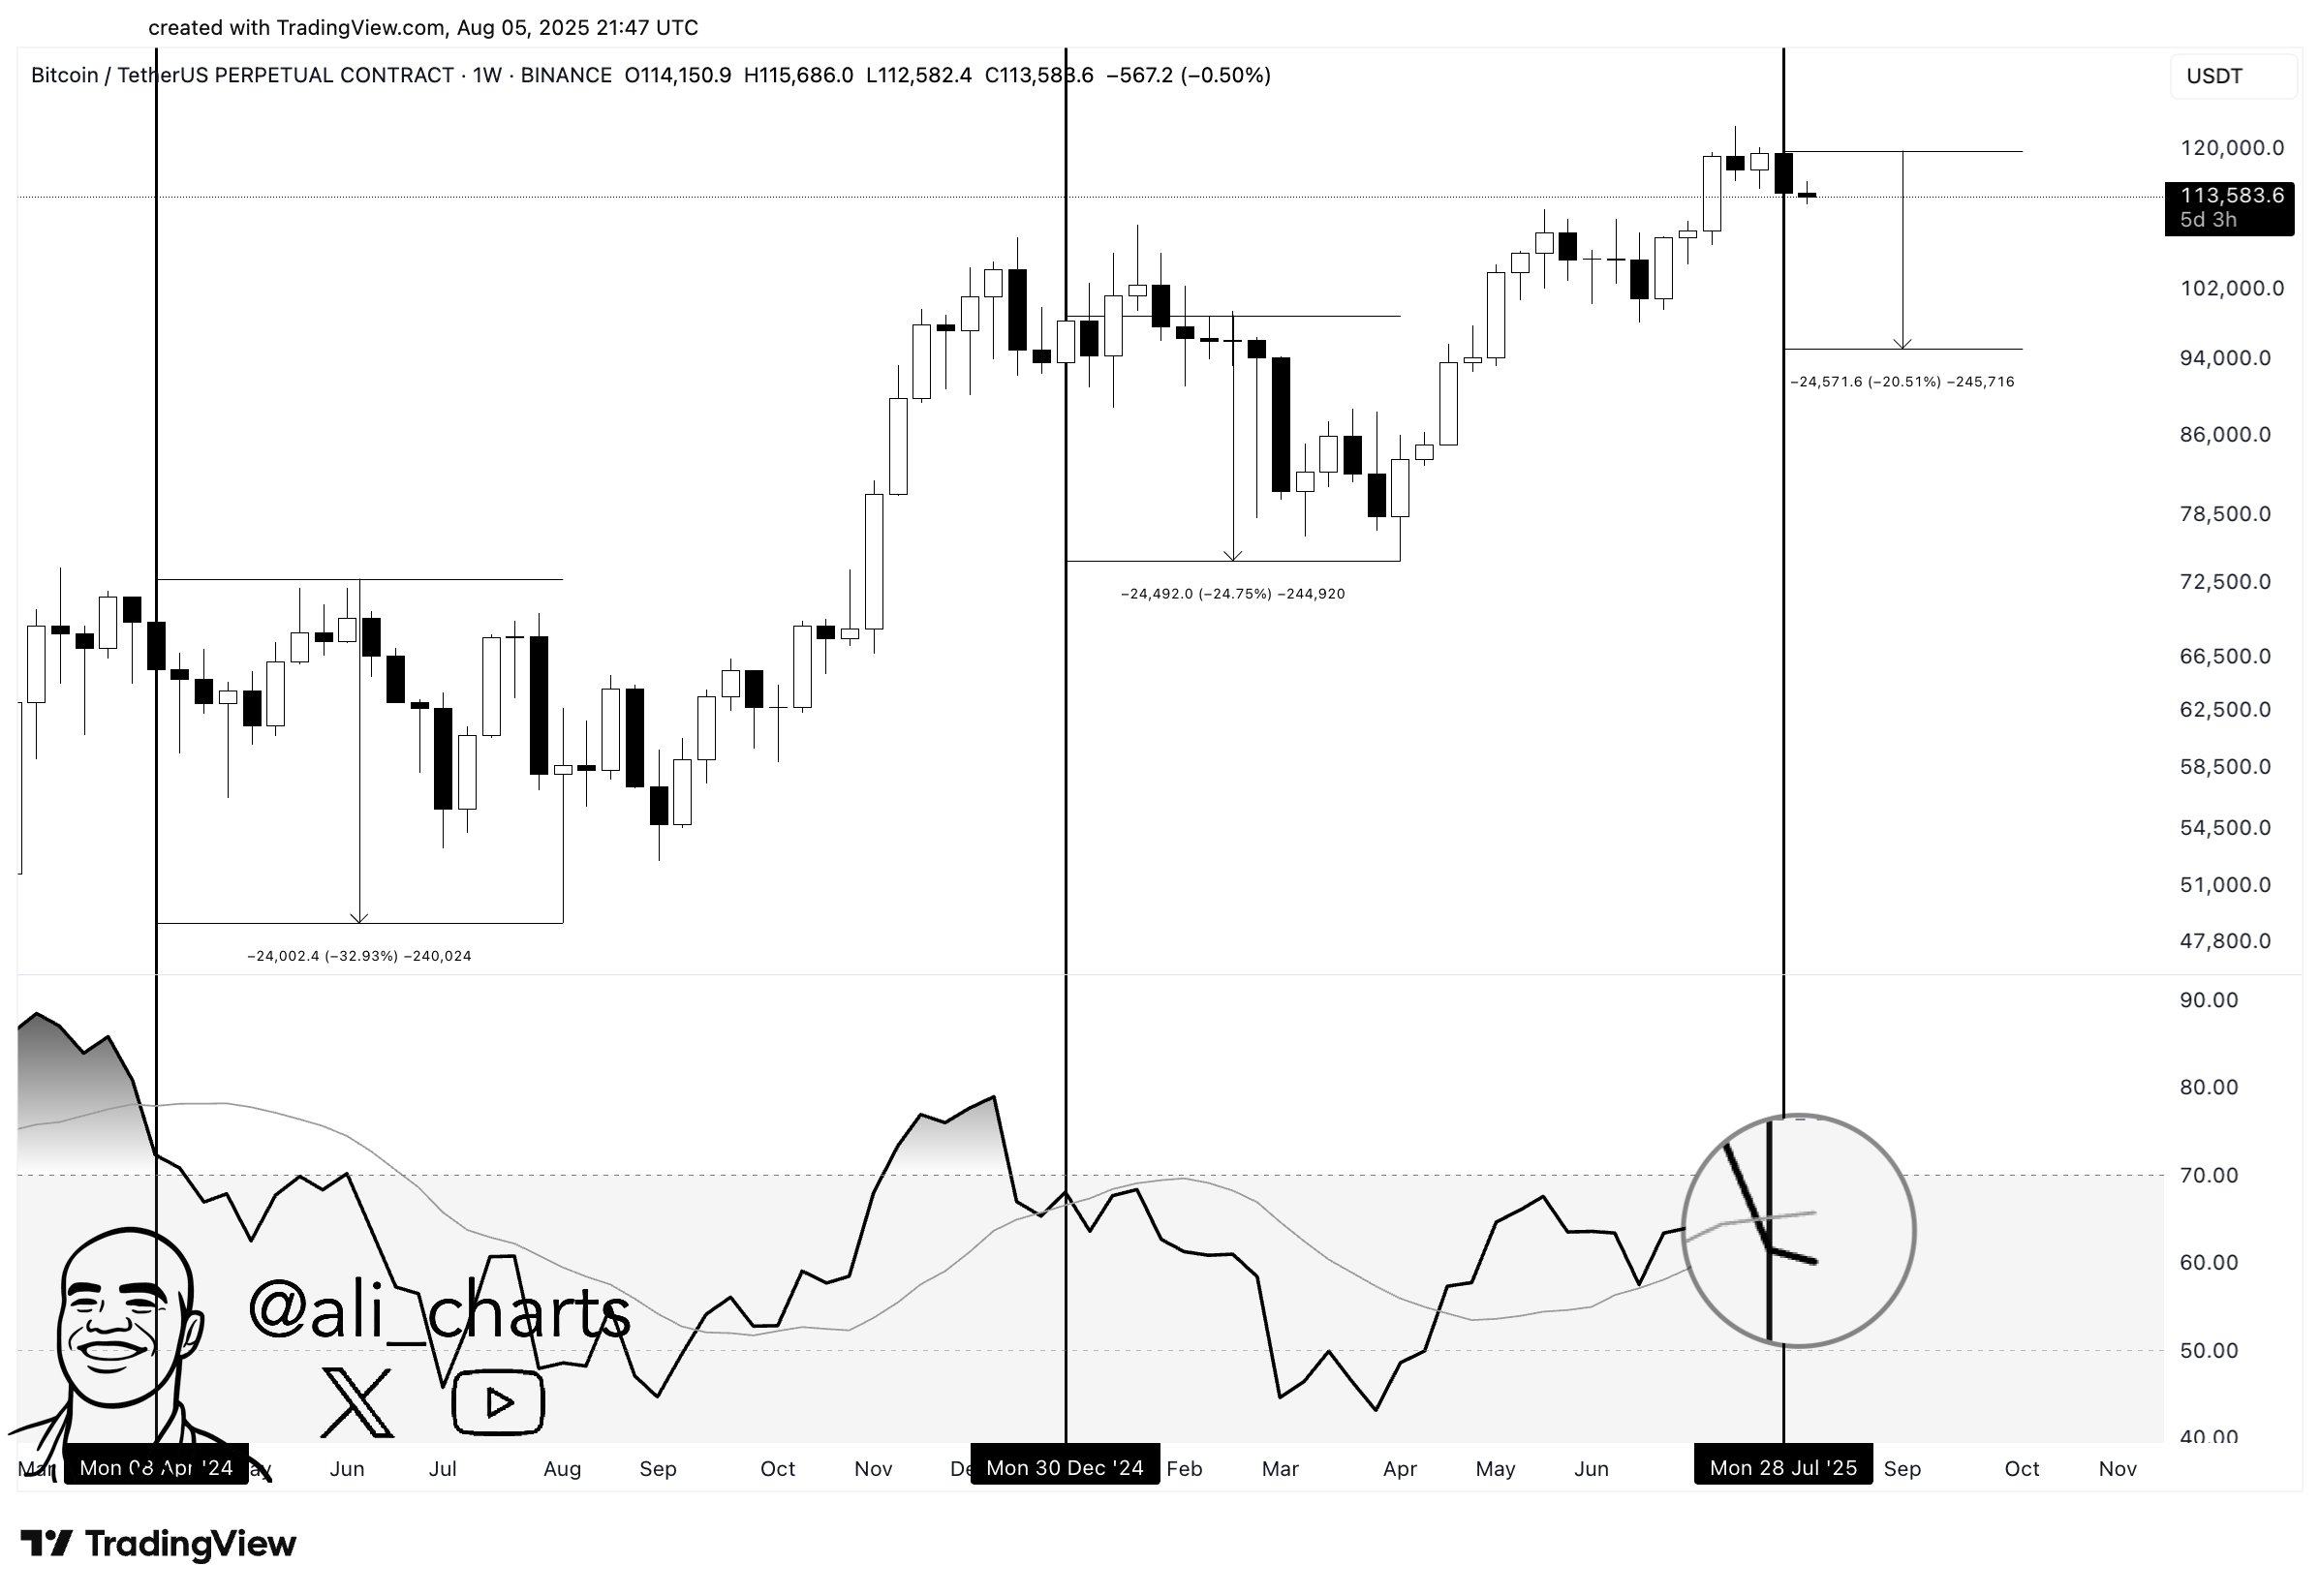
“If history repeats, we could see a move down to $95,000!” Ali commented.
In a previous analysis, Arthur Hayes predicted a sharp correction in the cryptocurrency market. He predicted Bitcoin to hit $100,000 and Ethereum to hit $3,000.
Continuing to observe the RSI, on the daily chart, analyst Sykodelic noted that the RSI is now at a level similar to the previous bottom around ~$98,000 and close to the low seen at ~$76,000. This suggests that short-term selling pressure has weakened, and the current region could be an accumulation point.
From another perspective, analyst Caleb Franzen pointed out that bitcoin has broken through the lows identified by a bullish RSI divergence. When price makes lower lows but RSI does not follow suit (bullish divergence), it signals weakening downward momentum. Conversely, a bearish divergence occurs when the price rises but RSI falls, warning of a potential downward reversal.
Given this setup, Caleb believes the move could pave the way for a rebound toward $119,000. At the same time, this level becomes a critical threshold; breaking below WOULD invalidate the bullish scenario.
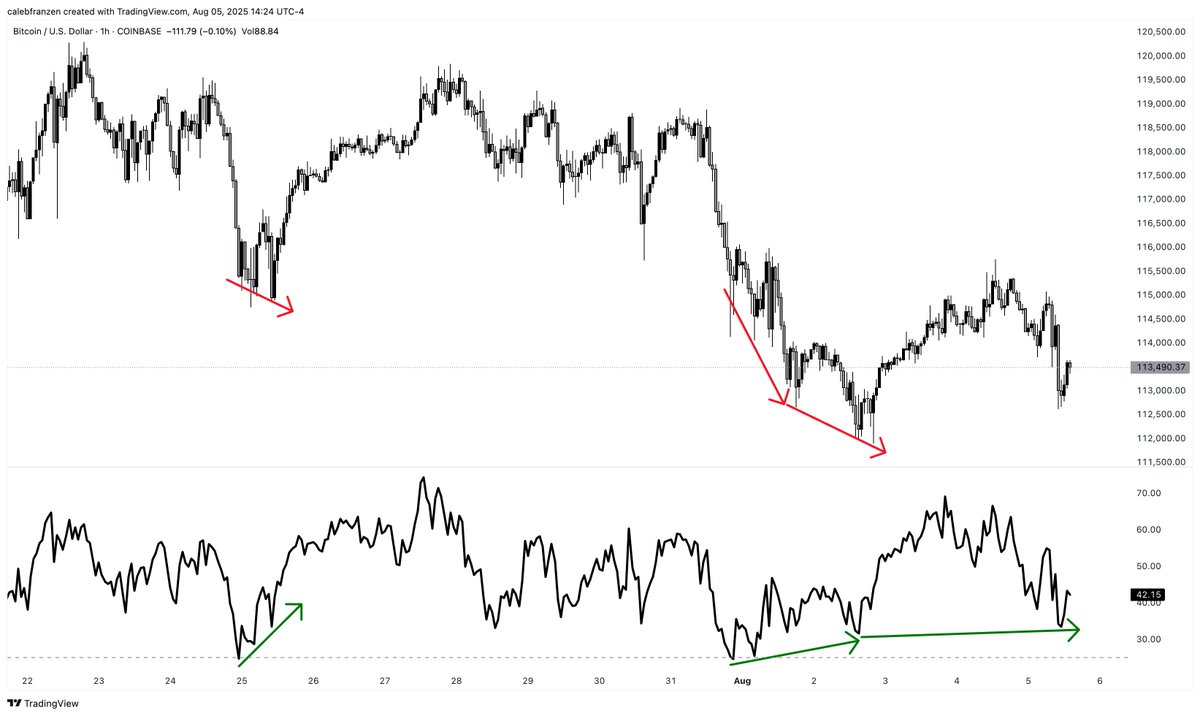
In this context, a decline to $95,000 could serve as a “reset phase” to reaccumulate buying power. On the other hand, the $112,600 support zone is currently seen as a crucial level to maintain the rebound outlook.
If the price holds this area, along with confirmation of bullish divergence on the RSI, a bounce back to the $119,000 zone would have technical merit. Further confirmation from volume, moving averages, and daily closes above key thresholds is required. This confirmation helps mitigate the risk of false signals.
