XRP Rally Imminent? This Chart Signals Explosive Movement Ahead

XRP traders, buckle up—technical patterns hint at a potential breakout. Here's why the sleeping giant might wake up swinging.
The Setup: A Coiling Spring
Symmetrical triangle formations don't lie. When volatility contracts this tight, the resulting move typically matches the preceding trend's ferocity.
Liquidity Pools Primed
Order book clusters show massive bid walls at key psychological levels. Market makers love exploiting these zones—whether for genuine accumulation or stop-hunting theatrics.
Regulatory Overhang Fading?
With the SEC's latest enforcement theater wrapping up, institutions might finally stop pretending they care about 'compliance risks' and chase the damn chart.
Timing crypto pumps is like predicting Wall Street bonus seasons—everyone acts surprised when it happens like clockwork. XRP's next leg up? Probably before your favorite VC-funded 'web3' project delivers its promised roadmap.
Exchange Flows and Liquidation Map Hint at a Short Squeeze Setup
One of the main reasons XRP hasn’t seen a clean rally is the increased selling pressure on exchanges. Net inflows have started rising again, especially after July 30, when the price approached $3.00.
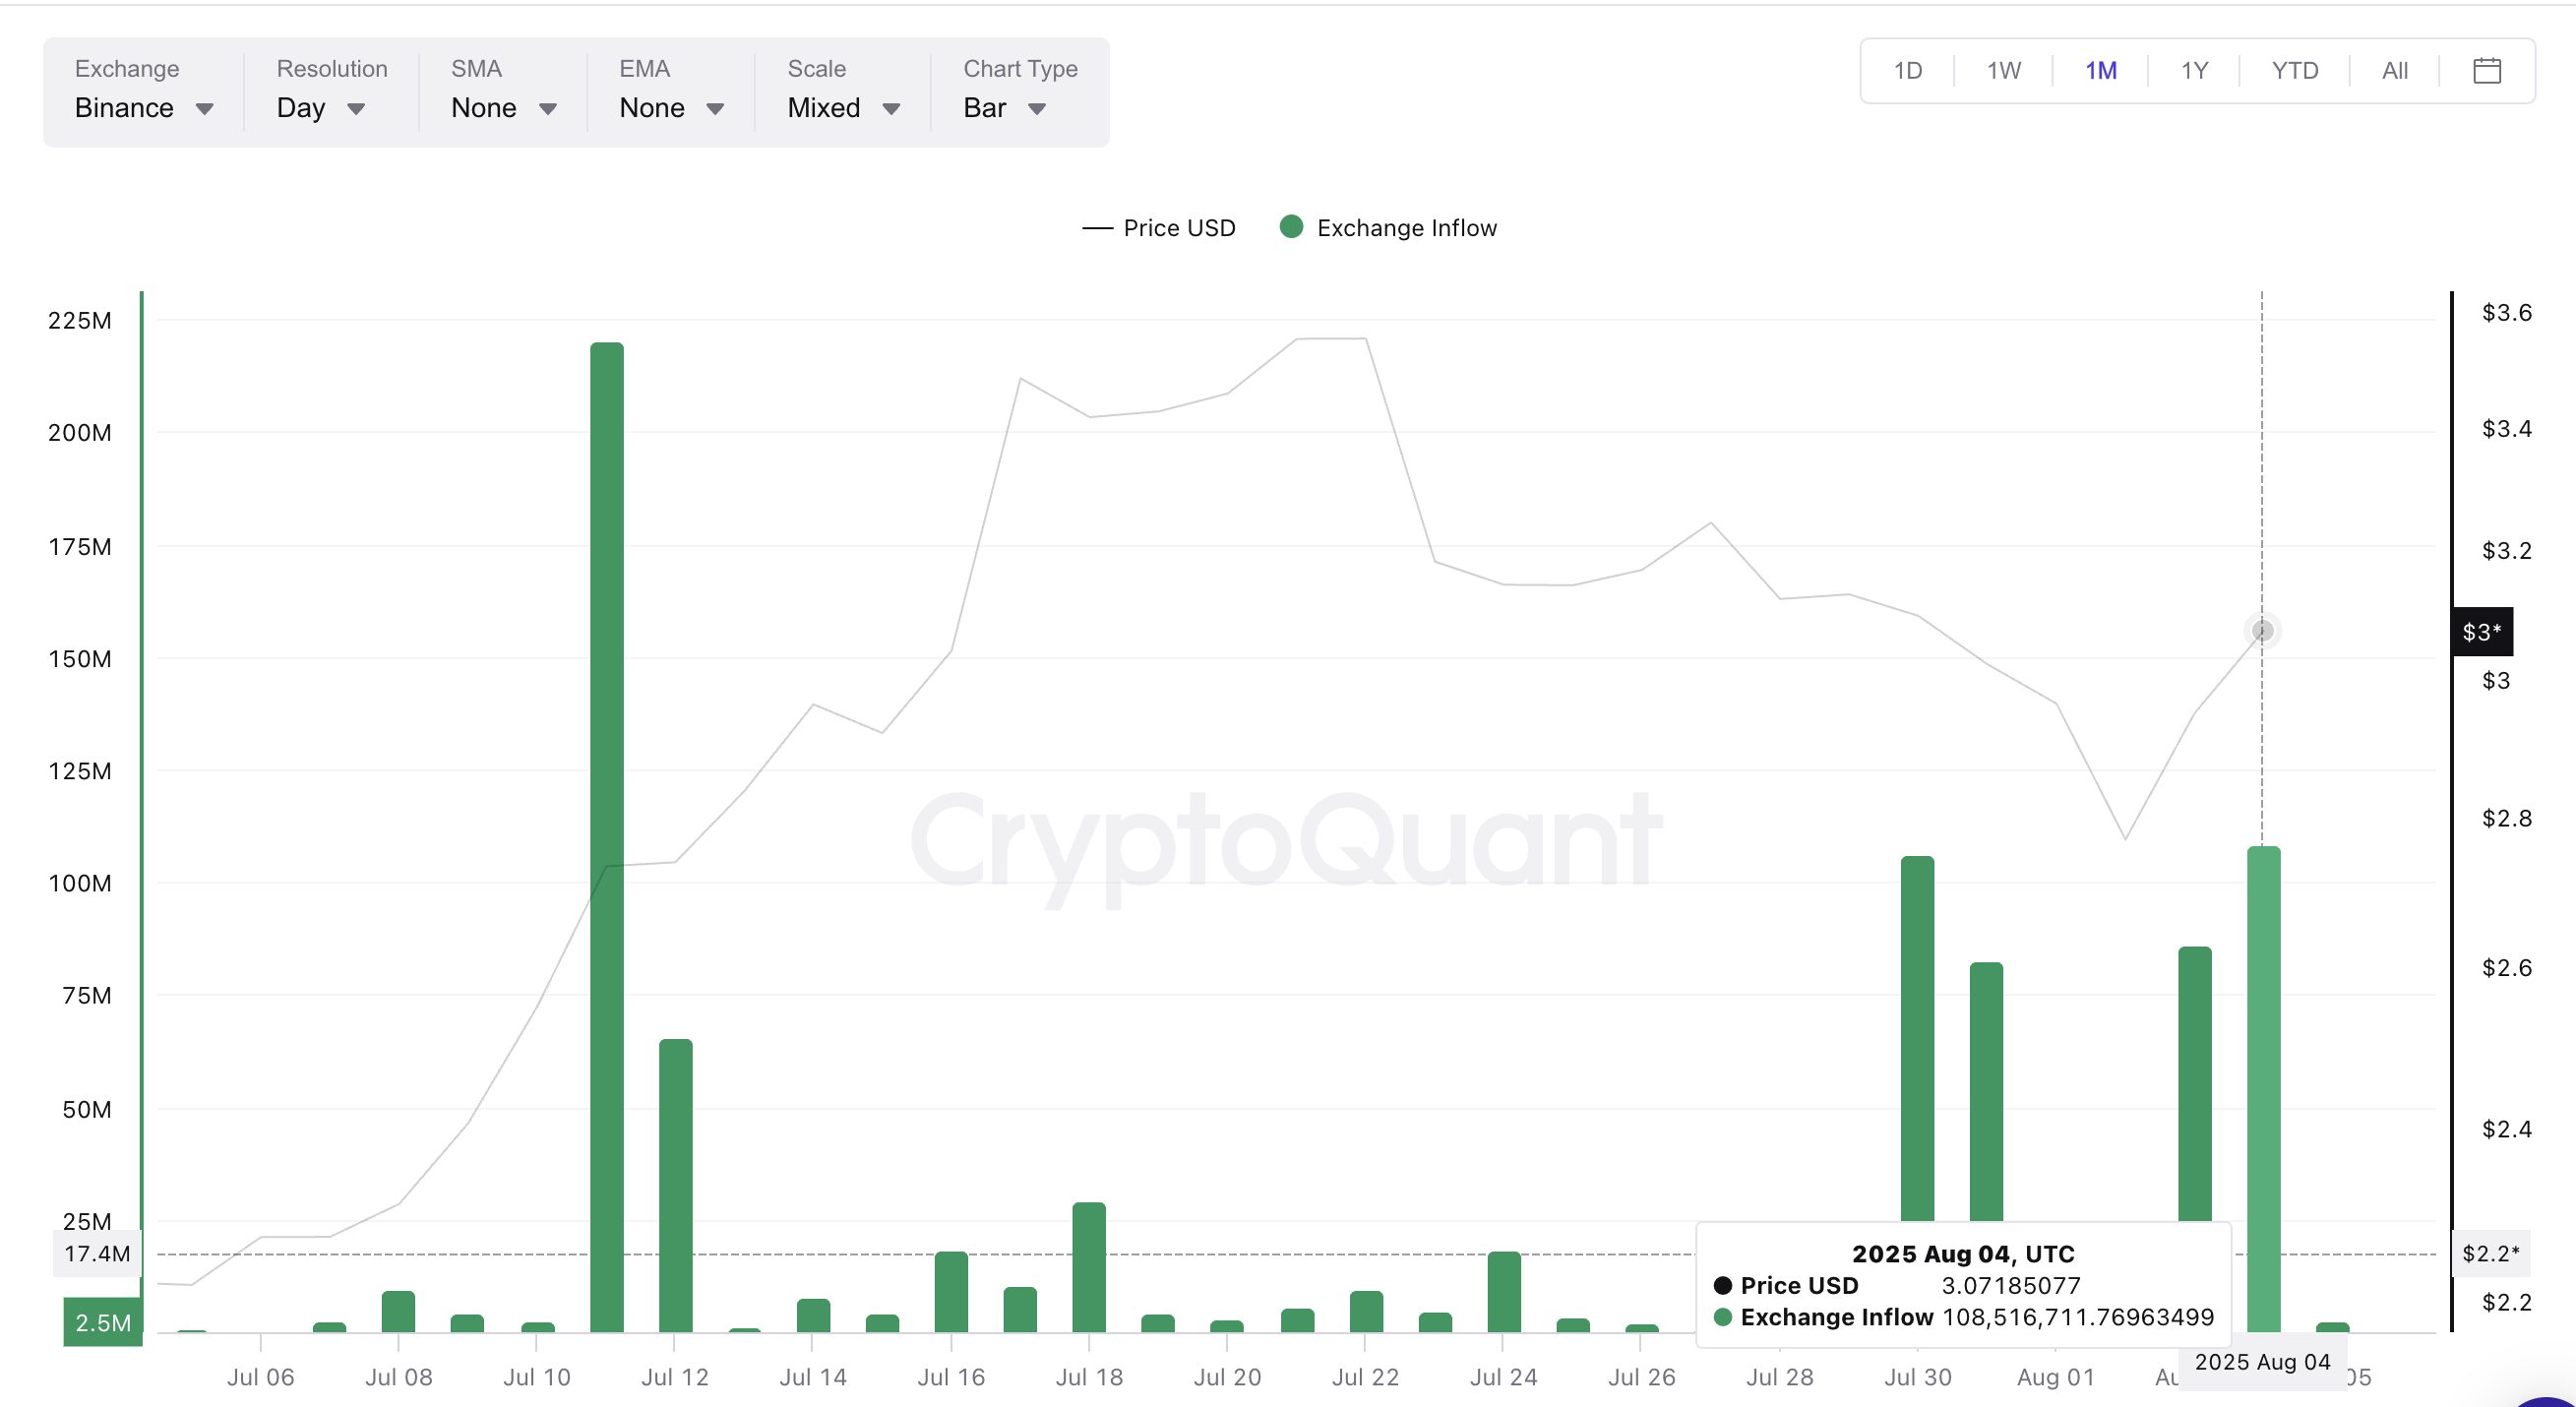
A similar MOVE was seen on July 11, when exchange inflows surged to over 220 million XRP. Back then, the price didn’t correct right away. Instead, it climbed past $3.60, and only later did selling catch up. This indicates that traders were positioning themselves to exit near the top, keeping funds on exchanges without immediately selling.
Fast forward to now: inflows are rising again, hinting that traders may be readying to sell if XRP climbs above $3.00. But despite this bearish setup, the liquidation map tells a different story. It might be telling when the actual selling WOULD start.
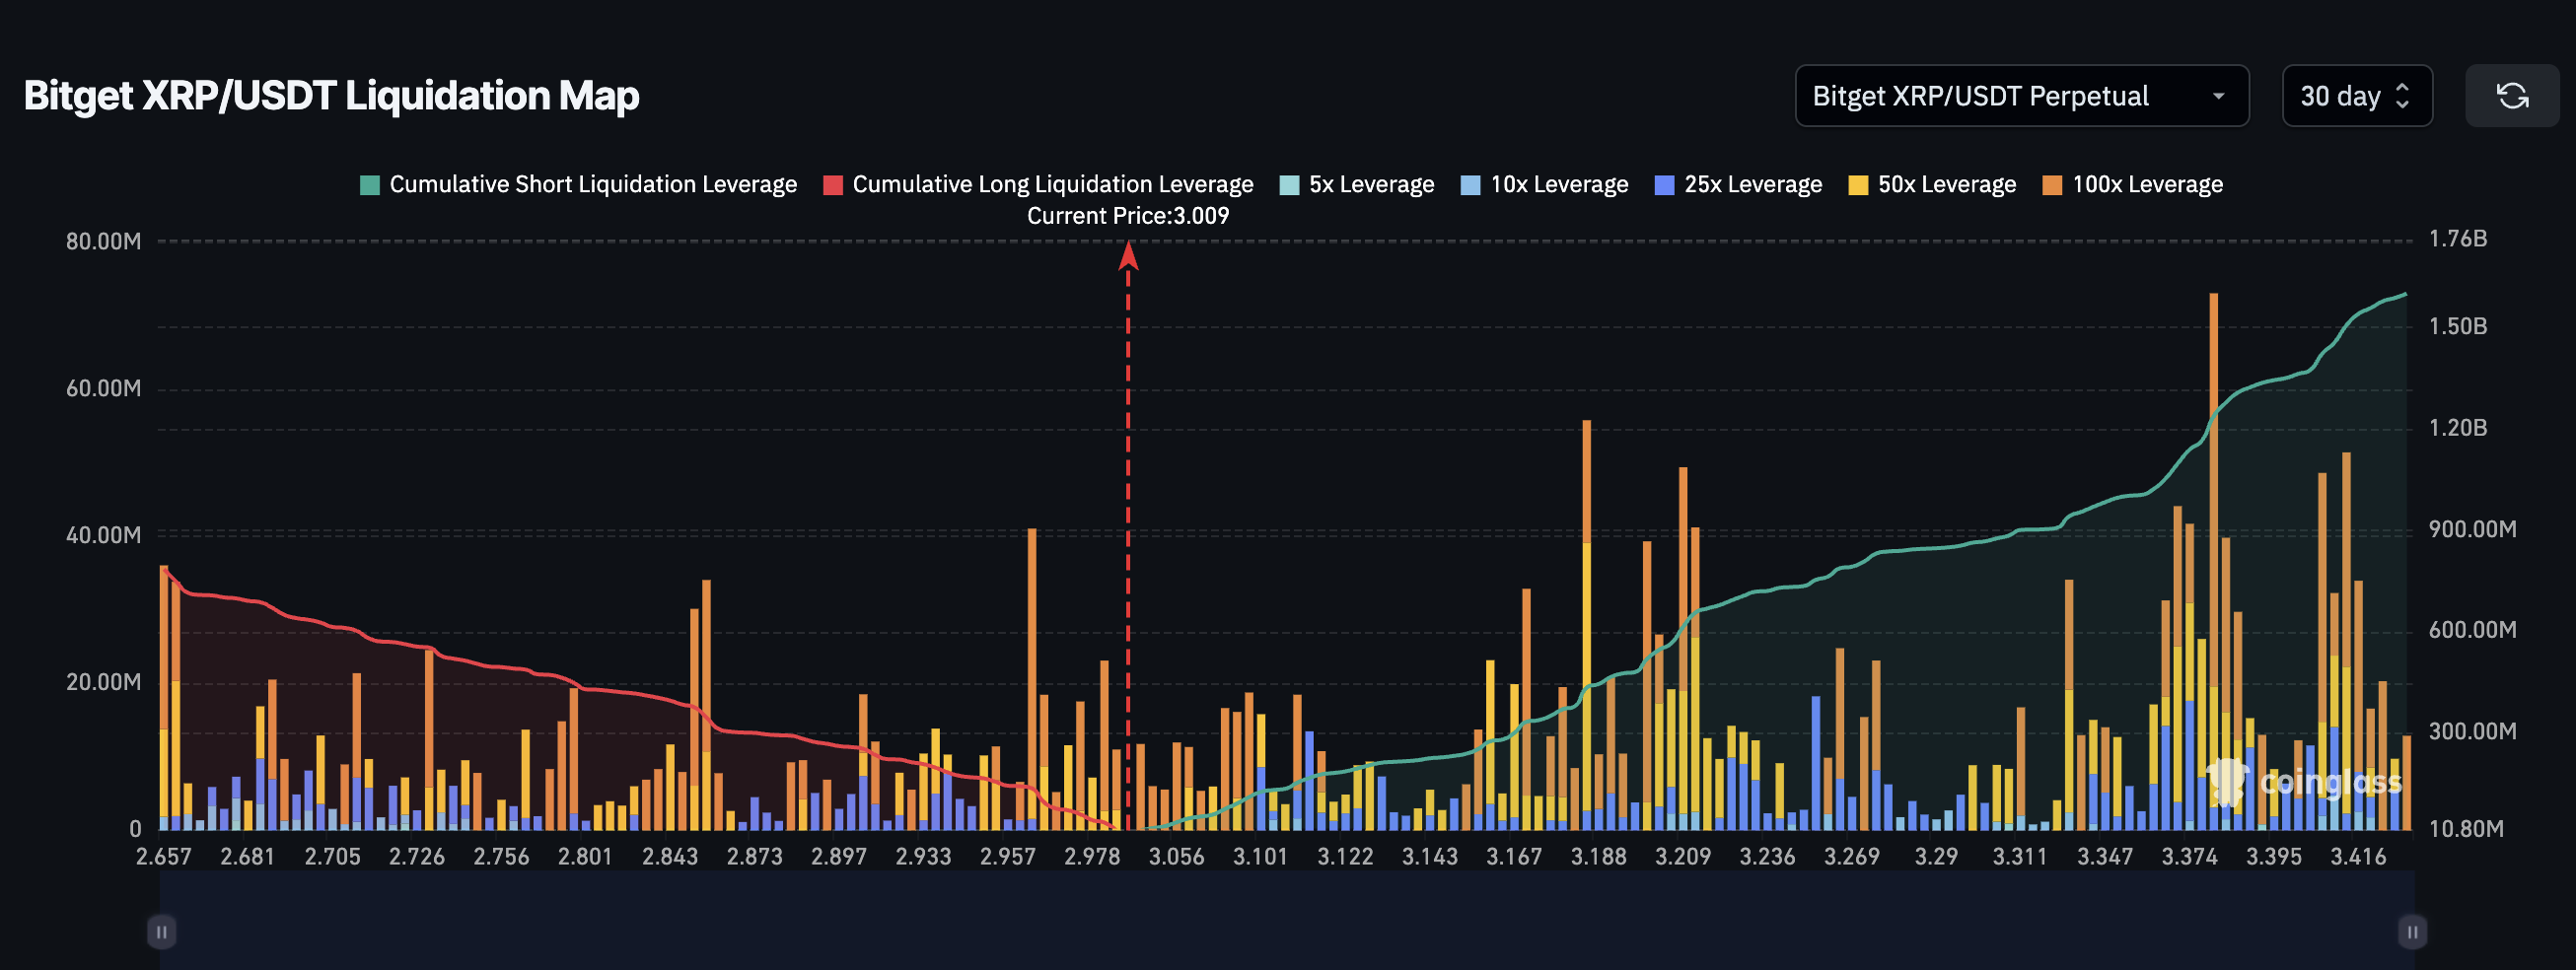
XRP’s liquidation data from Bitget shows the market is still skewed heavily towards shorts. Short positions add up to $1.6 billion, while longs stand at just $784 million. This imbalance means a sudden upward move could liquidate a large number of shorts, setting up a classic short squeeze. With the current price hovering near $3.00, a 10% to 14% upmove could trigger a squeeze all the way to $3.40.
Note: Something similar happened between July 24 and July 27 when the xrp price surged from $2.95 to over $3.30 without any obvious trigger. While that raised price manipulation doubts, something similar couldn’t be ruled out.
: Want more token insights like this? Sign up for Editor Harsh Notariya’s Daily crypto Newsletter here.
Are Whales Fueling the Move, Or Sitting Out?
Interestingly, whales might also have a role to play in driving this move. Data from whale-to-exchange flows shows that large holders were selling aggressively during the past rallies. On July 30, whale inflows spiked to over 55,000 XRP, the highest level in a month, as the XRP price dipped under $3.00. Again, on August 3, inflows touched 38,226 XRP as the price neared $3.00.
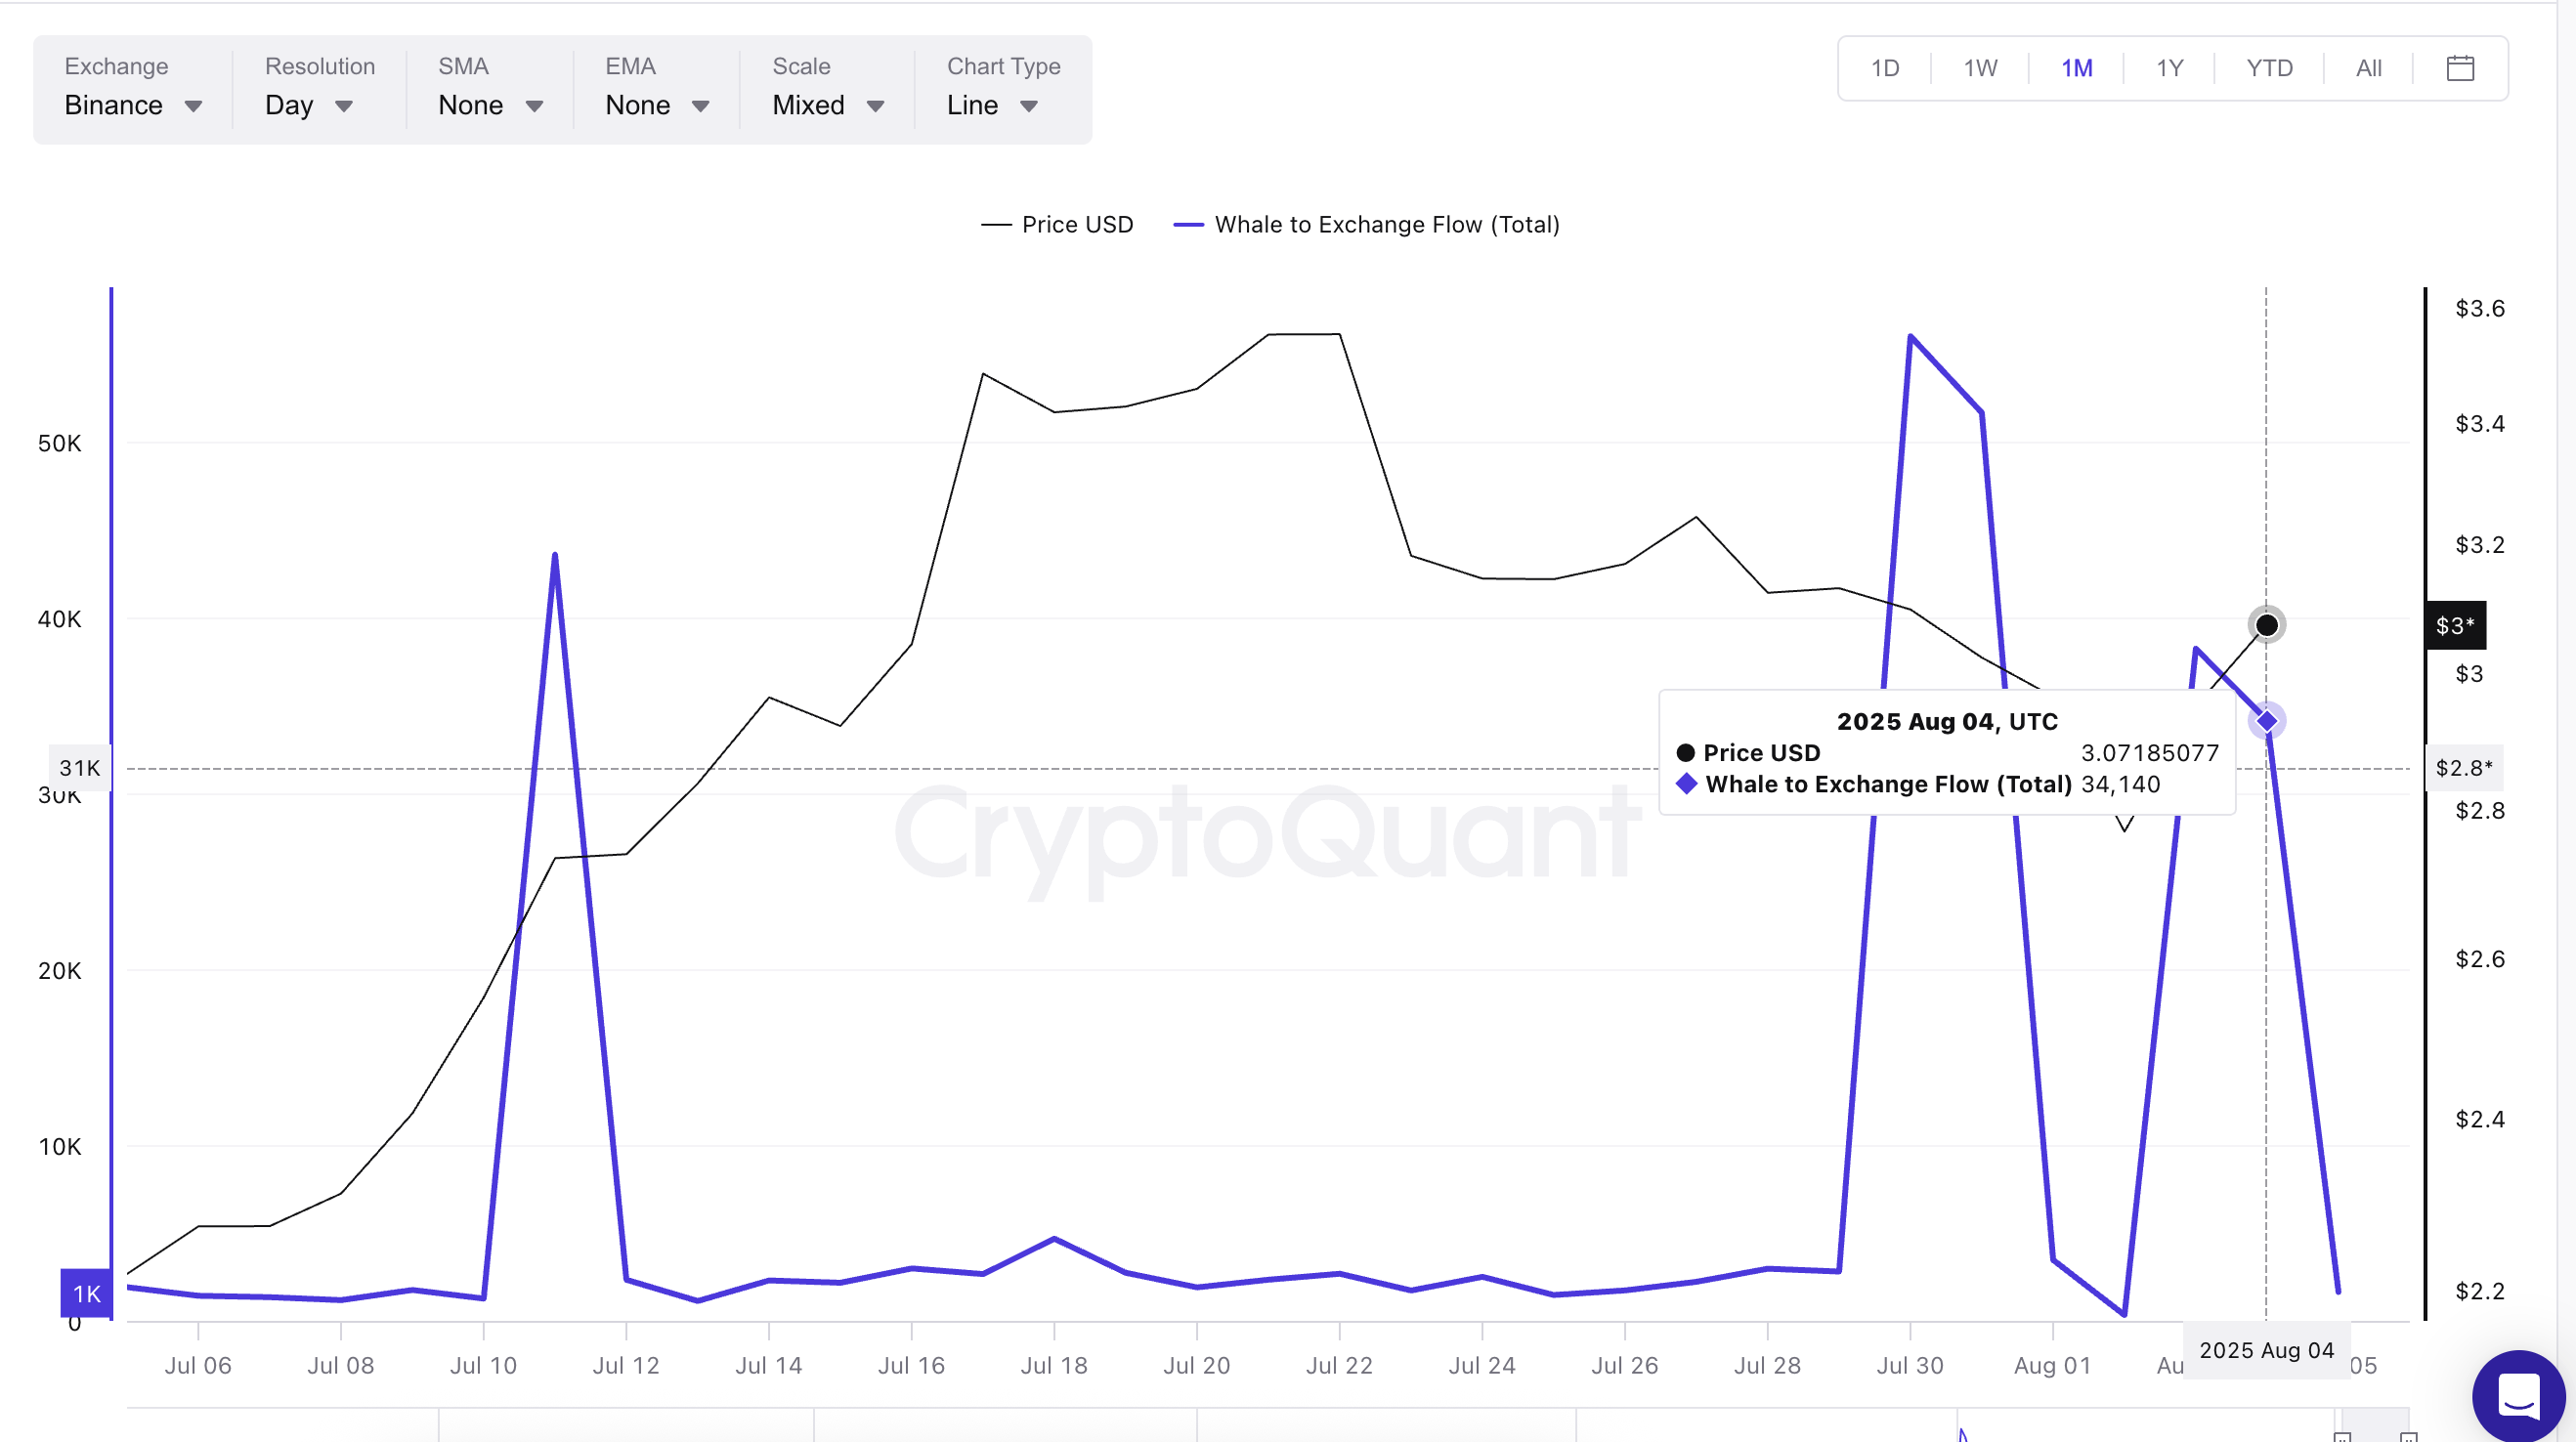
But since then, inflows have dropped to 34,140 XRP on August 4, even as the XRP price remains above $3.00. This shows a divergence: while the price climbs, whales are sending fewer tokens to exchanges. That could mean they’re cautiously watching. Or it might mean that the whale-led selling pressure has finally eased. Either of these signals looks bullish for the XRP price in the short term.
Still, if whale flows rise again near the $3.08–$3.30 zone, it could create enough sell pressure to cap the “short-squeeze” move. Traders should closely watch whale behavior before expecting any sustained rally.
Whale-to-exchange FLOW tracks how many tokens large holders (whales) are sending to centralized exchanges; a high number often signals intent to sell, while lower flow can mean whales are holding.
XRP Price Pattern Points to Key Breakout Zone at $3.30
XRP’s current price structure sits inside a falling broadening wedge, a chart pattern often seen before bullish breakouts. The pattern is defined by two diverging trendlines sloping downward, with price bouncing between them. XRP is now nearing the upper trendline of this wedge, and a breakout above $3.19 would place it firmly on track to challenge $3.30.
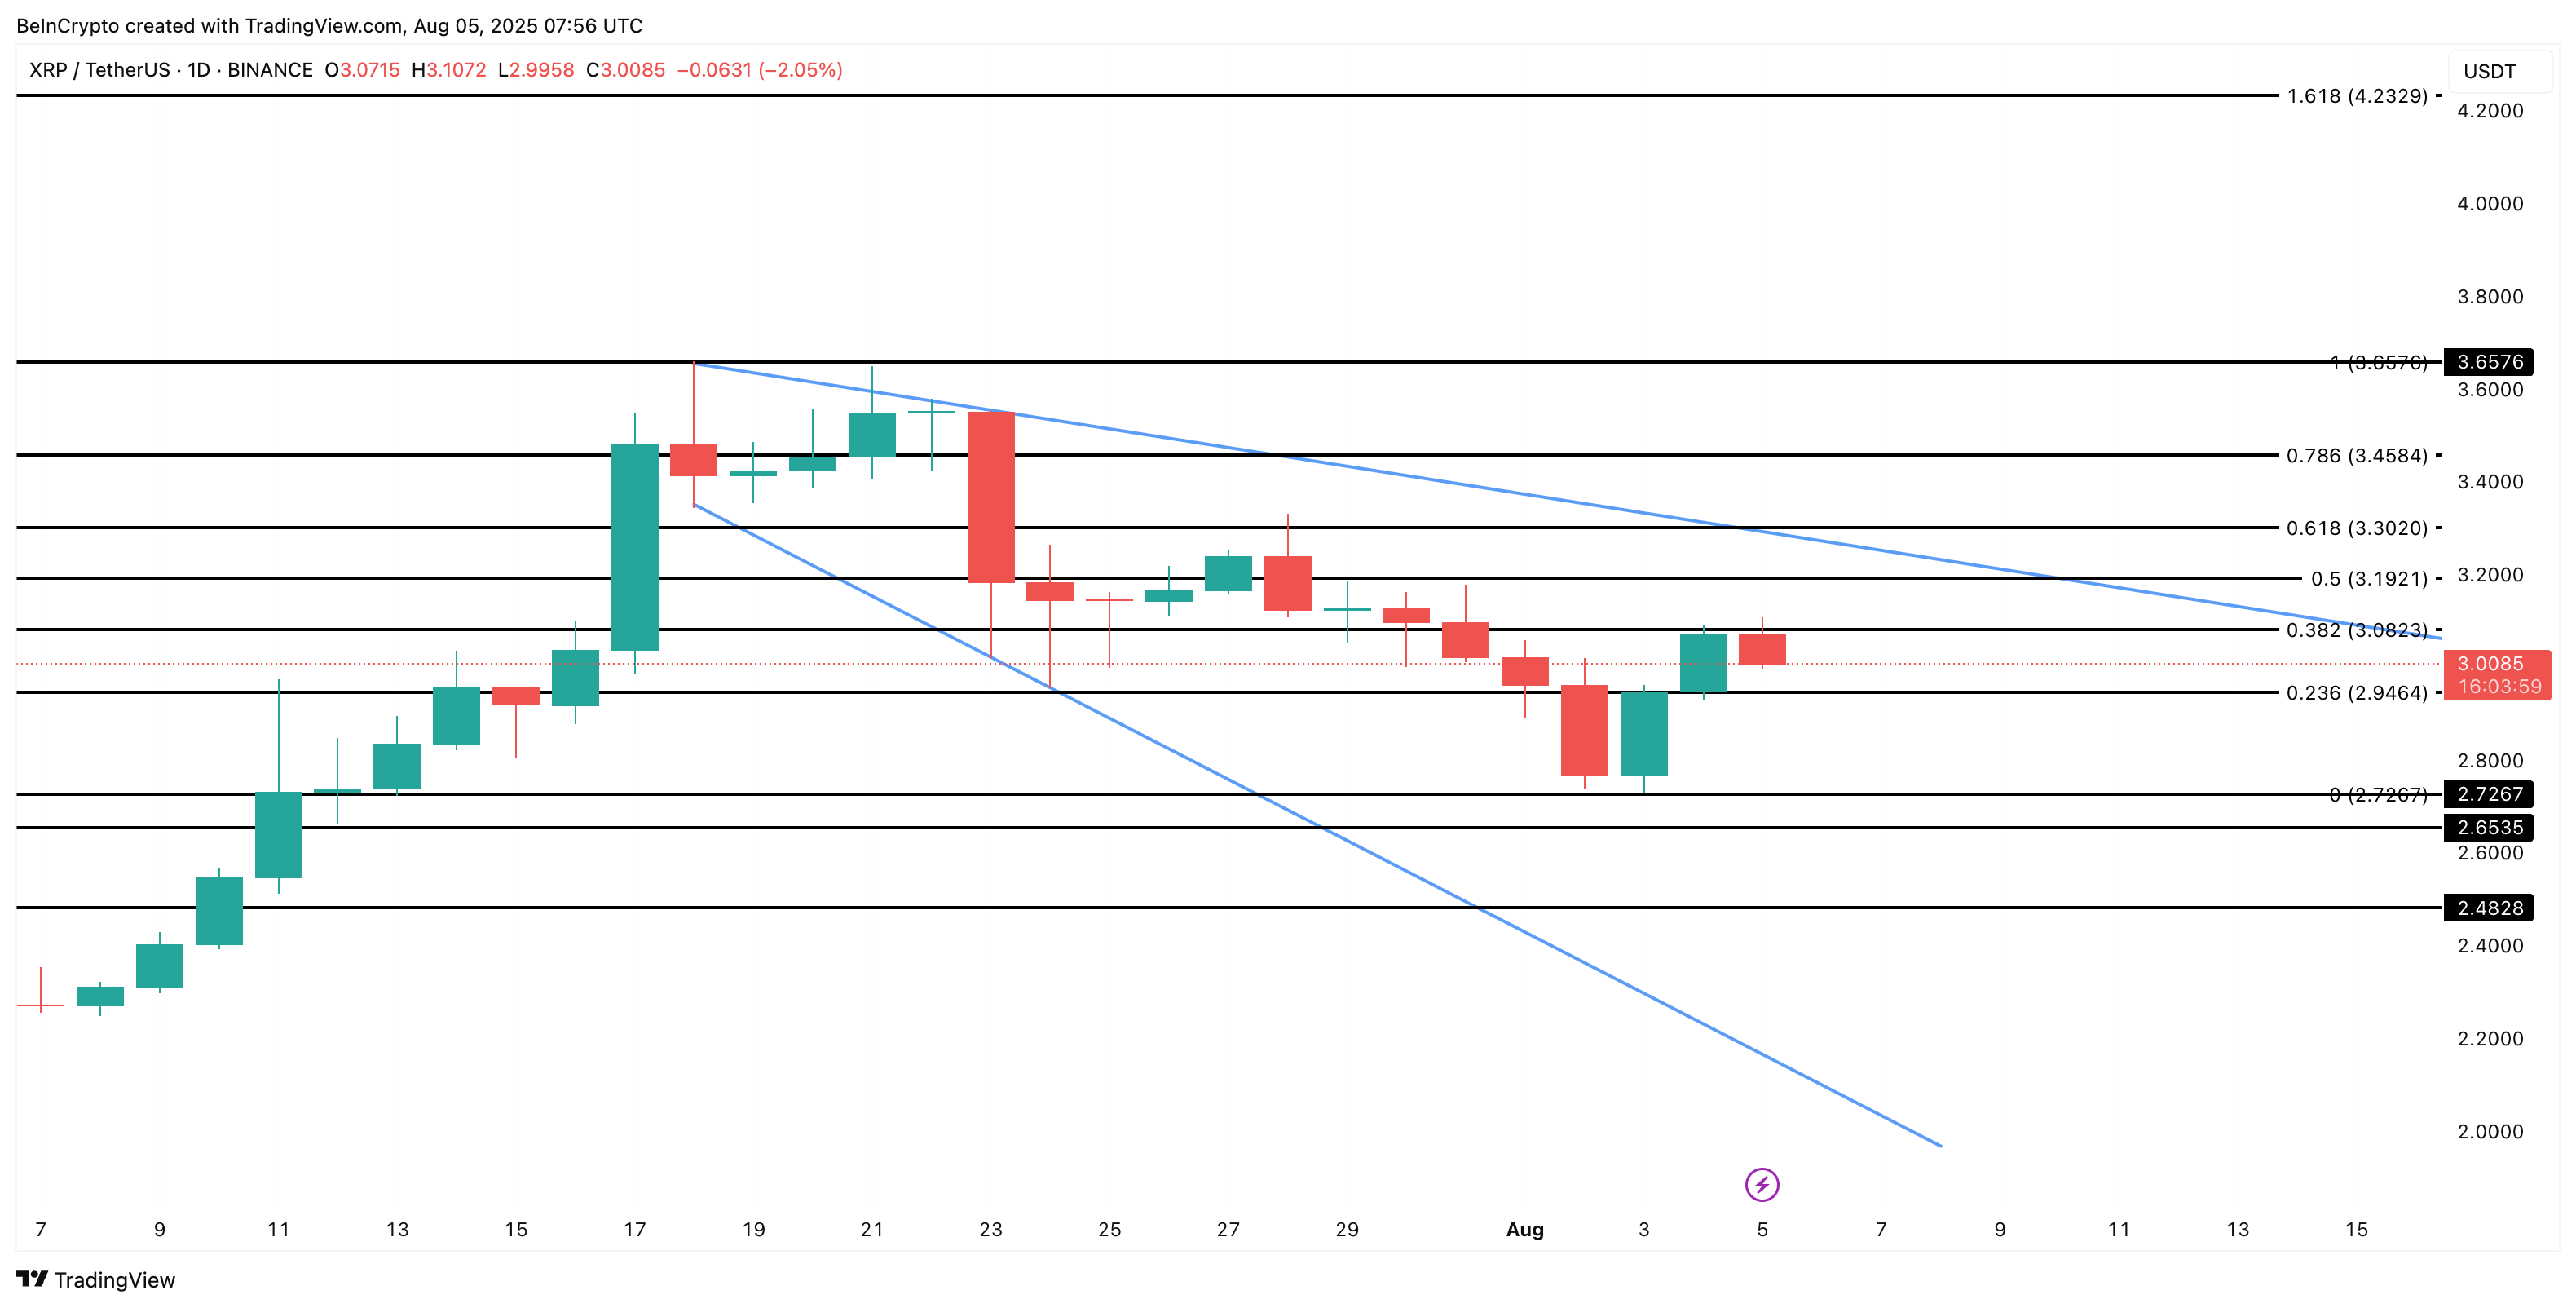
The $3.30 level is more than just a round number. It lines up with a key Fibonacci retracement level and coincides with the bulk of the liquidation cluster. If XRP crosses this mark, it could trigger a wave of liquidations that clears the path for a stronger breakout. Until then, moves between $3 and $3.3 should be seen as part of a potential short squeeze, not a full rally yet.
A rally might end up happening if XRP manages to cross $3.45, a key Fibonacci target. At this price, all short positions per the Bitget chart would be liquidated. Till then, the short-squeeze narrative holds.
However, failure to hold above $3 and a breakdown below $2.72 would invalidate the bullish setup, possibly leading to steeper losses.
