3 Ominous Bitcoin Divergences Flash Warning Signs This August – Time to Worry?

Bitcoin's August blues hit harder than a Wall Street banker's Monday morning. Three critical divergence signals are screaming for attention—just as institutional money starts sweating through its tailored shirts.
The setup: Technicals and fundamentals are pulling in opposite directions like a crypto hedge fund's internal reporting. On-chain metrics, price action, and institutional flows haven't been this misaligned since the last 'generational buying opportunity' (that vaporized portfolios).
Why it matters: When Bitcoin's indicators diverge, markets tend to converge—on pain. The last time these three signals appeared together? Let's just say Lambo dealerships saw cancellations.
The kicker: All this happens while traditional finance 'experts' still can't decide if crypto is dead or about to 'go mainstream.' Spoiler: Their track record's worse than a leveraged NFT trader's.
Divergence Between Bitcoin and Weekly RSI
The first warning sign comes from the Relative Strength Index (RSI) on the weekly timeframe. Analysts are worried because this signal closely resembles the setup seen in 2021.
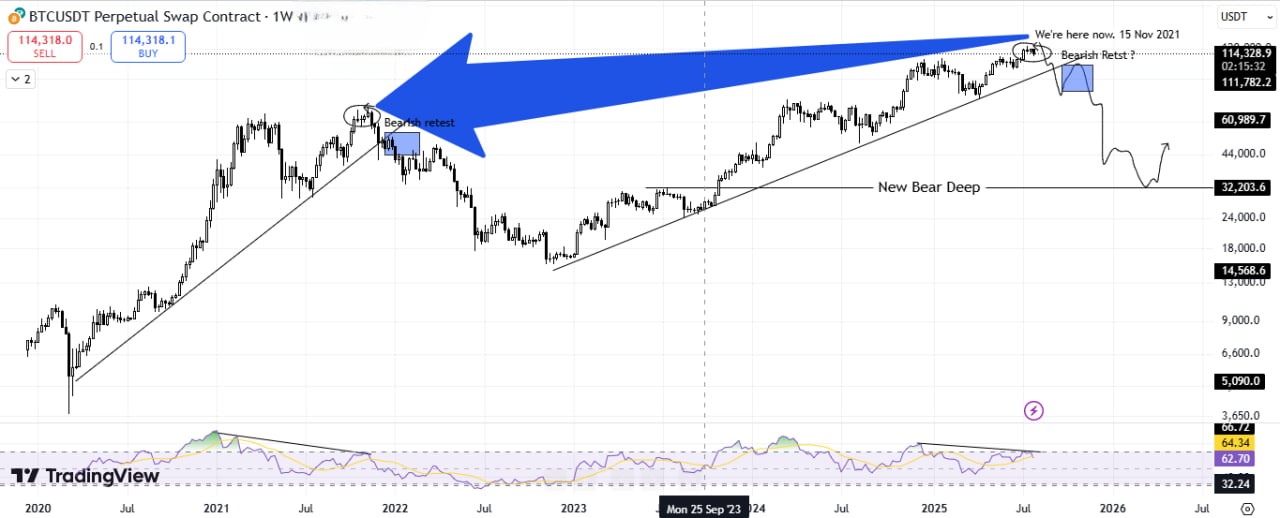
According to analyst Onur Barik, Bitcoin’s current weekly chart structure resembles its 2021 peak in alarming ways. Specifically, while Bitcoin has formed a higher high, the RSI shows a lower high — a classic bearish divergence.
Based on this setup, Barik predicts a possible downtrend for Bitcoin.
“If this plays out like 2021, a clean trendline break followed by a bearish retest could trigger a full structure shift,” he forecasted.
However, from a fundamental perspective, Ki Young Ju, CEO of CryptoQuant, recently shared a different view. He stated that “the bitcoin cycle theory is dead,” suggesting that comparisons with previous cycles may no longer be relevant.
Divergence Between DXY and Bitcoin
A recent report from BeInCrypto noted that the US Dollar Index (DXY) hit a two-month high after the Fed decided to keep interest rates unchanged. Several analysts have also warned that the DXY may continue its upward trend in August, which could put downward pressure on Bitcoin.
These warnings are becoming more credible as the chart reveals a renewed divergence between DXY and Bitcoin.
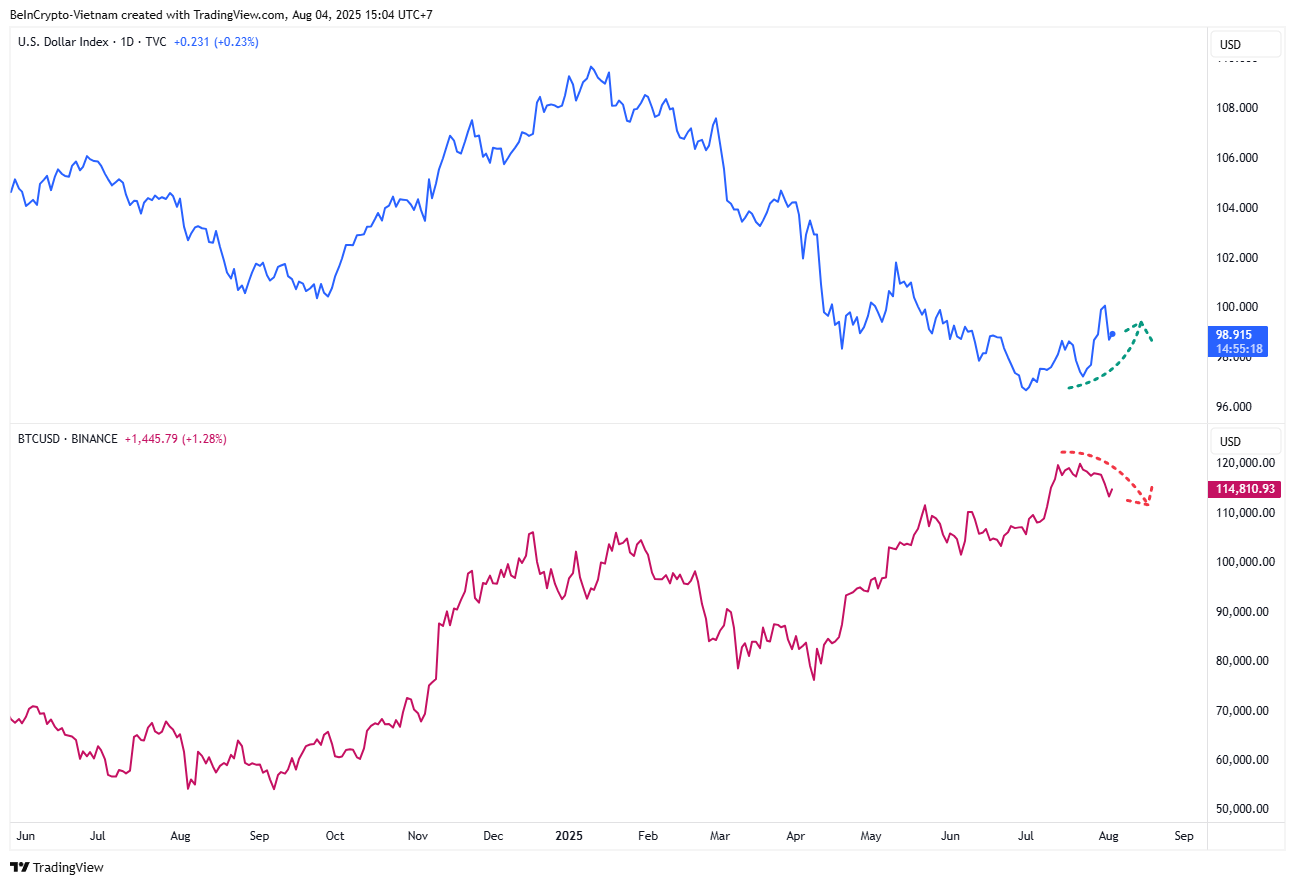
To illustrate, as the DXY climbed from 96.7 to 98.9 points, Bitcoin dropped from $120,000 to $114,000. Analyst John Kicklighter believes the DXY is forming an inverse head-and-shoulders pattern — a classic signal indicating a potential rally.
The $DXY inverse head and shoulders reversal we had at the beginning of the week is seeing a retest of the 'neckline' as former resistance, new support pic.twitter.com/A0jbvo3oJ4
— John Kicklighter (@JohnKicklighter) August 1, 2025If this inverse correlation continues through August, Bitcoin could face further downside.
Divergence Between USDT Dominance and Bitcoin
USDT Dominance (USDT.D) reflects the percentage of USDT’s market cap compared to the total crypto market. It usually holds an inverse correlation with Bitcoin and altcoins.
TradingView data shows that USDT.D dropped steadily from over 5% to 4.1% in Q2. After moving sideways in July, it has started to rise again in August, reaching 4.4%.
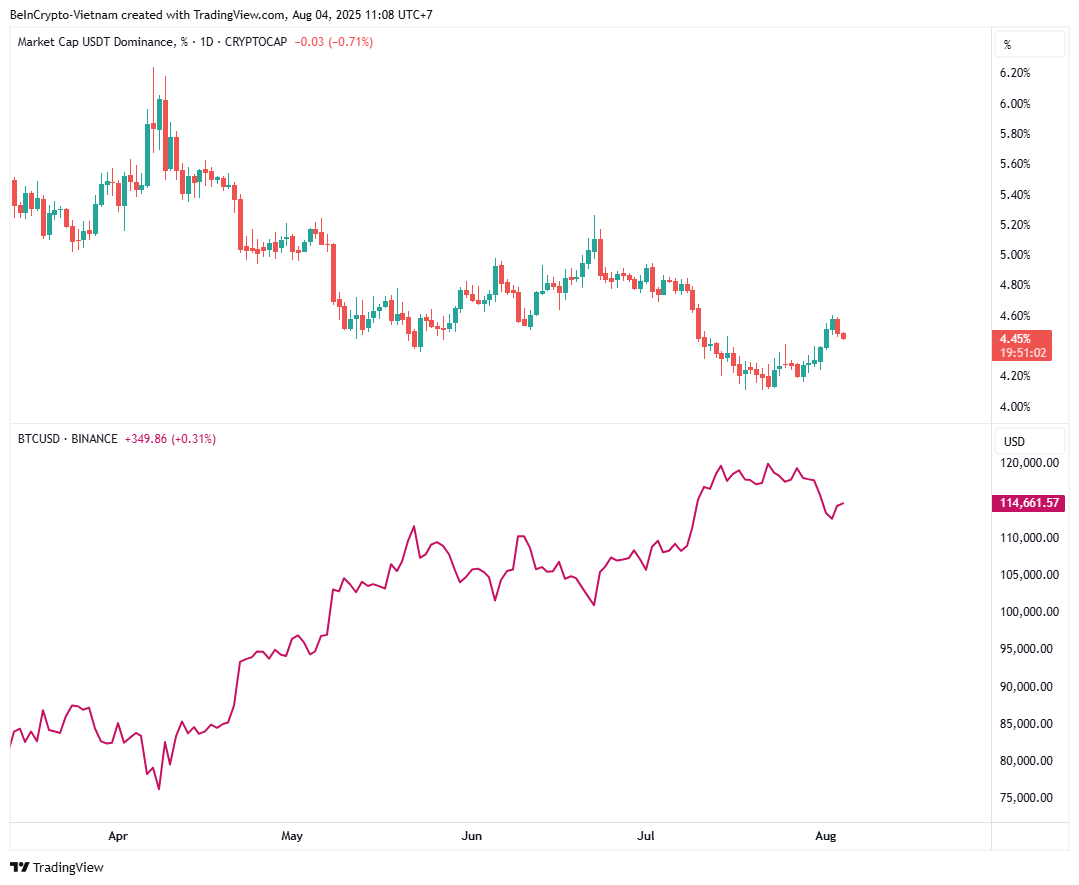
The rise in USDT.D suggests a growing risk-off sentiment. Investors are likely selling crypto assets into stablecoins like USDT to wait for better entry points, which indicates rising caution as the market heats up.
If USDT.D continues to rise throughout August, this divergence could hint at a Bitcoin correction.
Some analysts even predict that USDT.D could rise to 5% in August. However, not everyone sees this as negative. Some believe it could offer a valuable buying opportunity for altcoins.
“USDT dominance could go around 4.7%-4.8% in the coming weeks. This’ll drain liquidity from coins, and could result in a sharp correction. But it’ll be a golden buying opportunity similar to April 2025,” investor Niels predicted.
Historical data shows that Q3 is typically Bitcoin’s weakest-performing quarter. August often ranks as the worst month within Q3.
If confirmed, these divergence signals could make August 2025 a month to watch closely, not just for risks but also for possible long-term opportunities.
