Solana’s Smart Money Is Gobbling Up the Dip – Is a Major Rebound Imminent?

While retail panics, Solana's long-term holders are loading their bags. The 'buy when there's blood in the streets' playbook gets another test.
The Quiet Accumulation Phase
Chain data shows wallets with 12+ month holding periods aggressively adding SOL at prices 60% below 2024's ATH. No press releases, no hype—just cold, calculated accumulation.
Market Psychology at a Crossroads
Recent liquidations cleaned out leverage traders, creating prime conditions for veteran players. The same cohort that bought the 2022 FTX collapse now doubles down—because nothing teaches like losing nine figures once.
Technical Tailwinds Building
On-chain metrics flash oversold signals not seen since January's rally ignition point. Meanwhile, institutional custody holdings hit record highs—because nothing says 'conviction' like parking assets with third-party risk.
The smart money's betting against the crowd...again. Will this time be different, or just another case of 'history doesn't repeat, but it often rhymes'?
Long-Term Holders Are Doubling Down on Solana
While short-term traders have been offloading their holdings, long-term holders (LTHs) are re-entering accumulation mode. This behavioral change is evident in Solana’s Liveliness, which has steadily declined since July 25.
Per Glassnode, this metric, which tracks the movement of previously dormant tokens, plunged to a weekly low of 0.76 yesterday, confirming the decline in sell-offs among SOL’s LTHs.
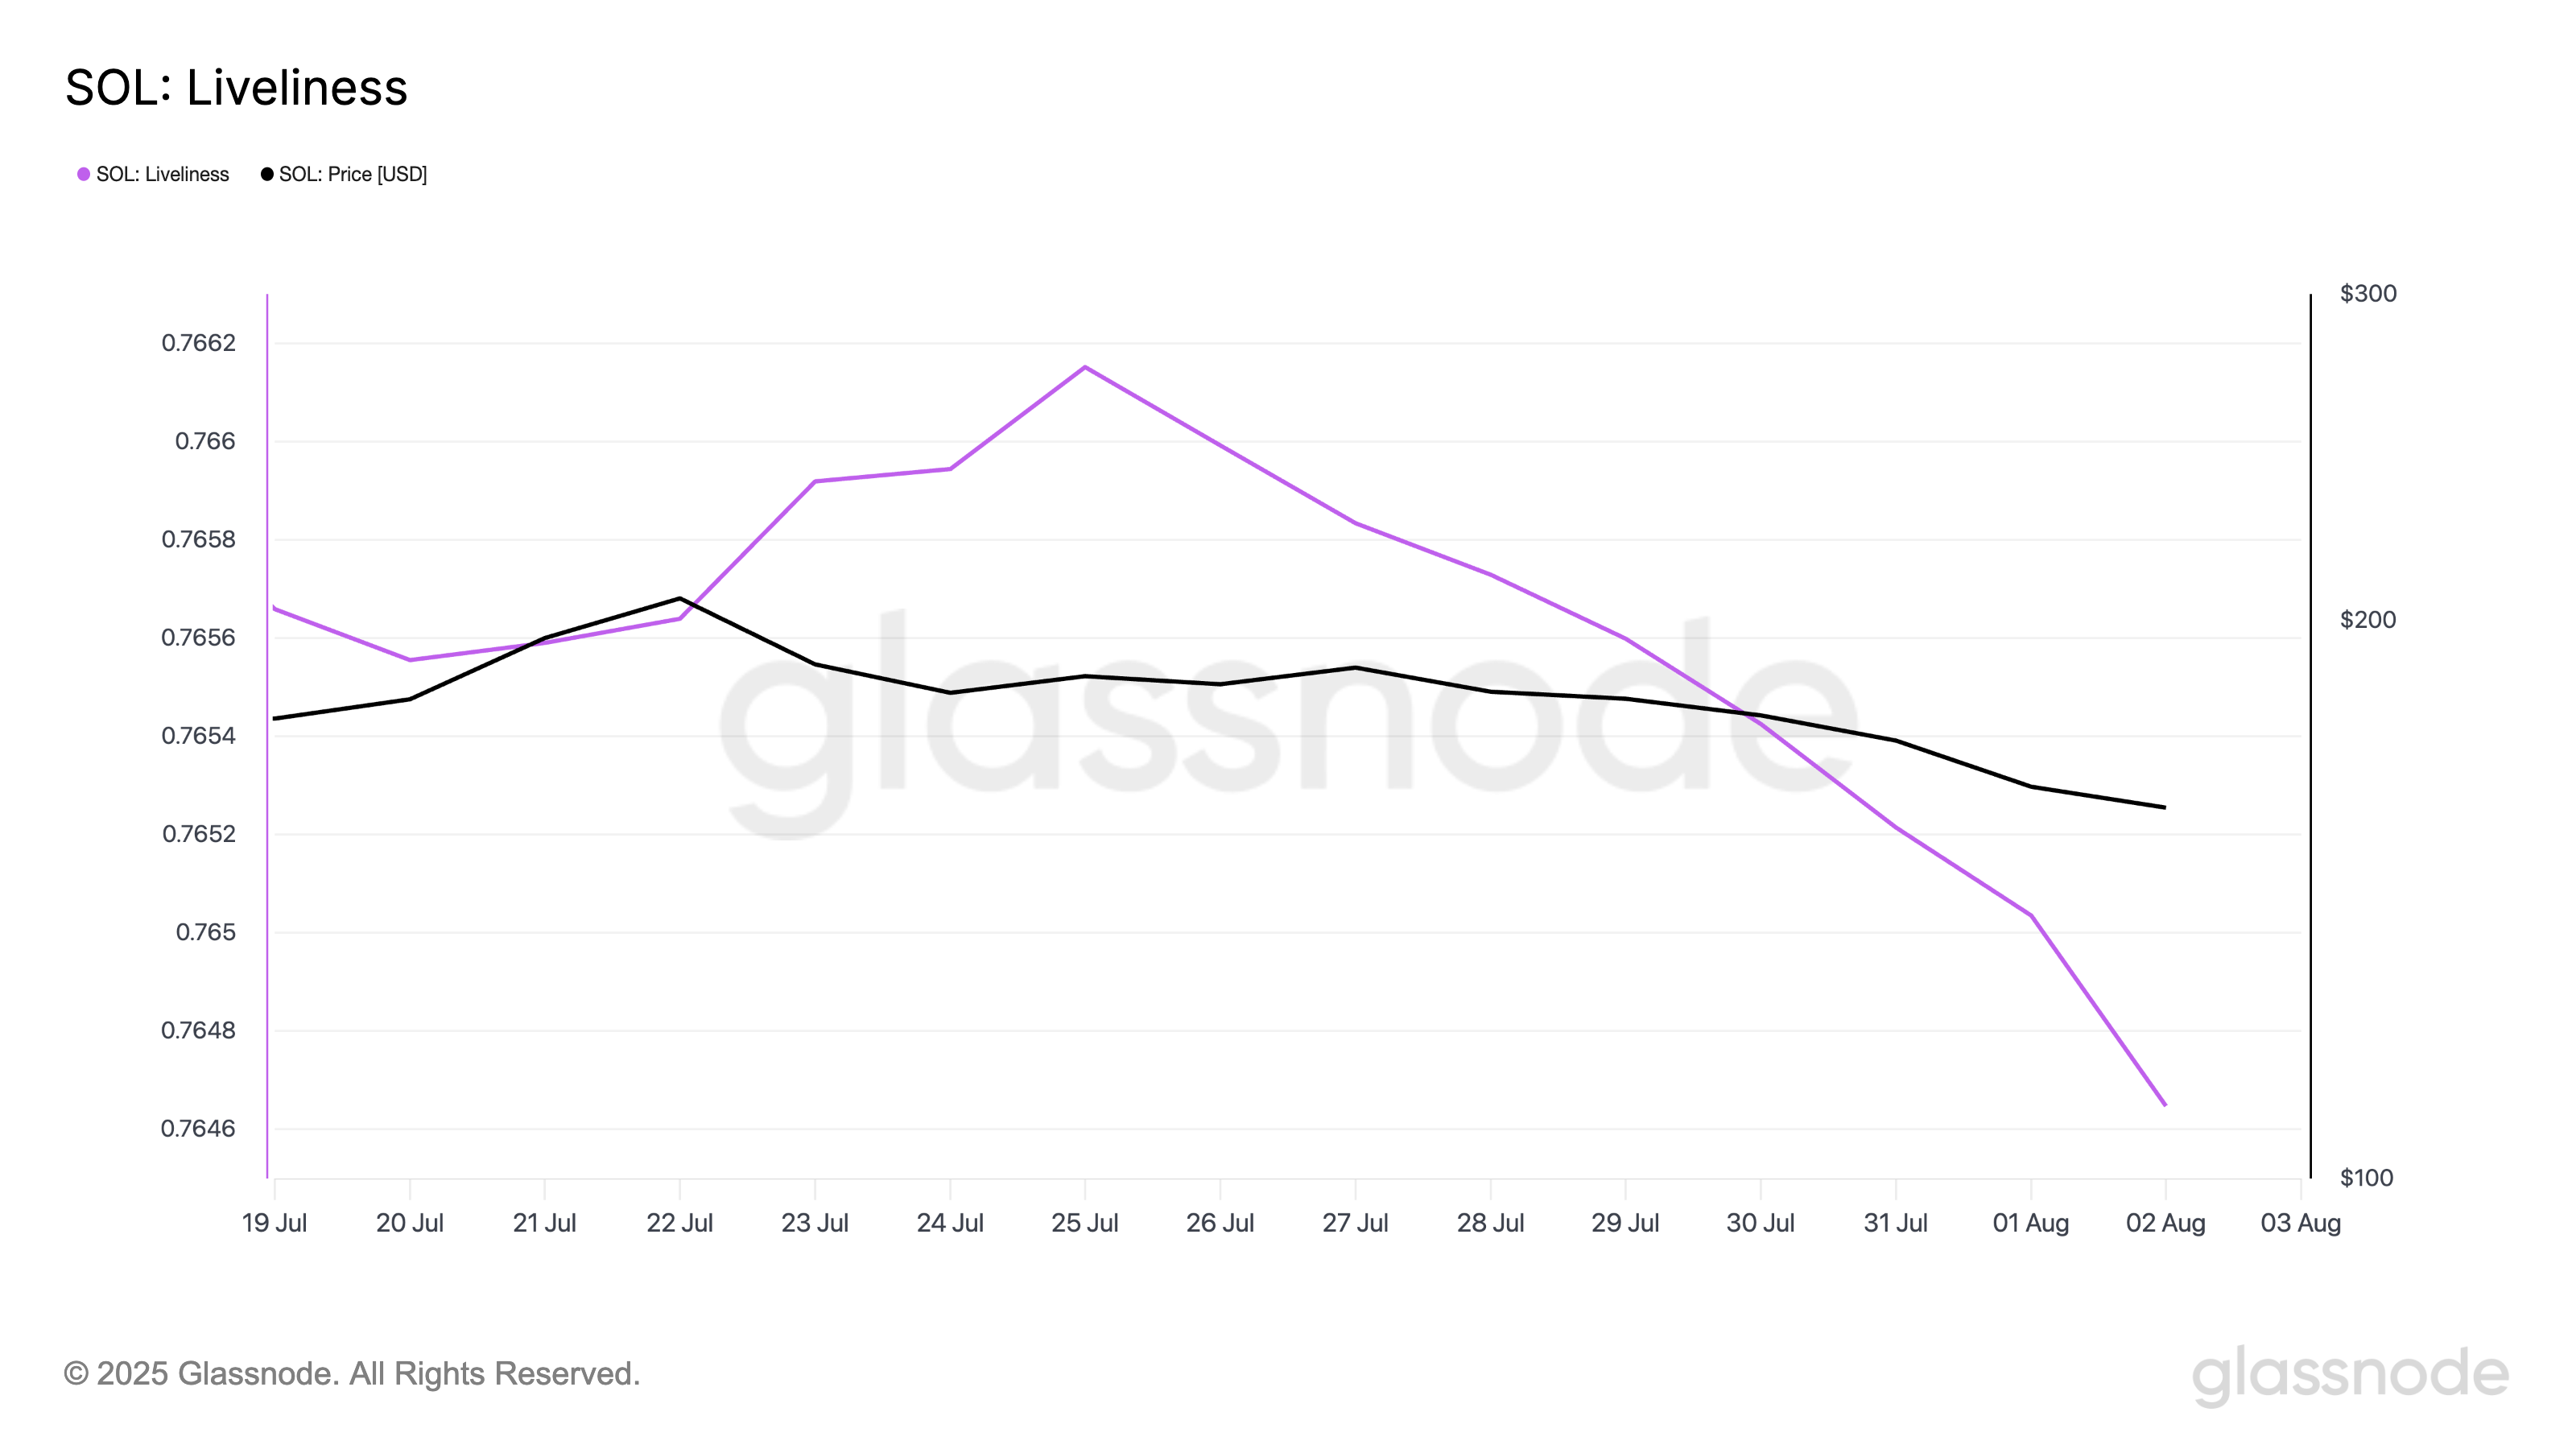
Liveliness tracks the movement of long-held tokens by calculating the ratio of coin days destroyed to the total coin days accumulated. When it rises, it suggests that more dormant tokens are being moved or sold, often signaling profit-taking by LTHs.
Converesly, as with SOL, when this metric falls, it indicates that these investors are moving their assets off exchanges and opting to hold.
Moreover, since July 30, SOL’s Hodler Net Position Change has recorded a steady uptick. This confirms that more coins are being moved into long-term storage, despite the asset’s lackluster price action.
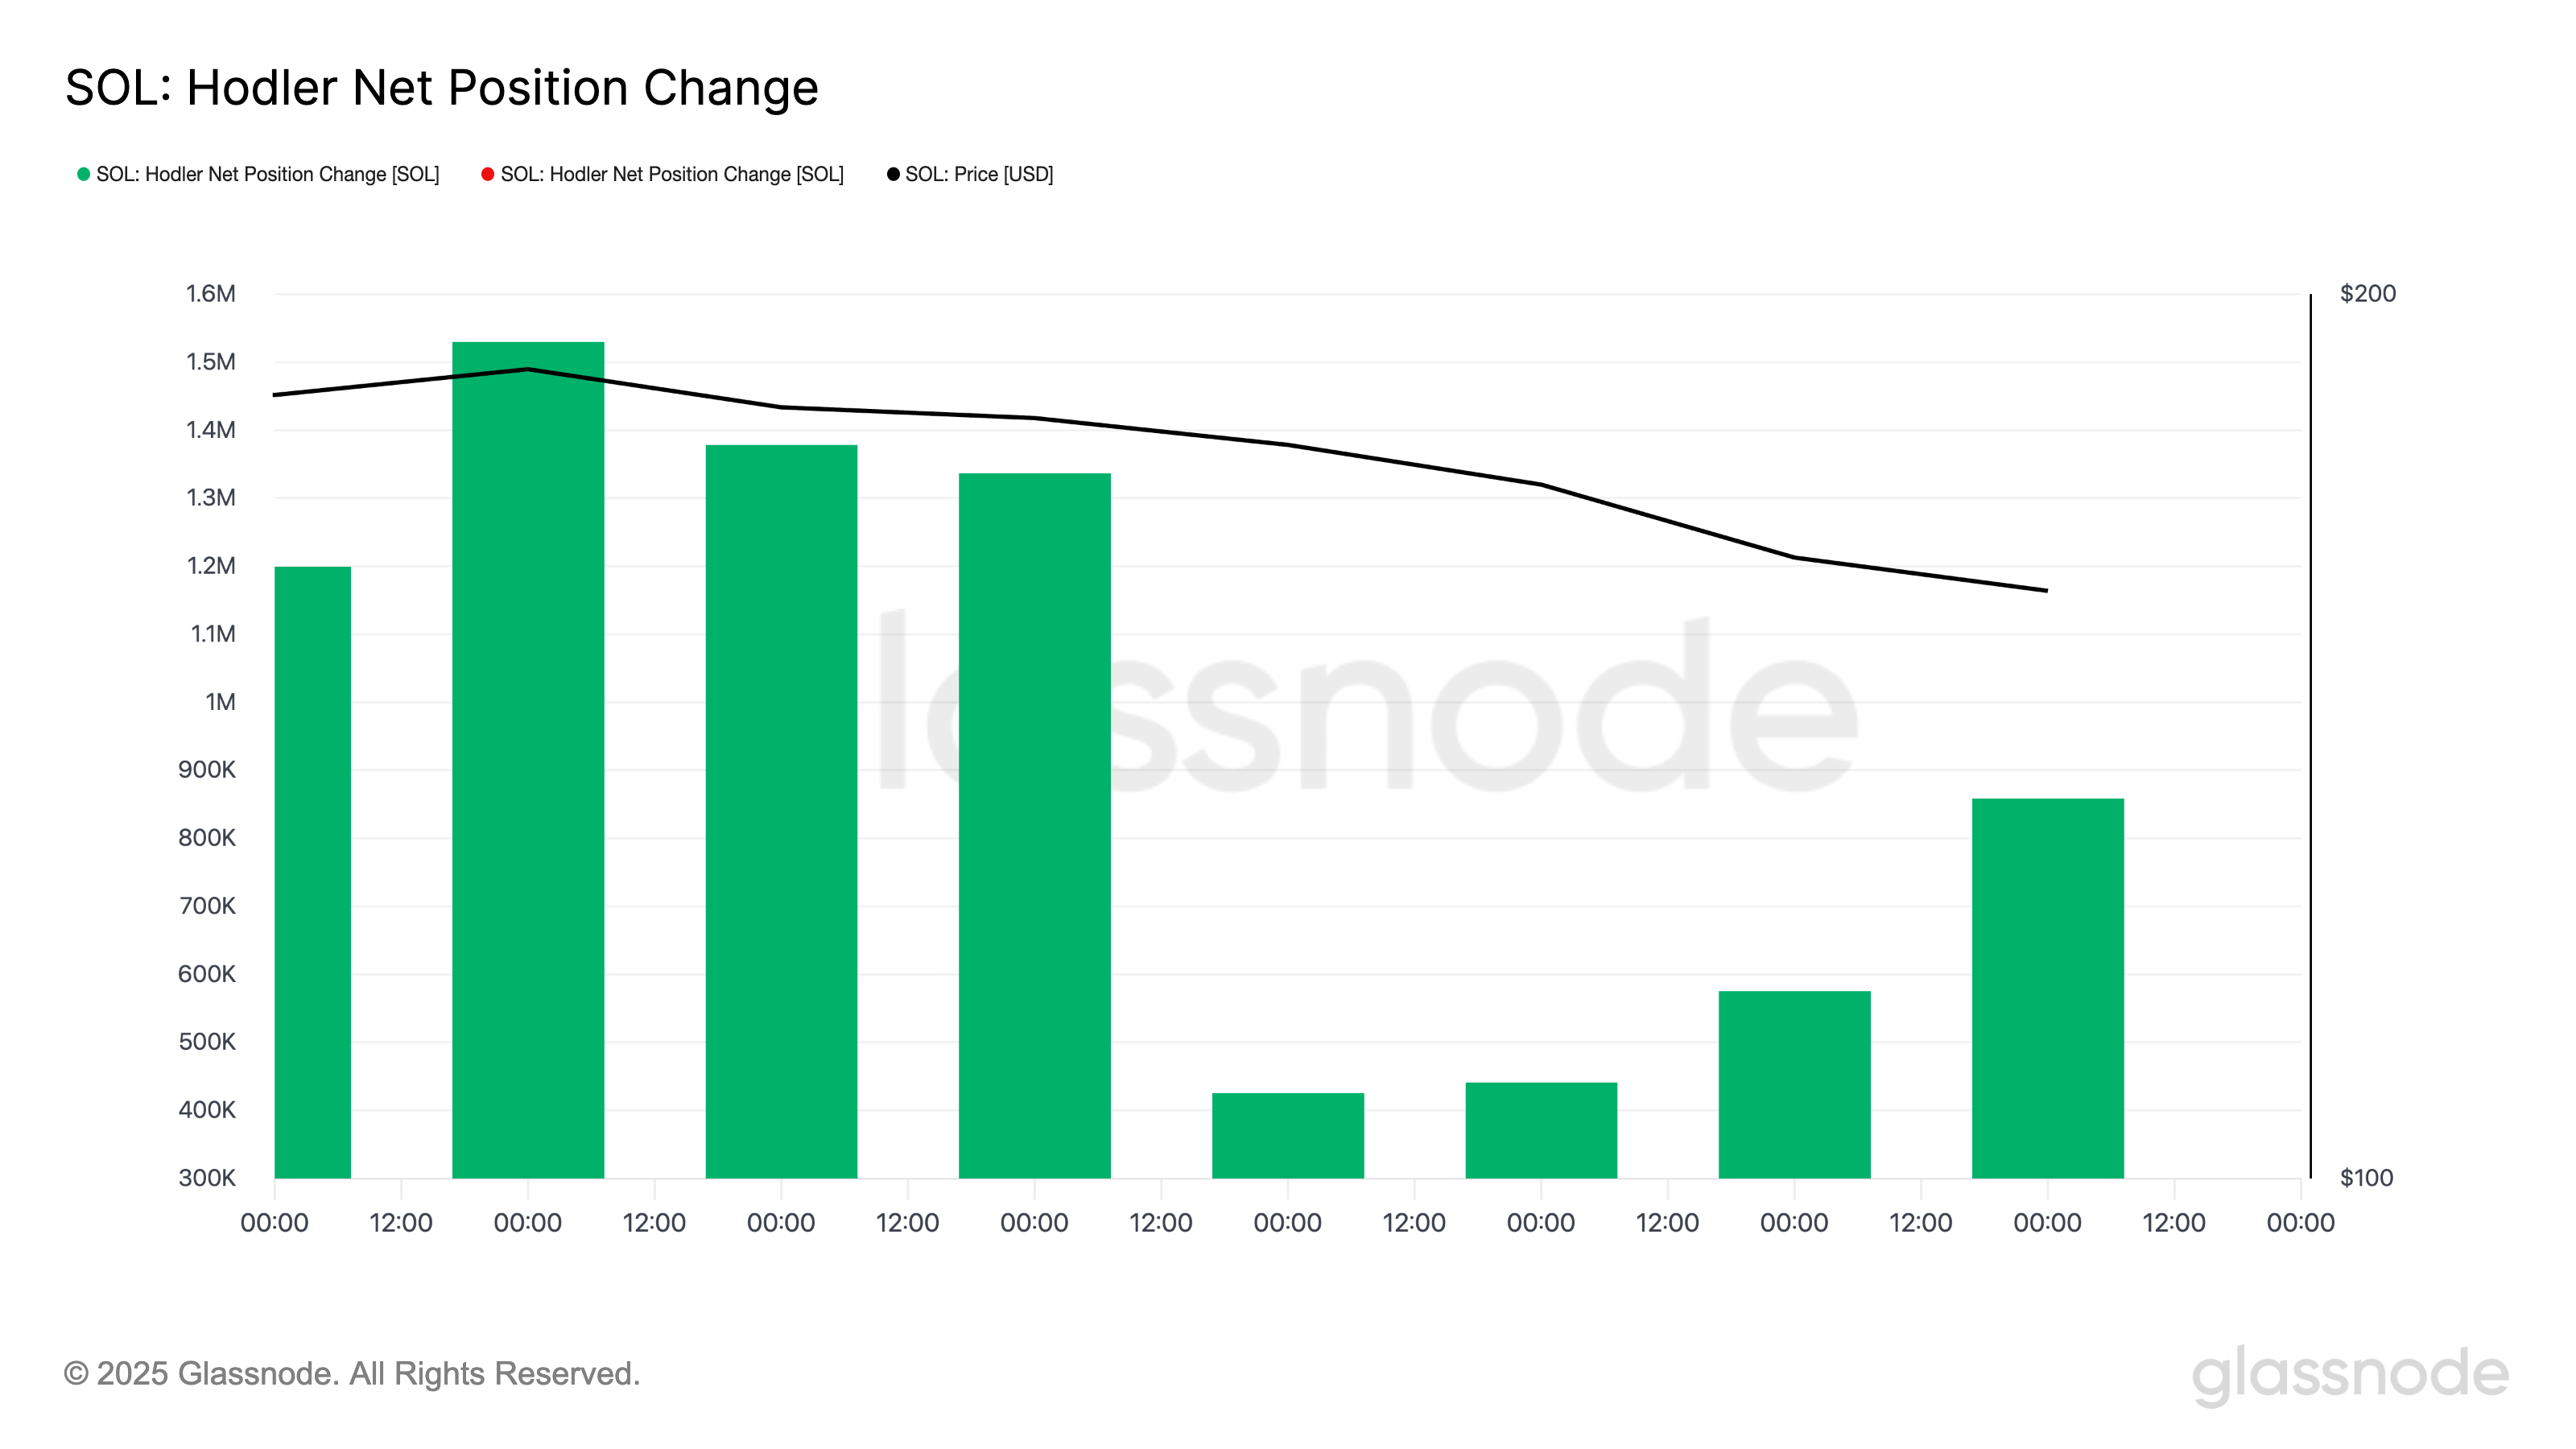
Glassnode data shows that this metric, which measures the 30-day change in the supply held by LTHs, has climbed by 102% over the past four days. When this metric rises like this, it indicates that LTHs are accumulating more coins rather than selling them.
Solana Traders Are Selling at a Loss — Is a Bottom Finally Forming?
The sustained decline in SOL’s Realized Profit/Loss Ratio supports the bullish outlook above. On-chain data shows that this metric closed at a 30-day low of 0.15 on August 2, indicating that many traders exiting positions continue to do so at a loss.

Historically, the market tends to stabilize when most participants sell below their cost basis.
With fewer holders willing to offload their tokens at a loss, selling pressure could reduce, paving the way for SOL to find a local bottom ahead of any bullish catalyst that could trigger a rebound.
Solana Hangs in the Balance—Support at $158 Faces Serious Test
SOL trades at $160.55 at press time, holding above a key support floor at $158.80. If buy-side pressure grows, SOL could initiate a bullish reversal and trend toward $176.33.
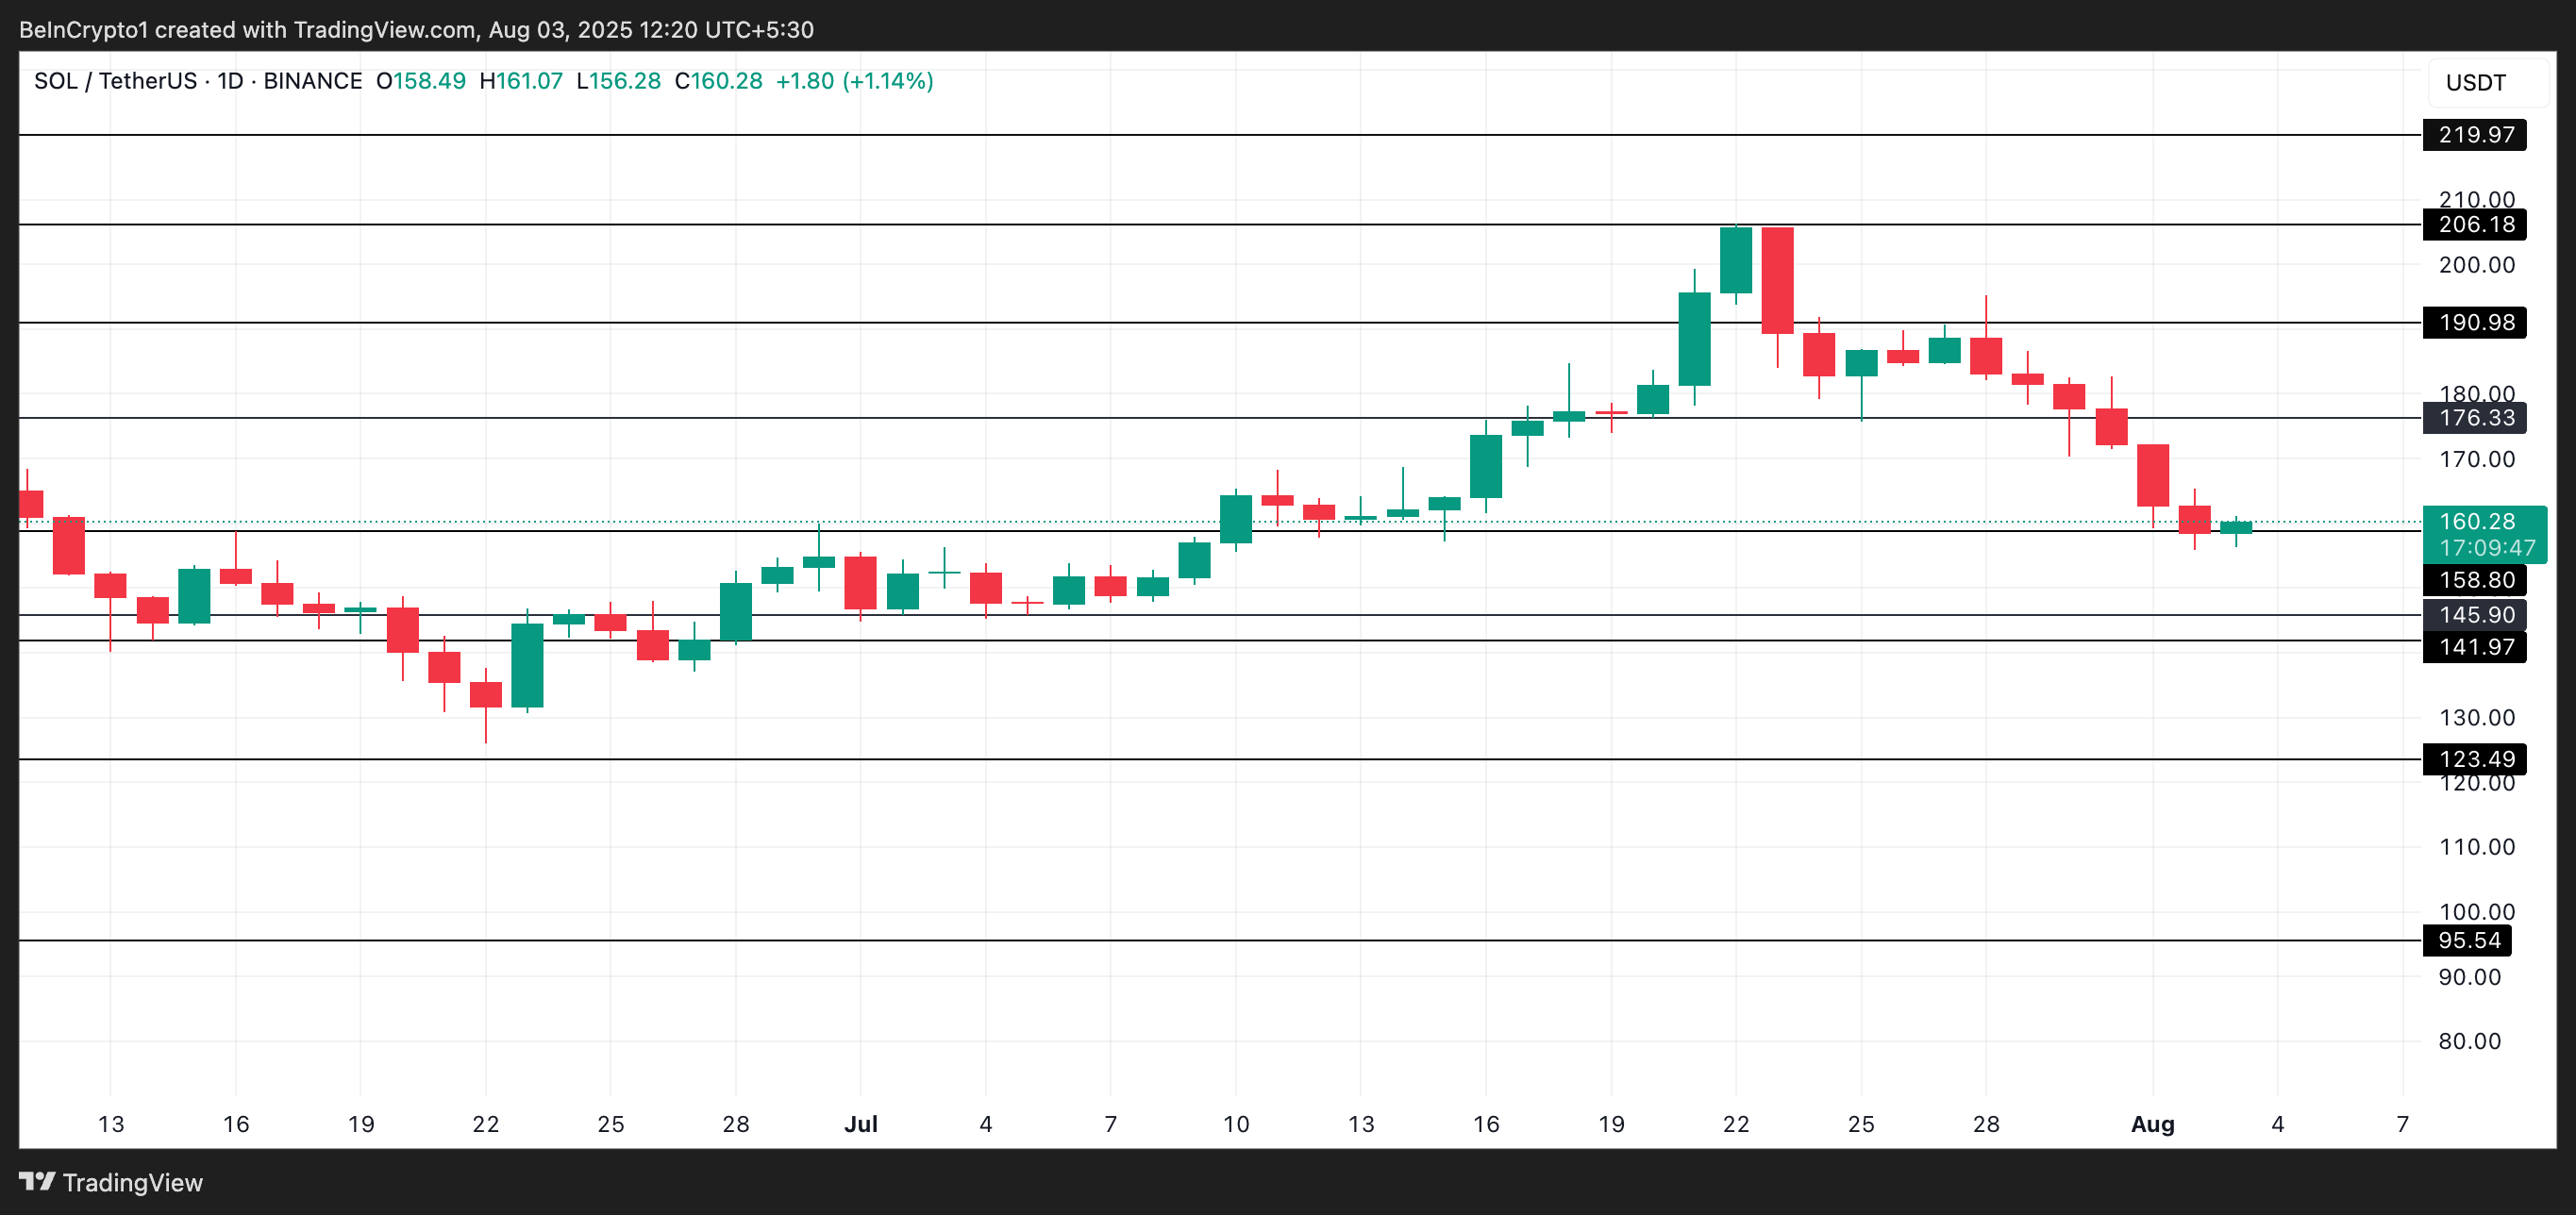
However, if selloffs persist and the support floor weakens, SOL’s price could fall to $145.90.
