Pi Coin Teeters on the Brink: New Lows Loom—But the Worst May Still Be Coming

Pi Coin's freefall isn't over yet—traders brace for a deeper plunge.
### The floor keeps dropping
Another day, another record low for the once-hyped altcoin. But here's the kicker: technicals suggest this 'dip' might just be the appetizer before a full-blown crash buffet.
### When 'HODL' becomes a horror story
Retail bagholders are discovering the hard truth about 'free' crypto mined on phones—liquidity vanishes faster than a Bitcoin maximalist's patience for shitcoins.
Wake-up call: If your 'next Bitcoin' keeps hitting new lows while actual Bitcoin retests ATHs, maybe—just maybe—you're holding digital confetti. (But hey, at least those mining apps were great at draining batteries.)
ATR Shows Falling Volatility, But Not the Kind Bulls Want
The first warning sign comes from the Average True Range (ATR), a tool that measures how big price moves are. When Pi Coin hit highs NEAR $1.66 in May, ATR was at 0.17, signaling strong momentum and active trading.
: Want more token insights like this? Sign up for Editor Harsh Notariya’s Daily crypto Newsletter here.
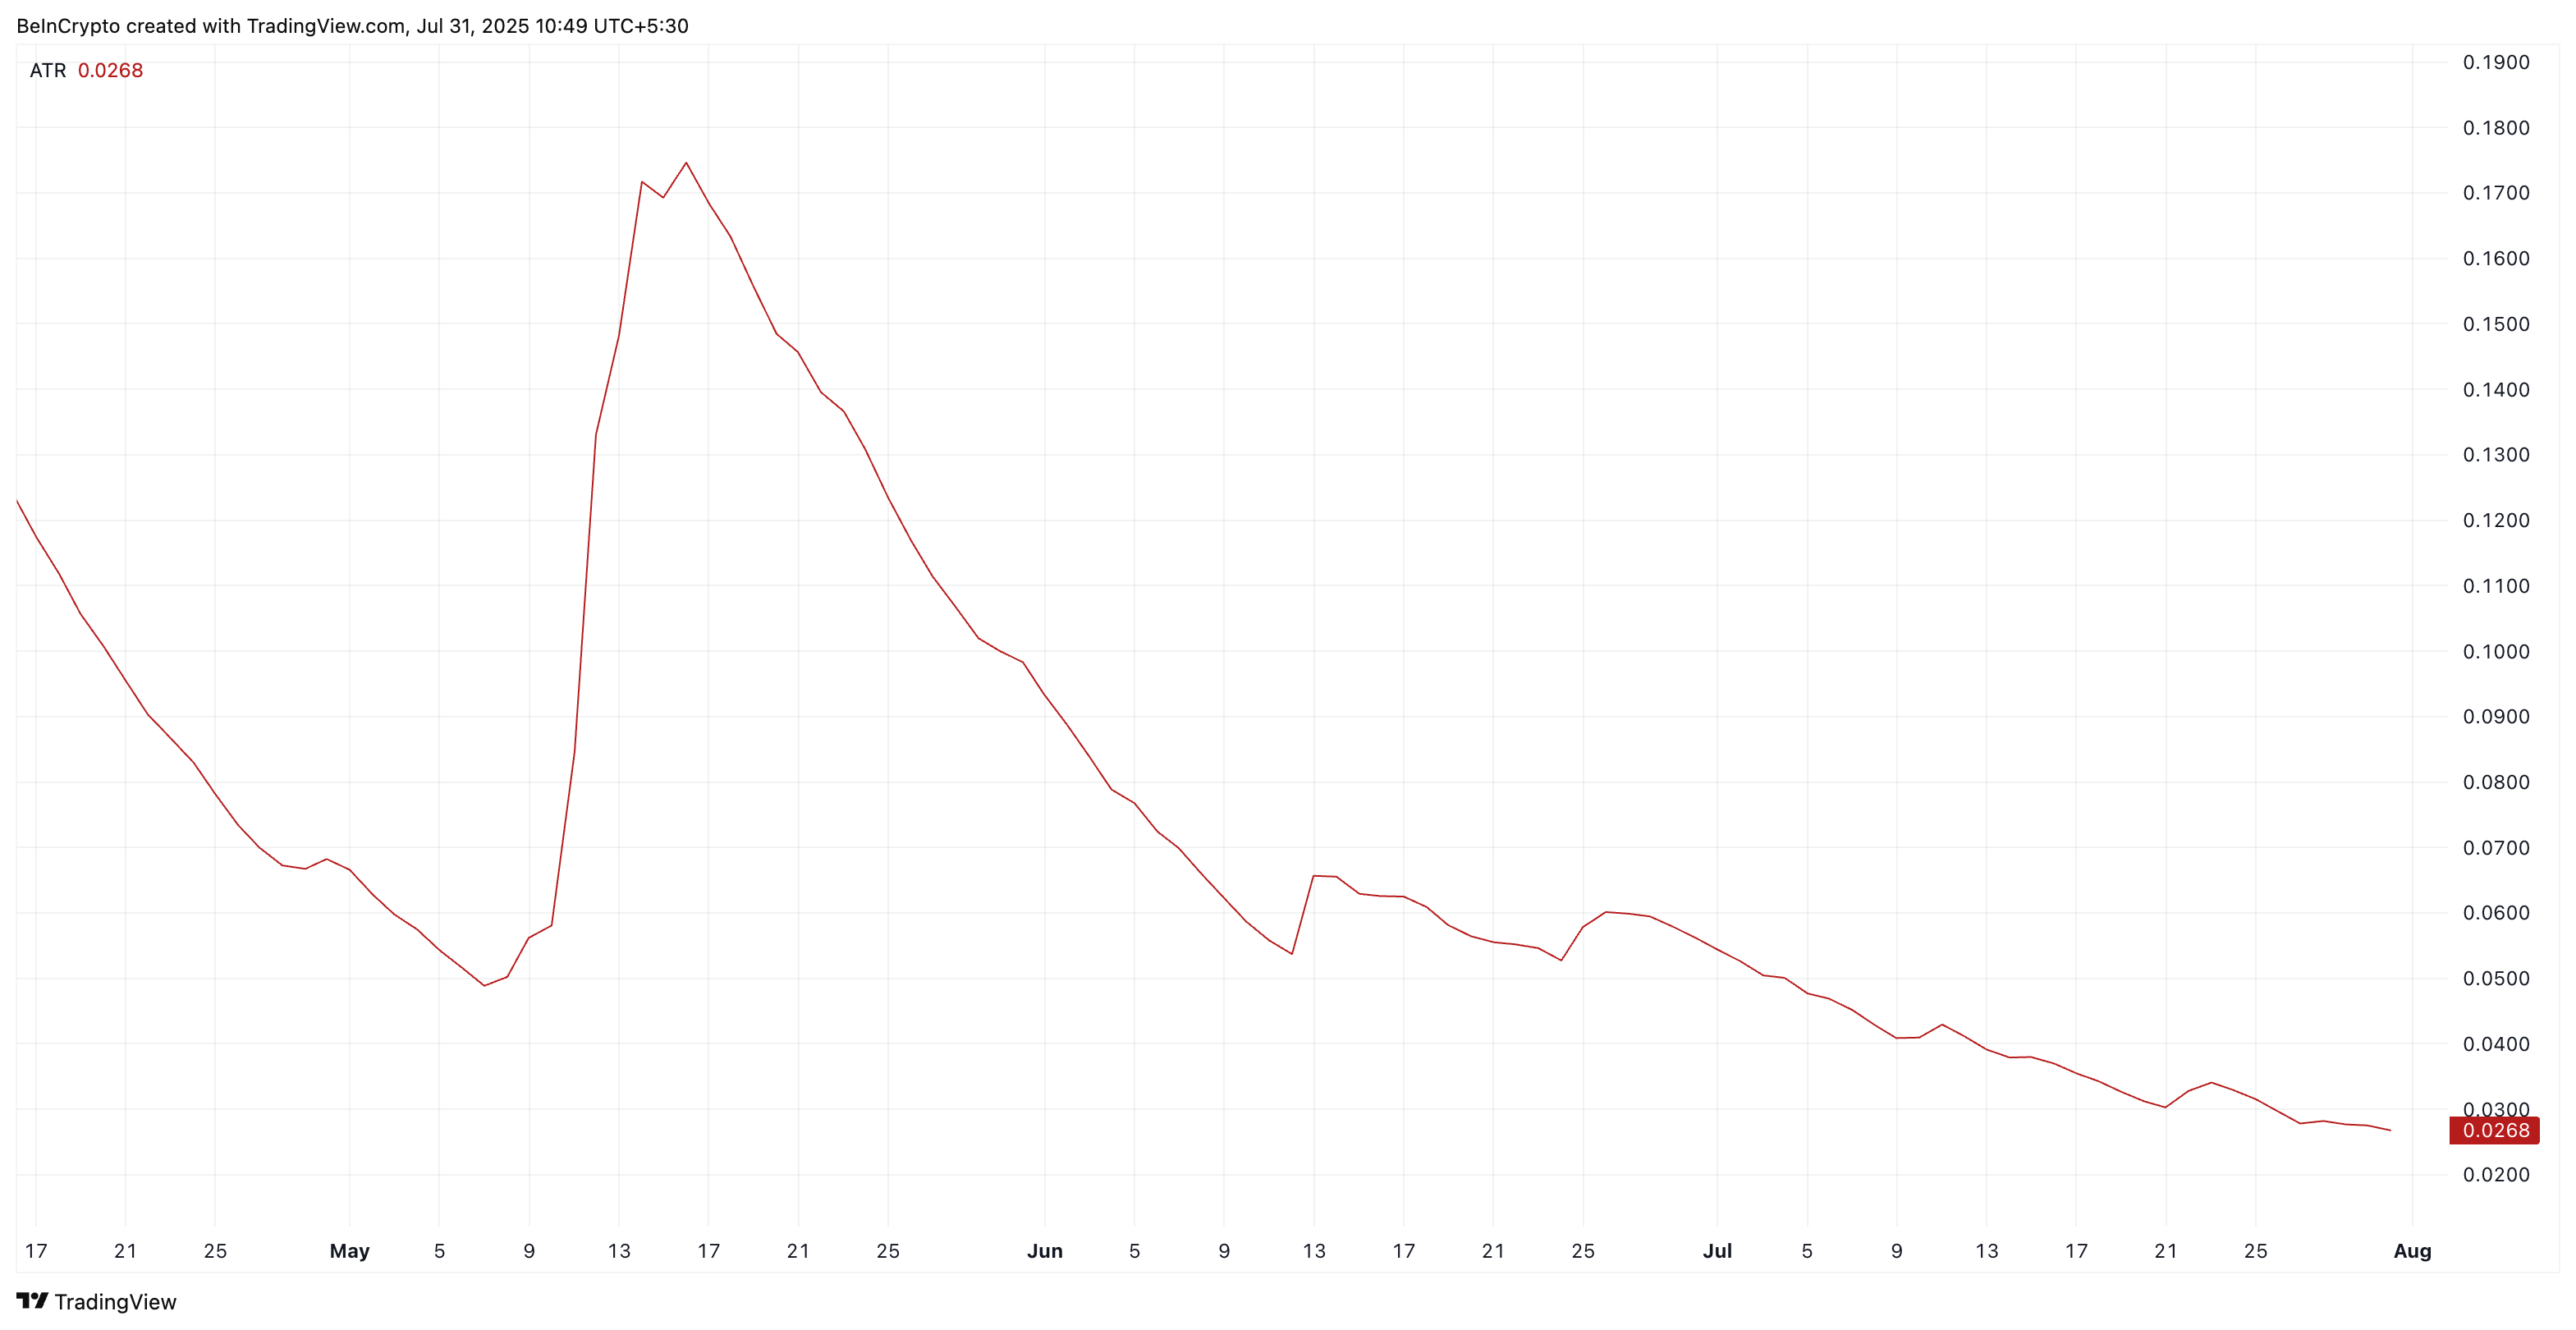
Today, ATR has collapsed to just 0.0268. This sharp decline means price moves have become small and weak. Instead of a fight between buyers and sellers, the market feels like a slow bleed, with sellers still in control.
Low ATR during a downtrend usually means there’s no energy for a bounce; just quiet selling pressure grinding the price lower.
Money Flow Index Shows Buyers Losing Interest
The Money FLOW Index (MFI) tells a similar story. This indicator combines price and volume to show whether money is flowing in or out of a token.
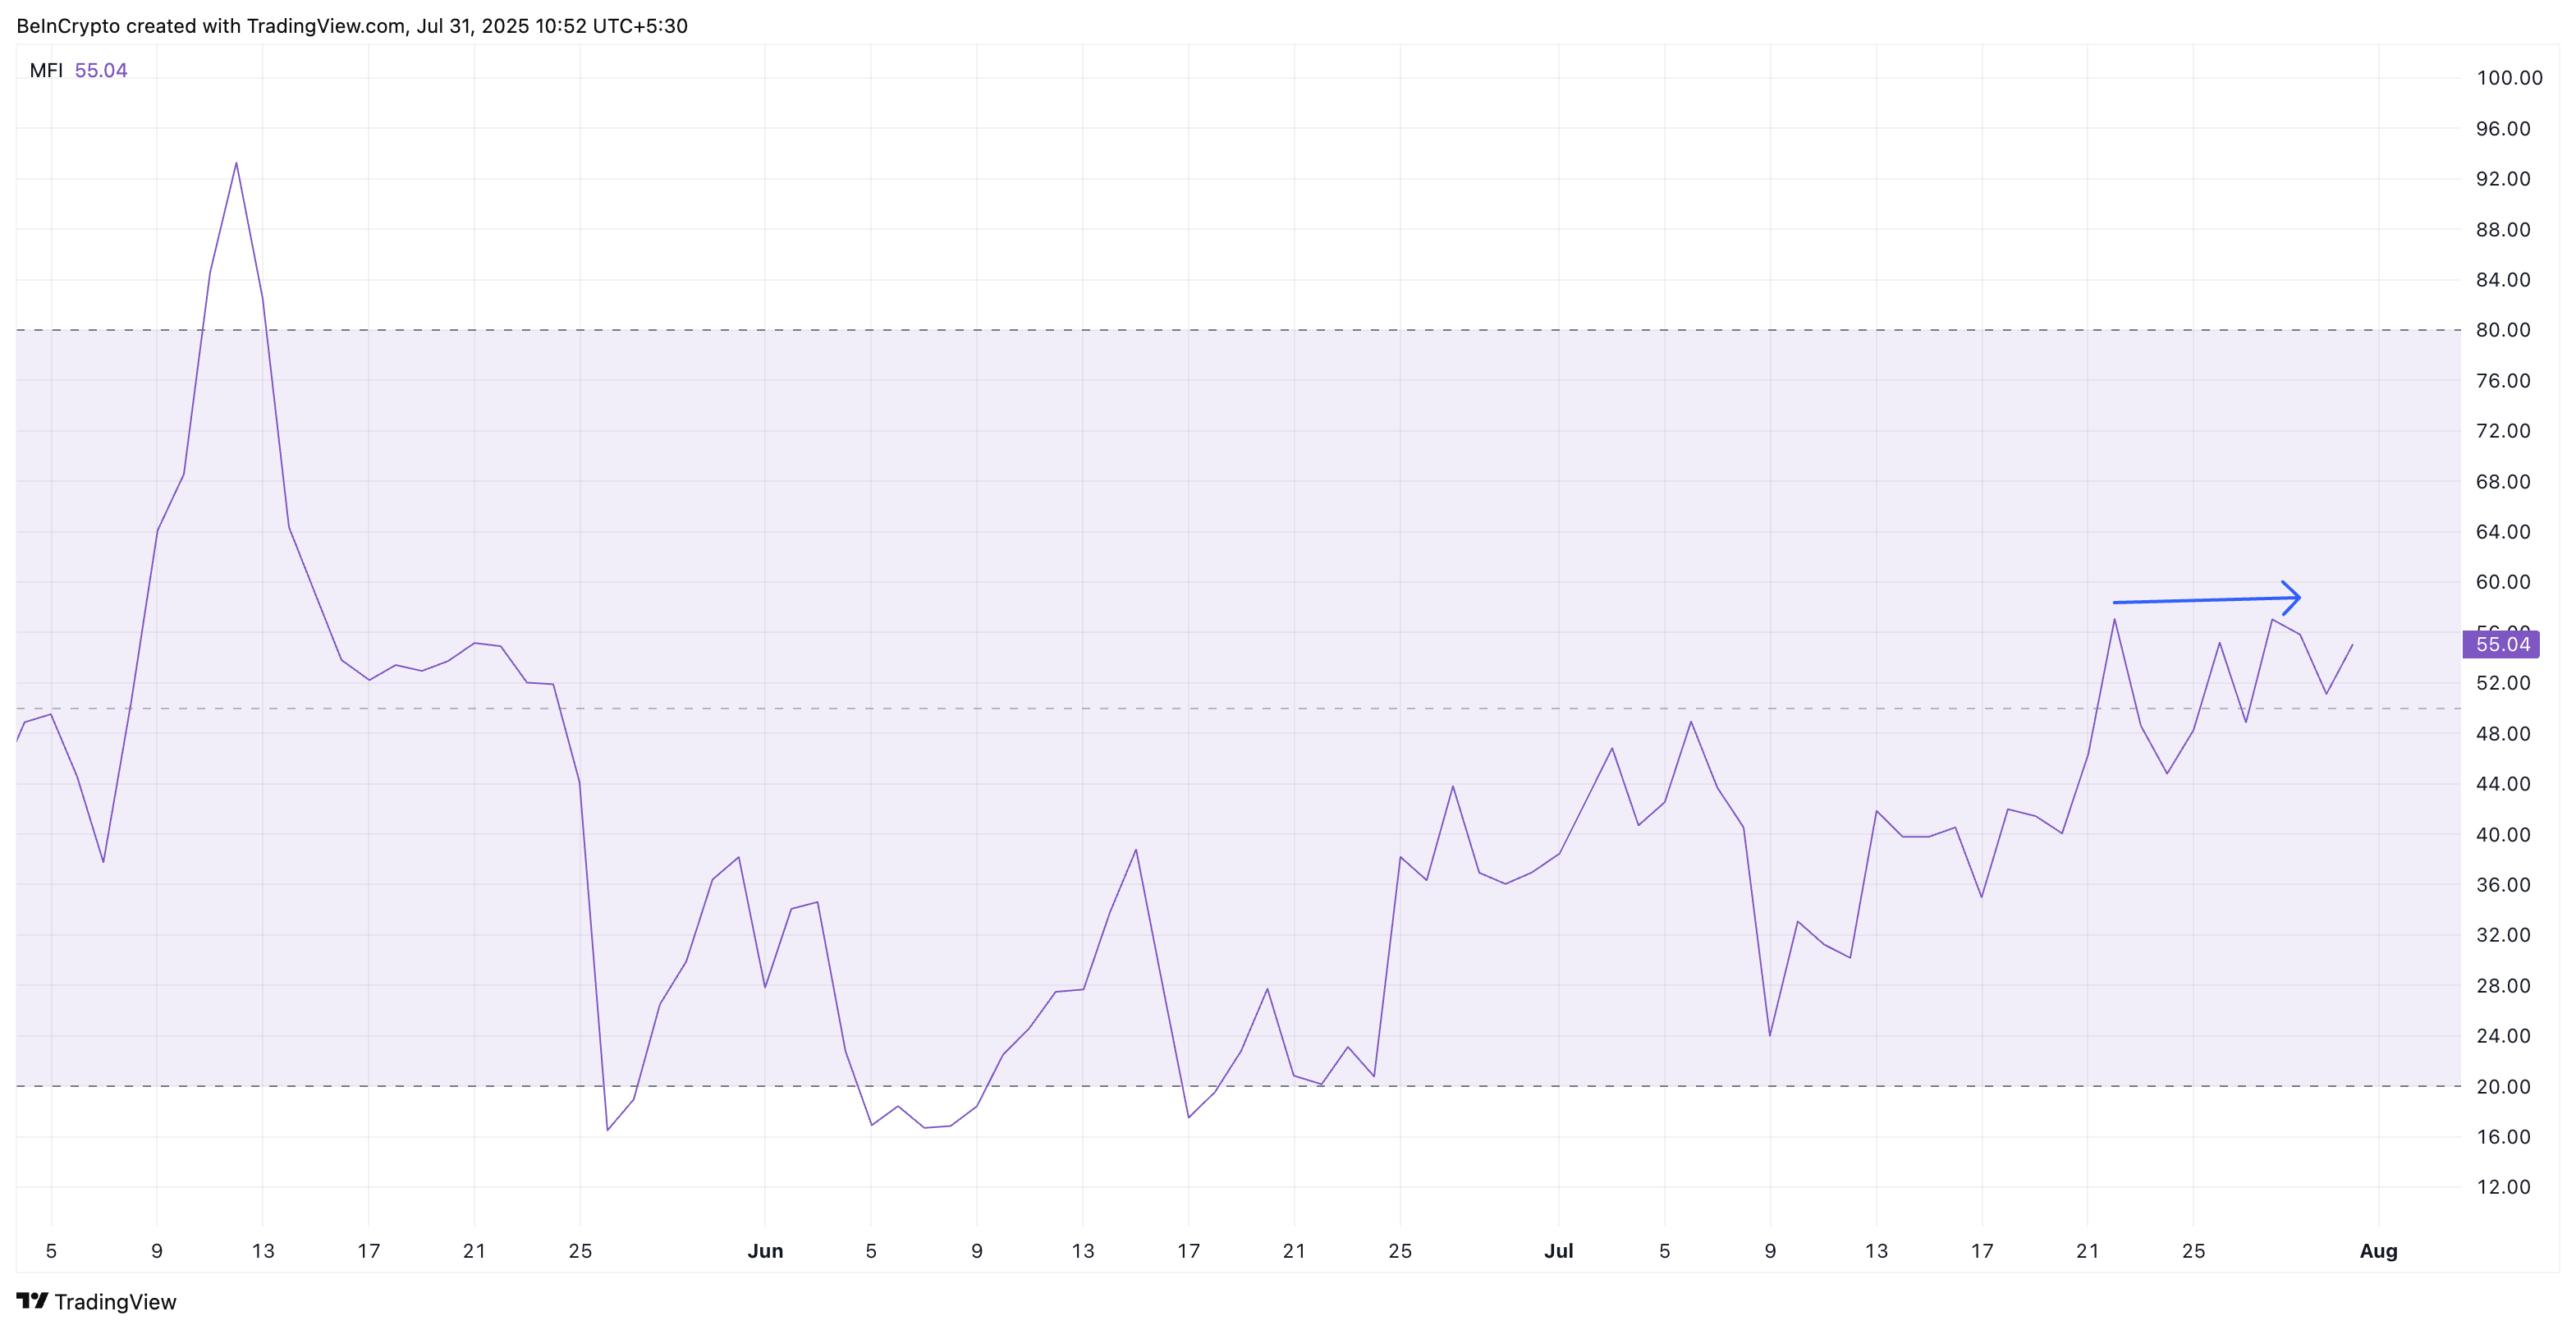
Over the past 10 days, MFI has been stuck near 55. That’s not high enough to show real demand and not low enough to suggest panic selling either.
Earlier in July, when Pi Coin hovered around $0.47, there were signs of new money stepping in to defend the Support. That was the reason why PI always managed to bounce back after flirting with a swing low.
But that money flow has stalled now. Fewer buyers are taking interest, even at lower prices, making it harder for PI Coin to bounce back in the short term.
Bearish Pattern Points to a Deeper Pi Coin Price Bottom
On the chart, Pi Coin is trapped in a descending triangle, a bearish pattern where lower highs continue to press against a fragile support level. For now, the immediate support lies at $0.42 and $0.40, breaking which looks all the more likely with not much capital being deployed.
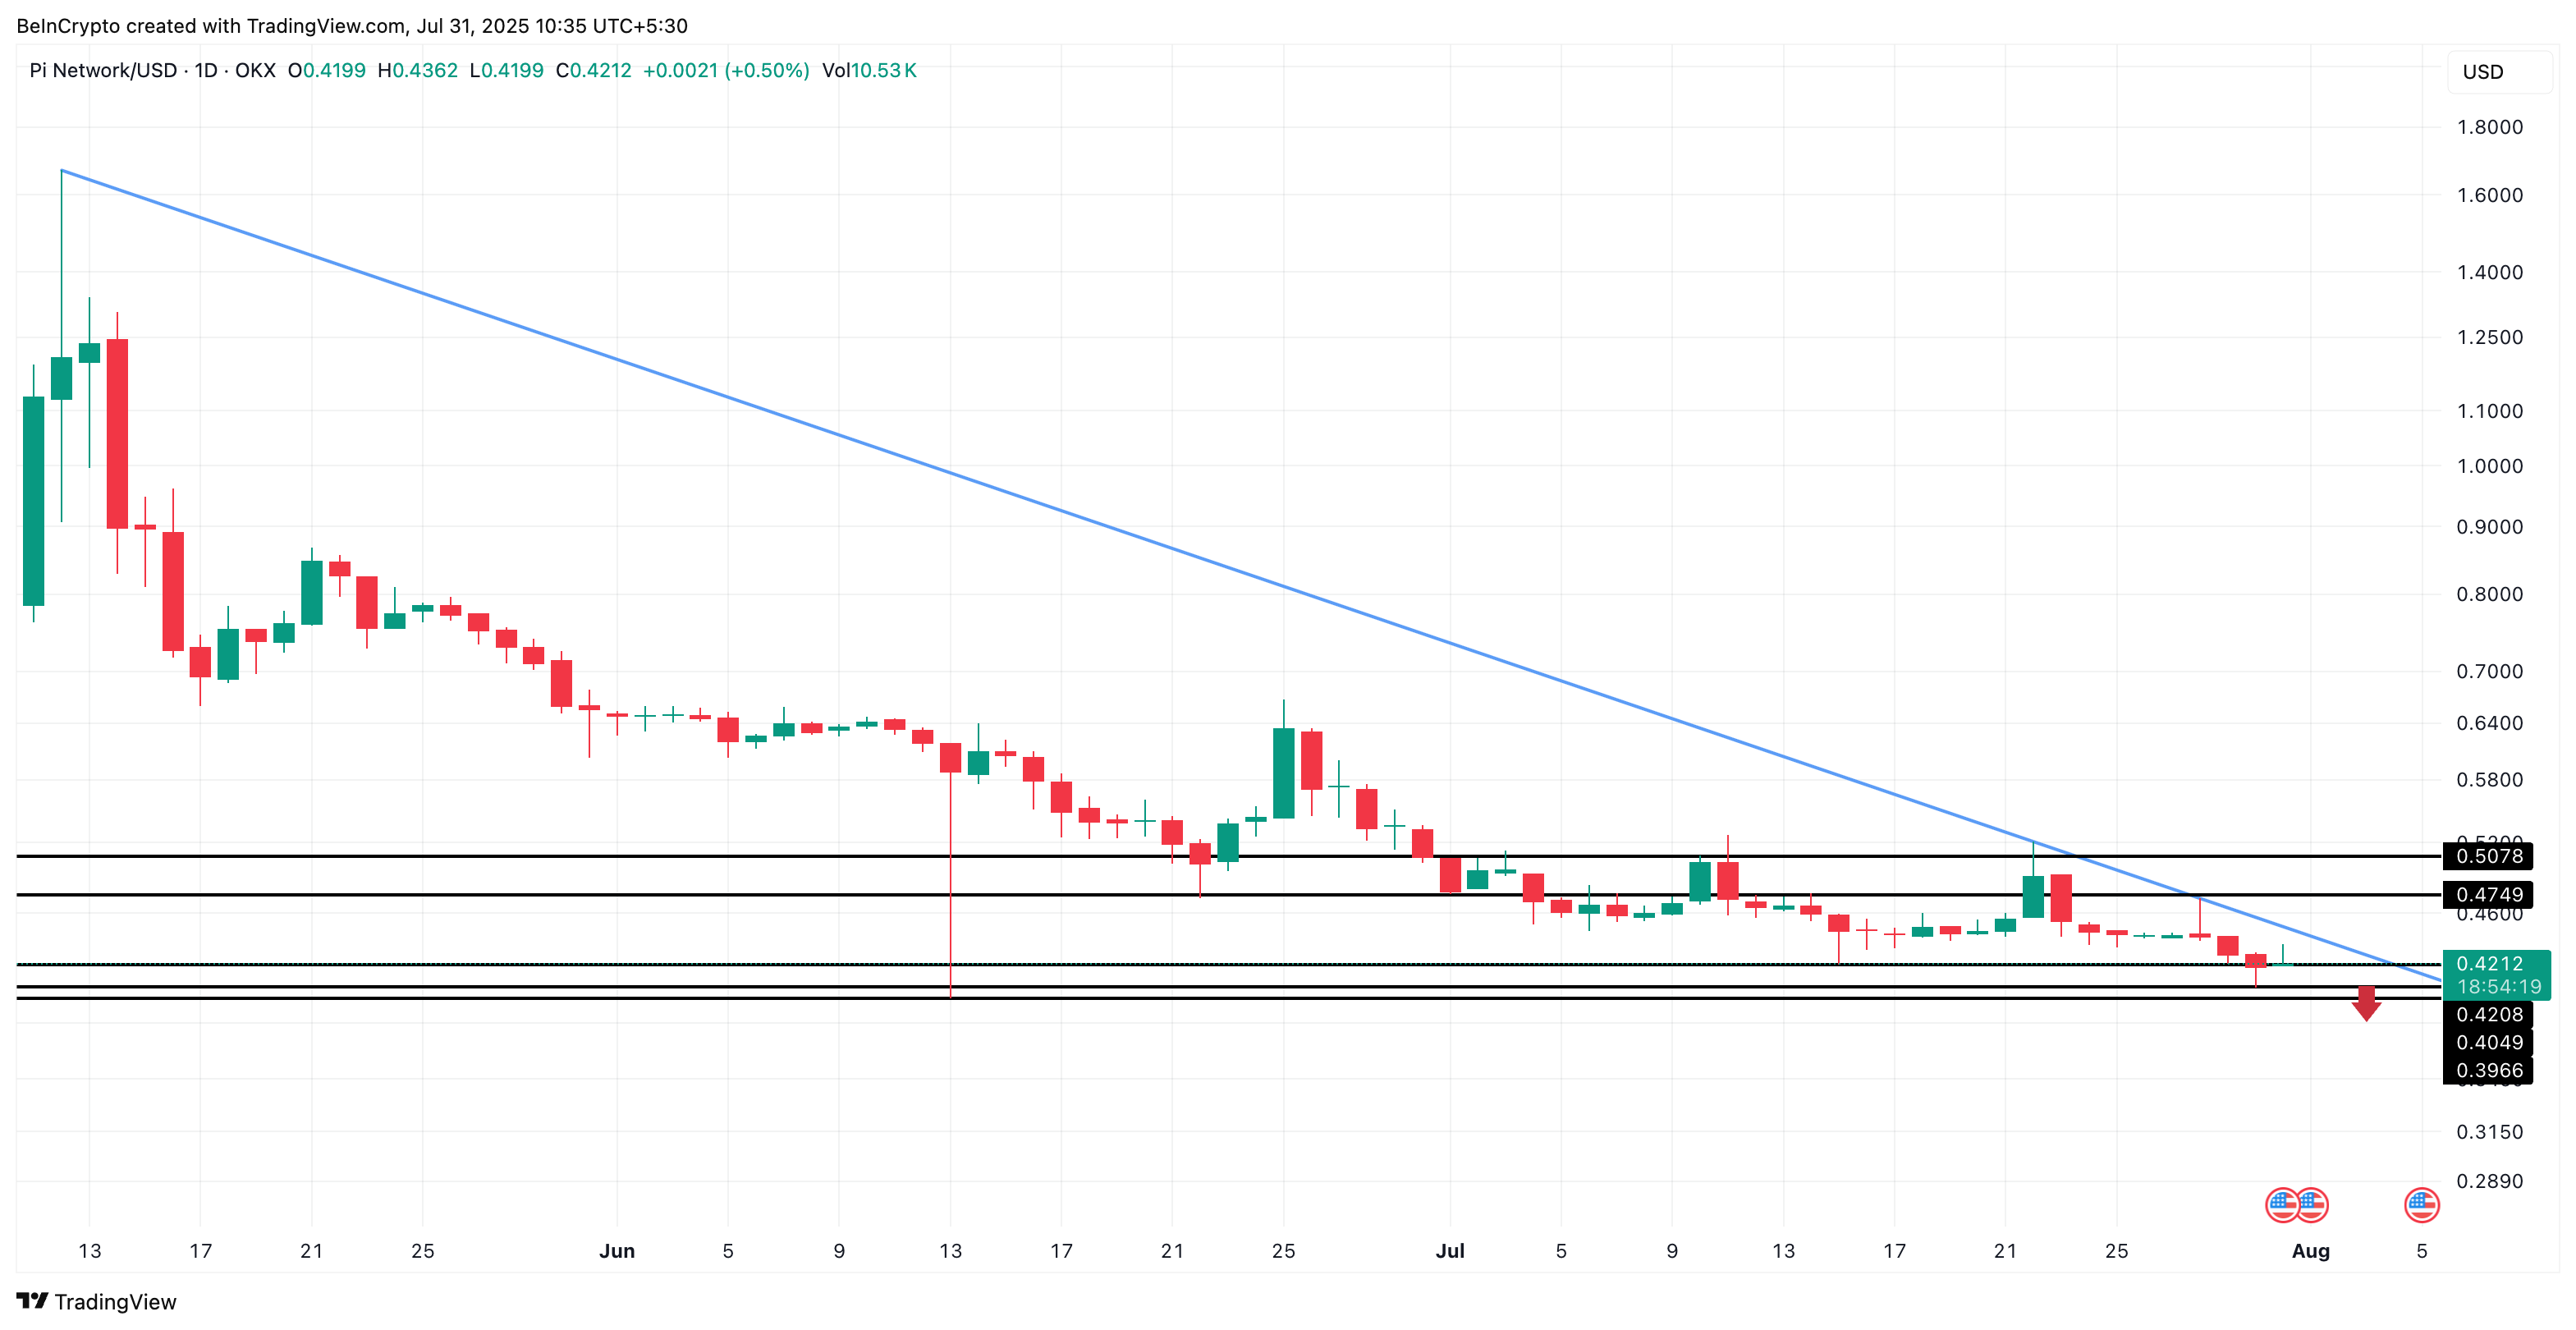
If the $0.40 floor gives way, key support and Fibonnaci retracement levels point to $0.39 and even $0.35 as the next potential bottoms, both below the current all-time low.
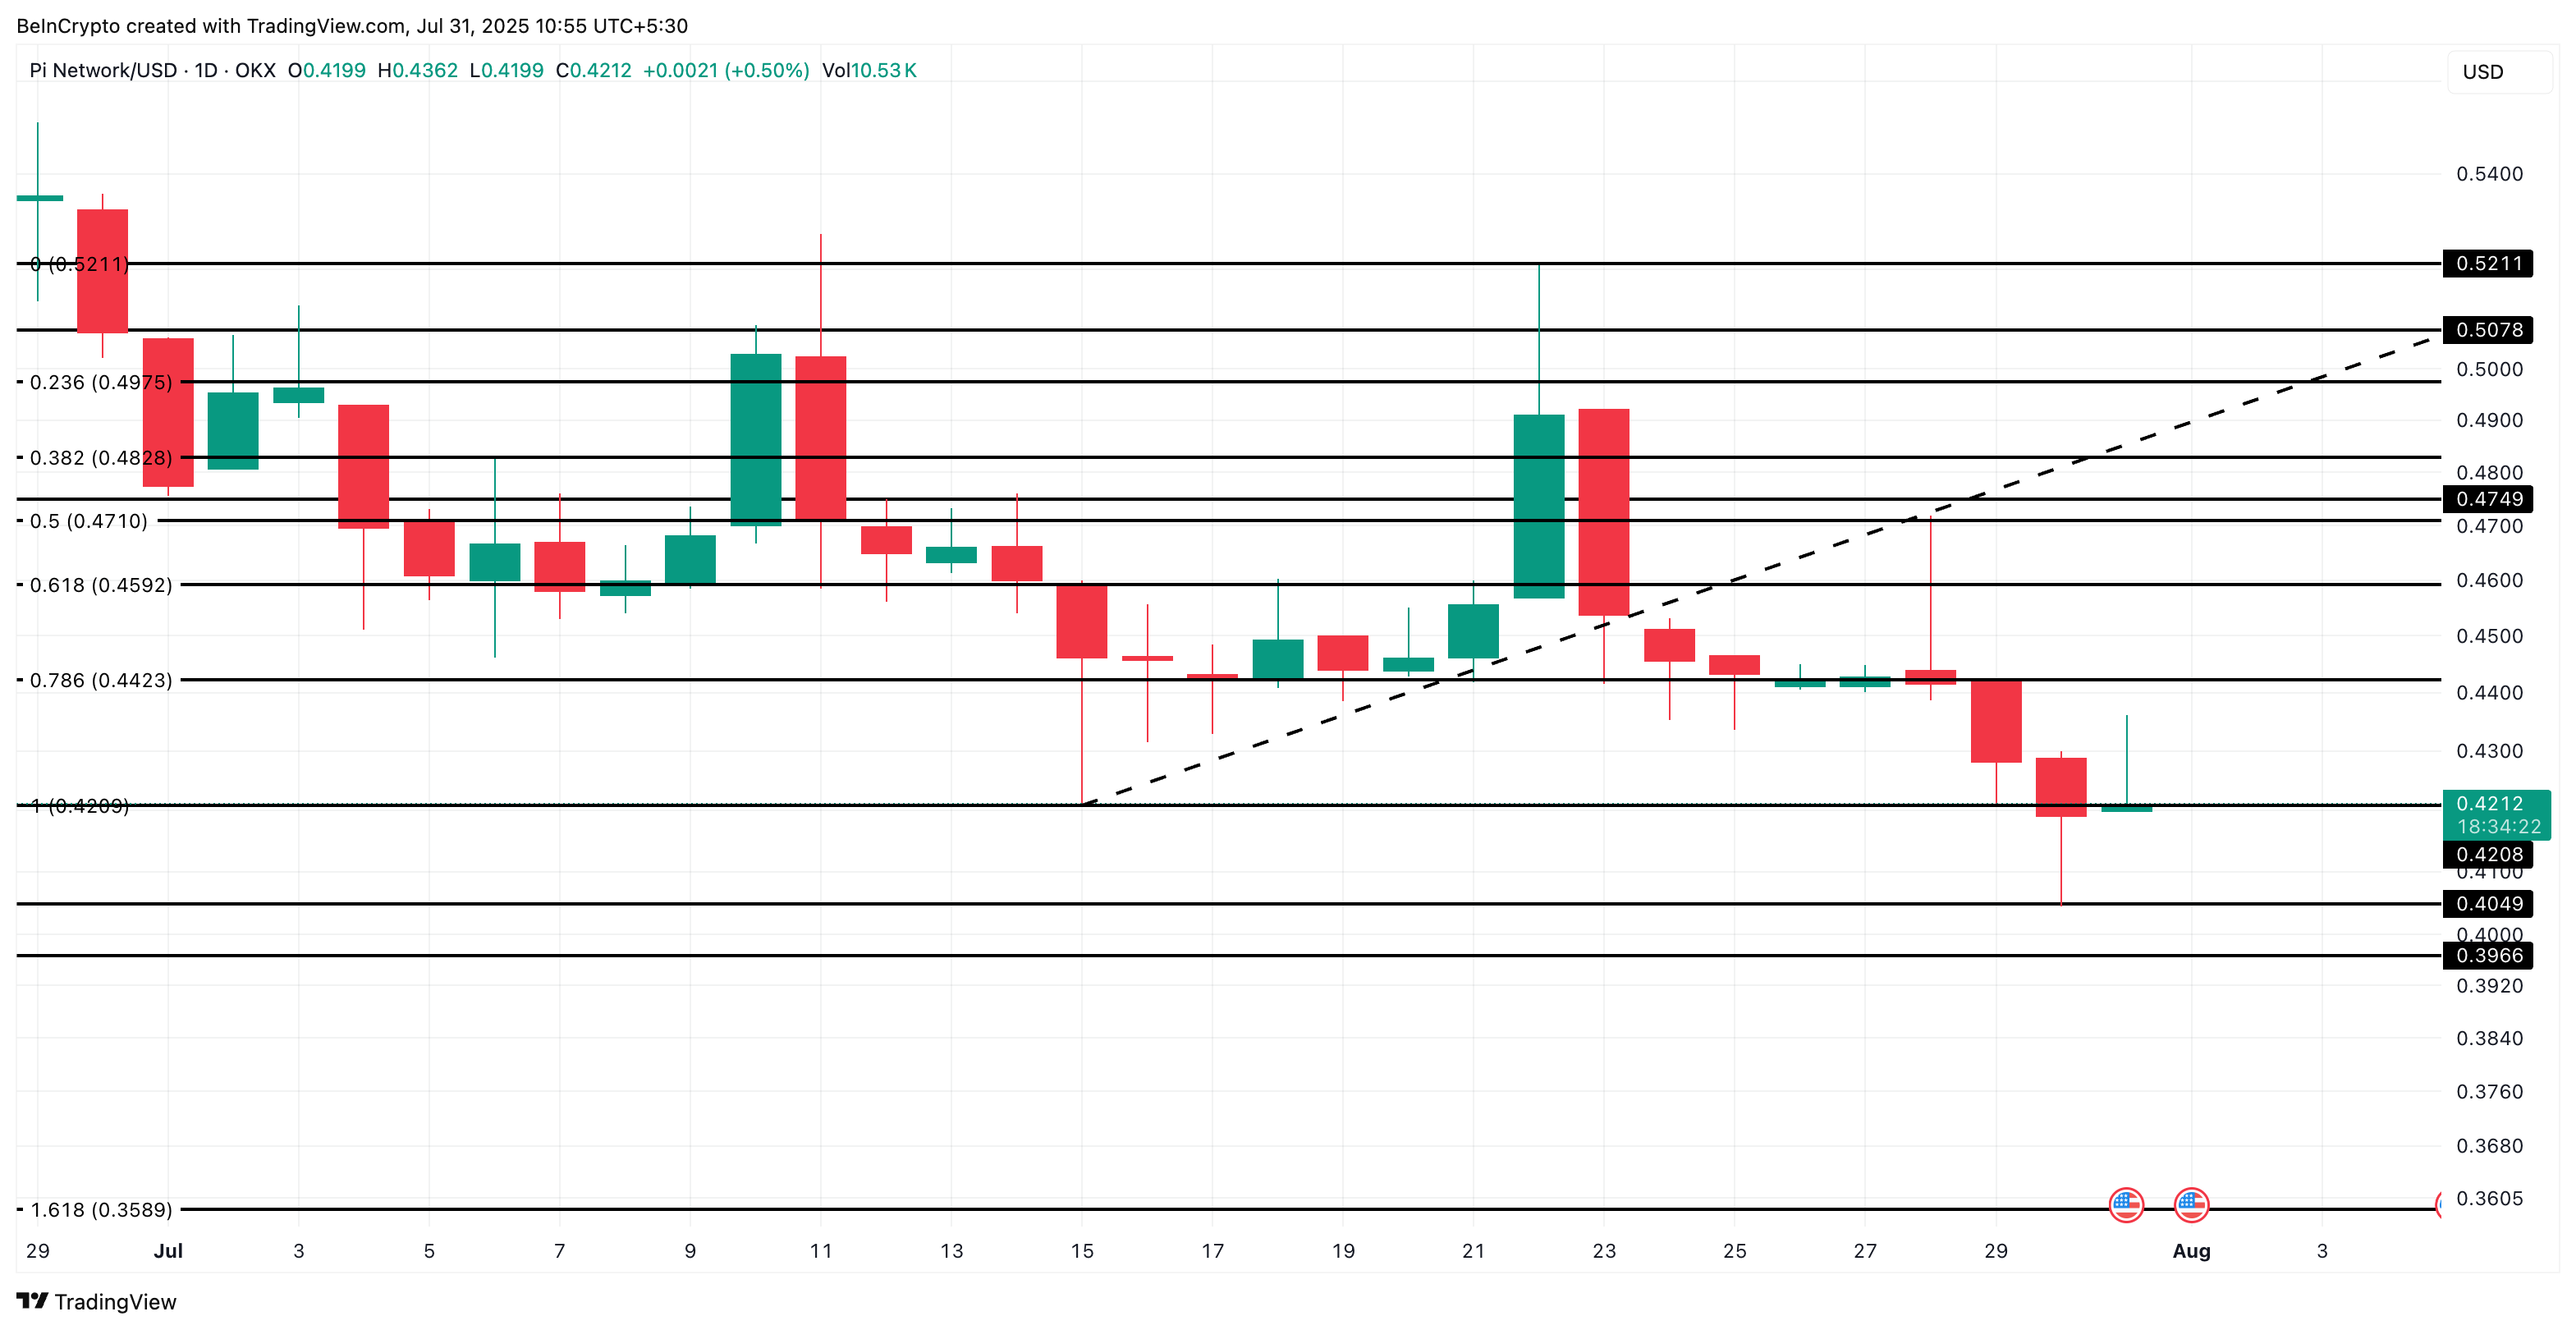
For a recovery, Pi Coin WOULD need to break above $0.44 and $0.45 to invalidate this near-term bearish setup. However, that kind of invalidation would require the ATR and MFI levels to rise.
