BNB Stuck in a Rut: Can Divergence Spark a Breakout?

BNB's price has been trapped in a tight range for weeks—traders are getting restless. Will technical divergence finally shake things loose?
Key Levels to Watch
The Binance Coin has been bouncing between support and resistance like a ping-pong ball. No clear trend, just sideways action that's testing everyone's patience.
Divergence Play
RSI and MACD are whispering about a potential shift. But in crypto, indicators often scream lies—ask anyone who bought the last 'bullish divergence' before a 20% dump.
Market Sentiment
Retail's piling into leverage while whales hover nearby. Classic setup for a liquidity grab—because why let fundamentals interfere with a good old-fashioned stop hunt?
Bottom Line
BNB needs volume to break free. Until then, enjoy the chop—and maybe hedge with some stablecoins (if you still trust those after last year's depegging circus).
Active Address Count is Back on the Rise
BNB’s active address count has been climbing steadily since early May. After slumping through much of March and April, participation began recovering, with a major higher high marked on June 20, reaching over 1.75 million daily addresses.
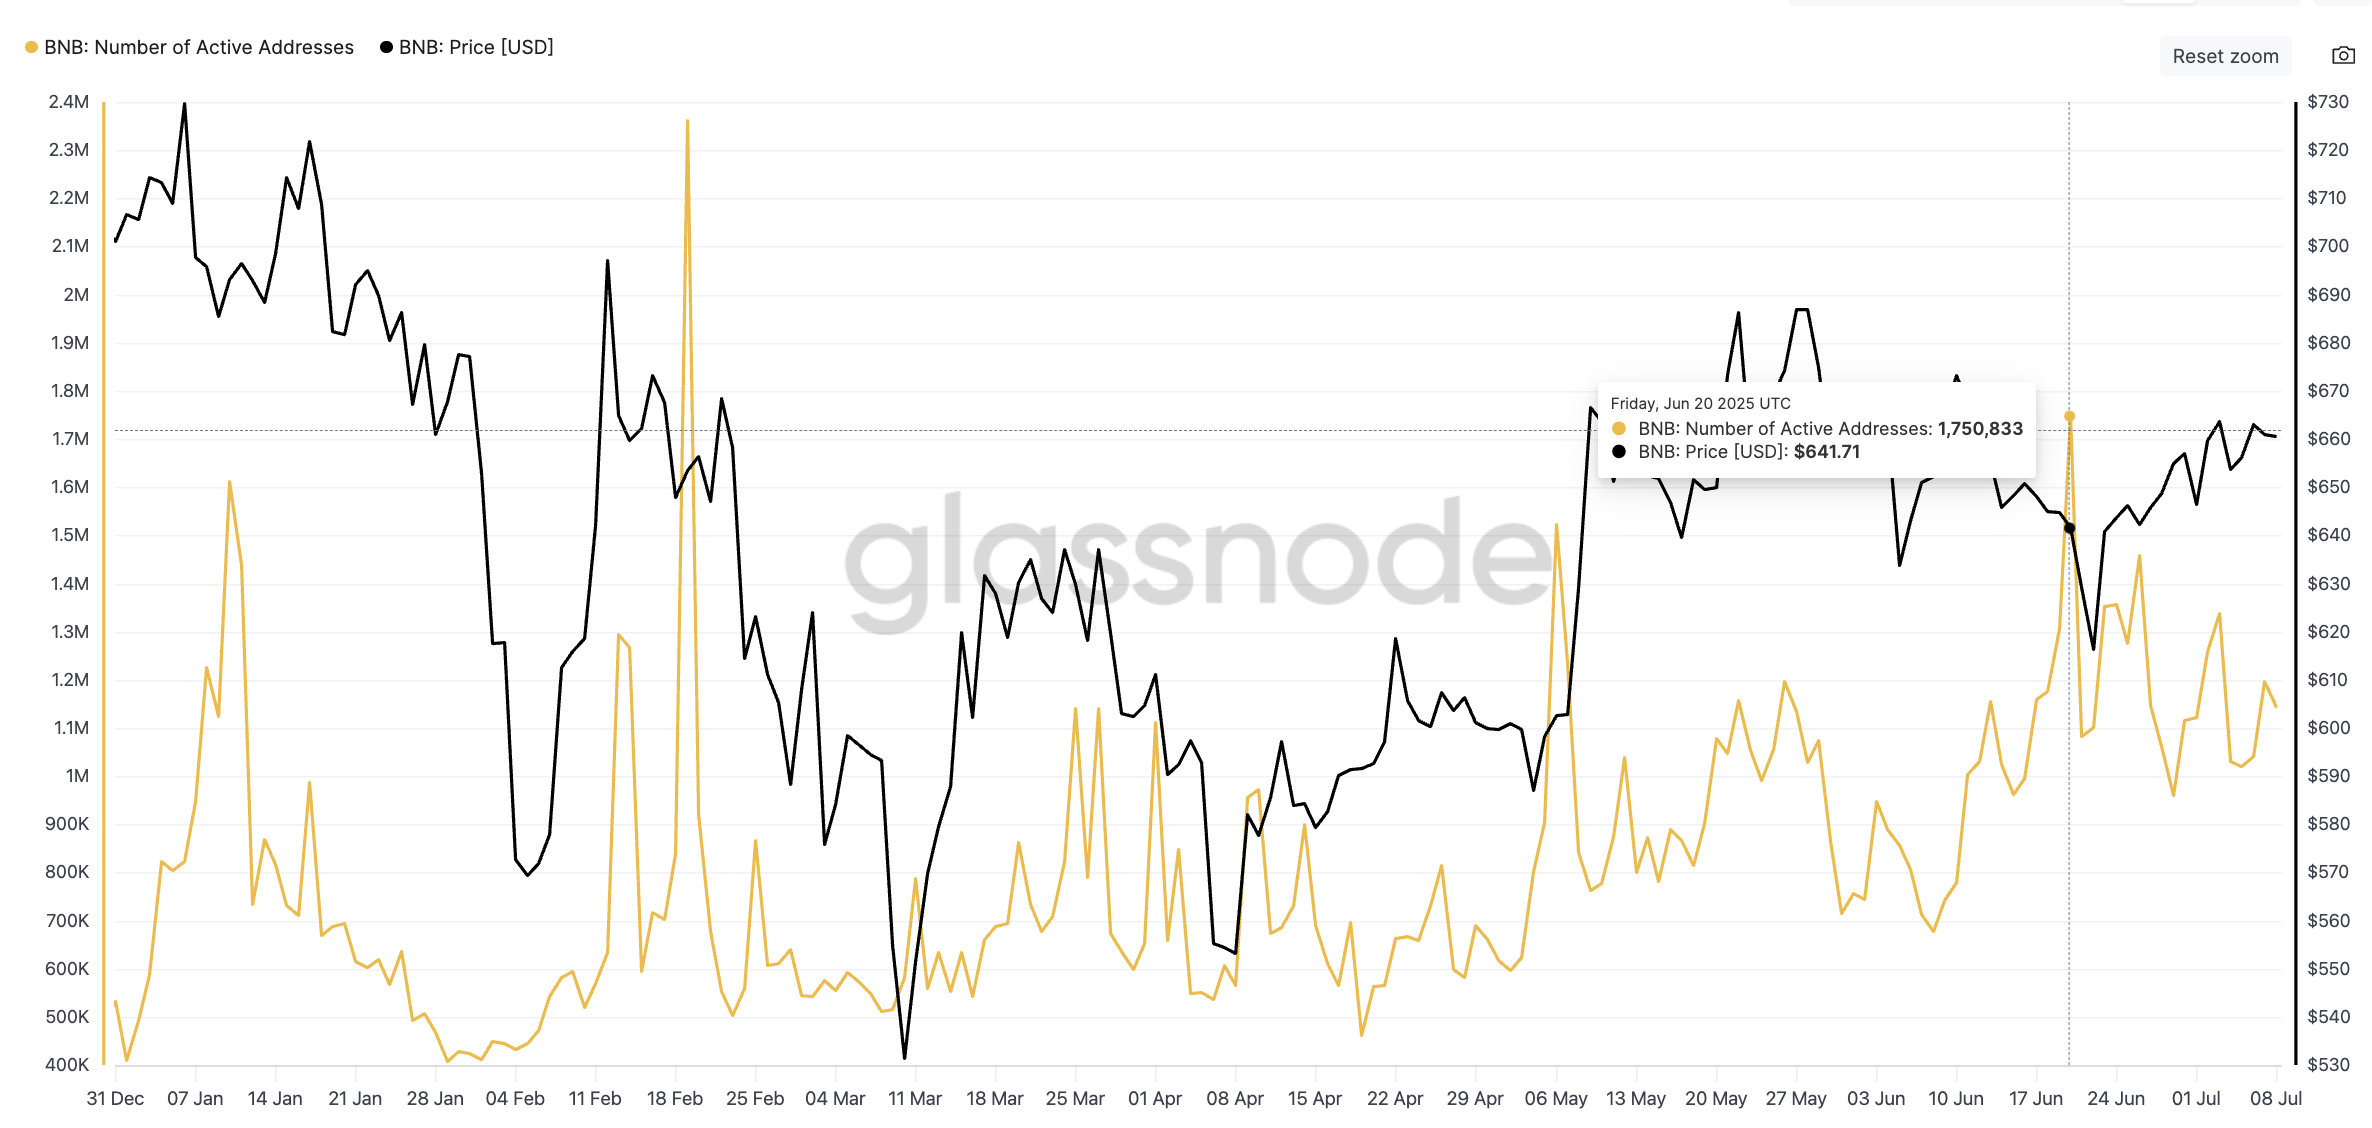
This isn’t just a sign. A rising count of active addresses suggests broader user interest, often the base for more sustainable price movements. It shows that the current consolidation isn’t entirely hollow; there’s growing organic engagement in the background.
Top 1% Wallet Spike Hints at Quiet Accumulation
Glassnode data also shows something we haven’t seen all year: a double spike in the percentage of supply held by BNB’s top 1% of addresses. These two surges, on June 21 and June 28, mark the only significant upticks in 2025.
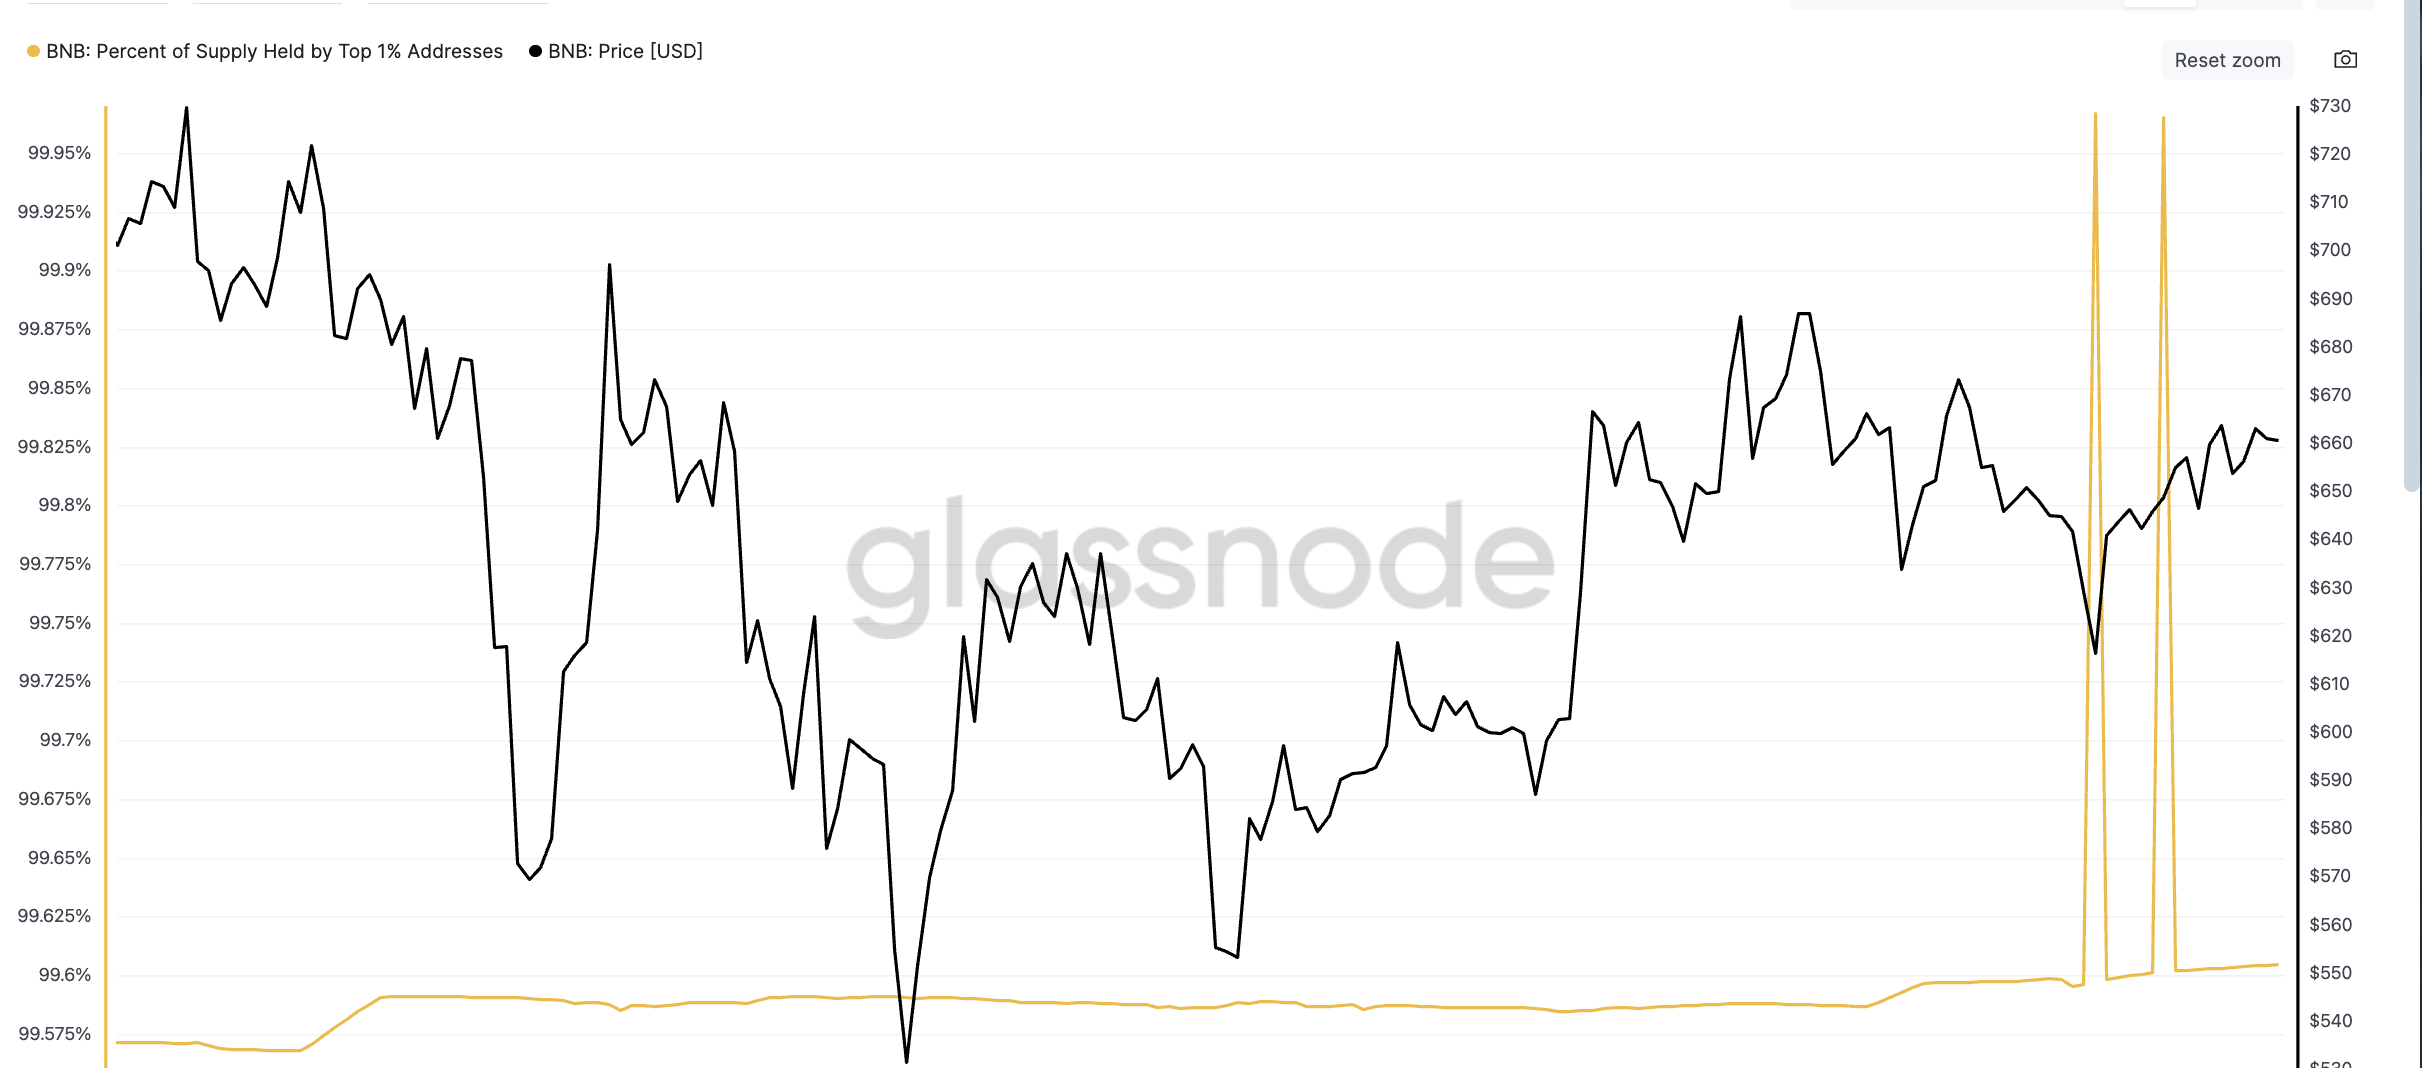
These top 1% holders, typically whales or institutional addresses, had been flatlining for months. The sudden moves could point to silent OTC buys or redistributions. These wallets usually don’t chase rallies — they build positions when the price is quiet. That aligns with BNB’s current low-volatility price structure.
The “top 1%” metric tracks the total BNB supply held by the largest addresses. A spike here signals accumulation by the biggest holders, which can precede a move, if it’s sustained.
Ascending Triangle Pattern and RSI Divergence in Motion
On the daily chart, BNB continues to respect an ascending triangle pattern, with strong horizontal resistance at $665–$693.
This pattern typically signals an upcoming breakout, but it’s only valid if the structure holds. So far, BNB is trading near $661, staying just under the immediate yet strong resistance level of $665. If BNB price manages to break this level, it would also mean a pattern breakout.
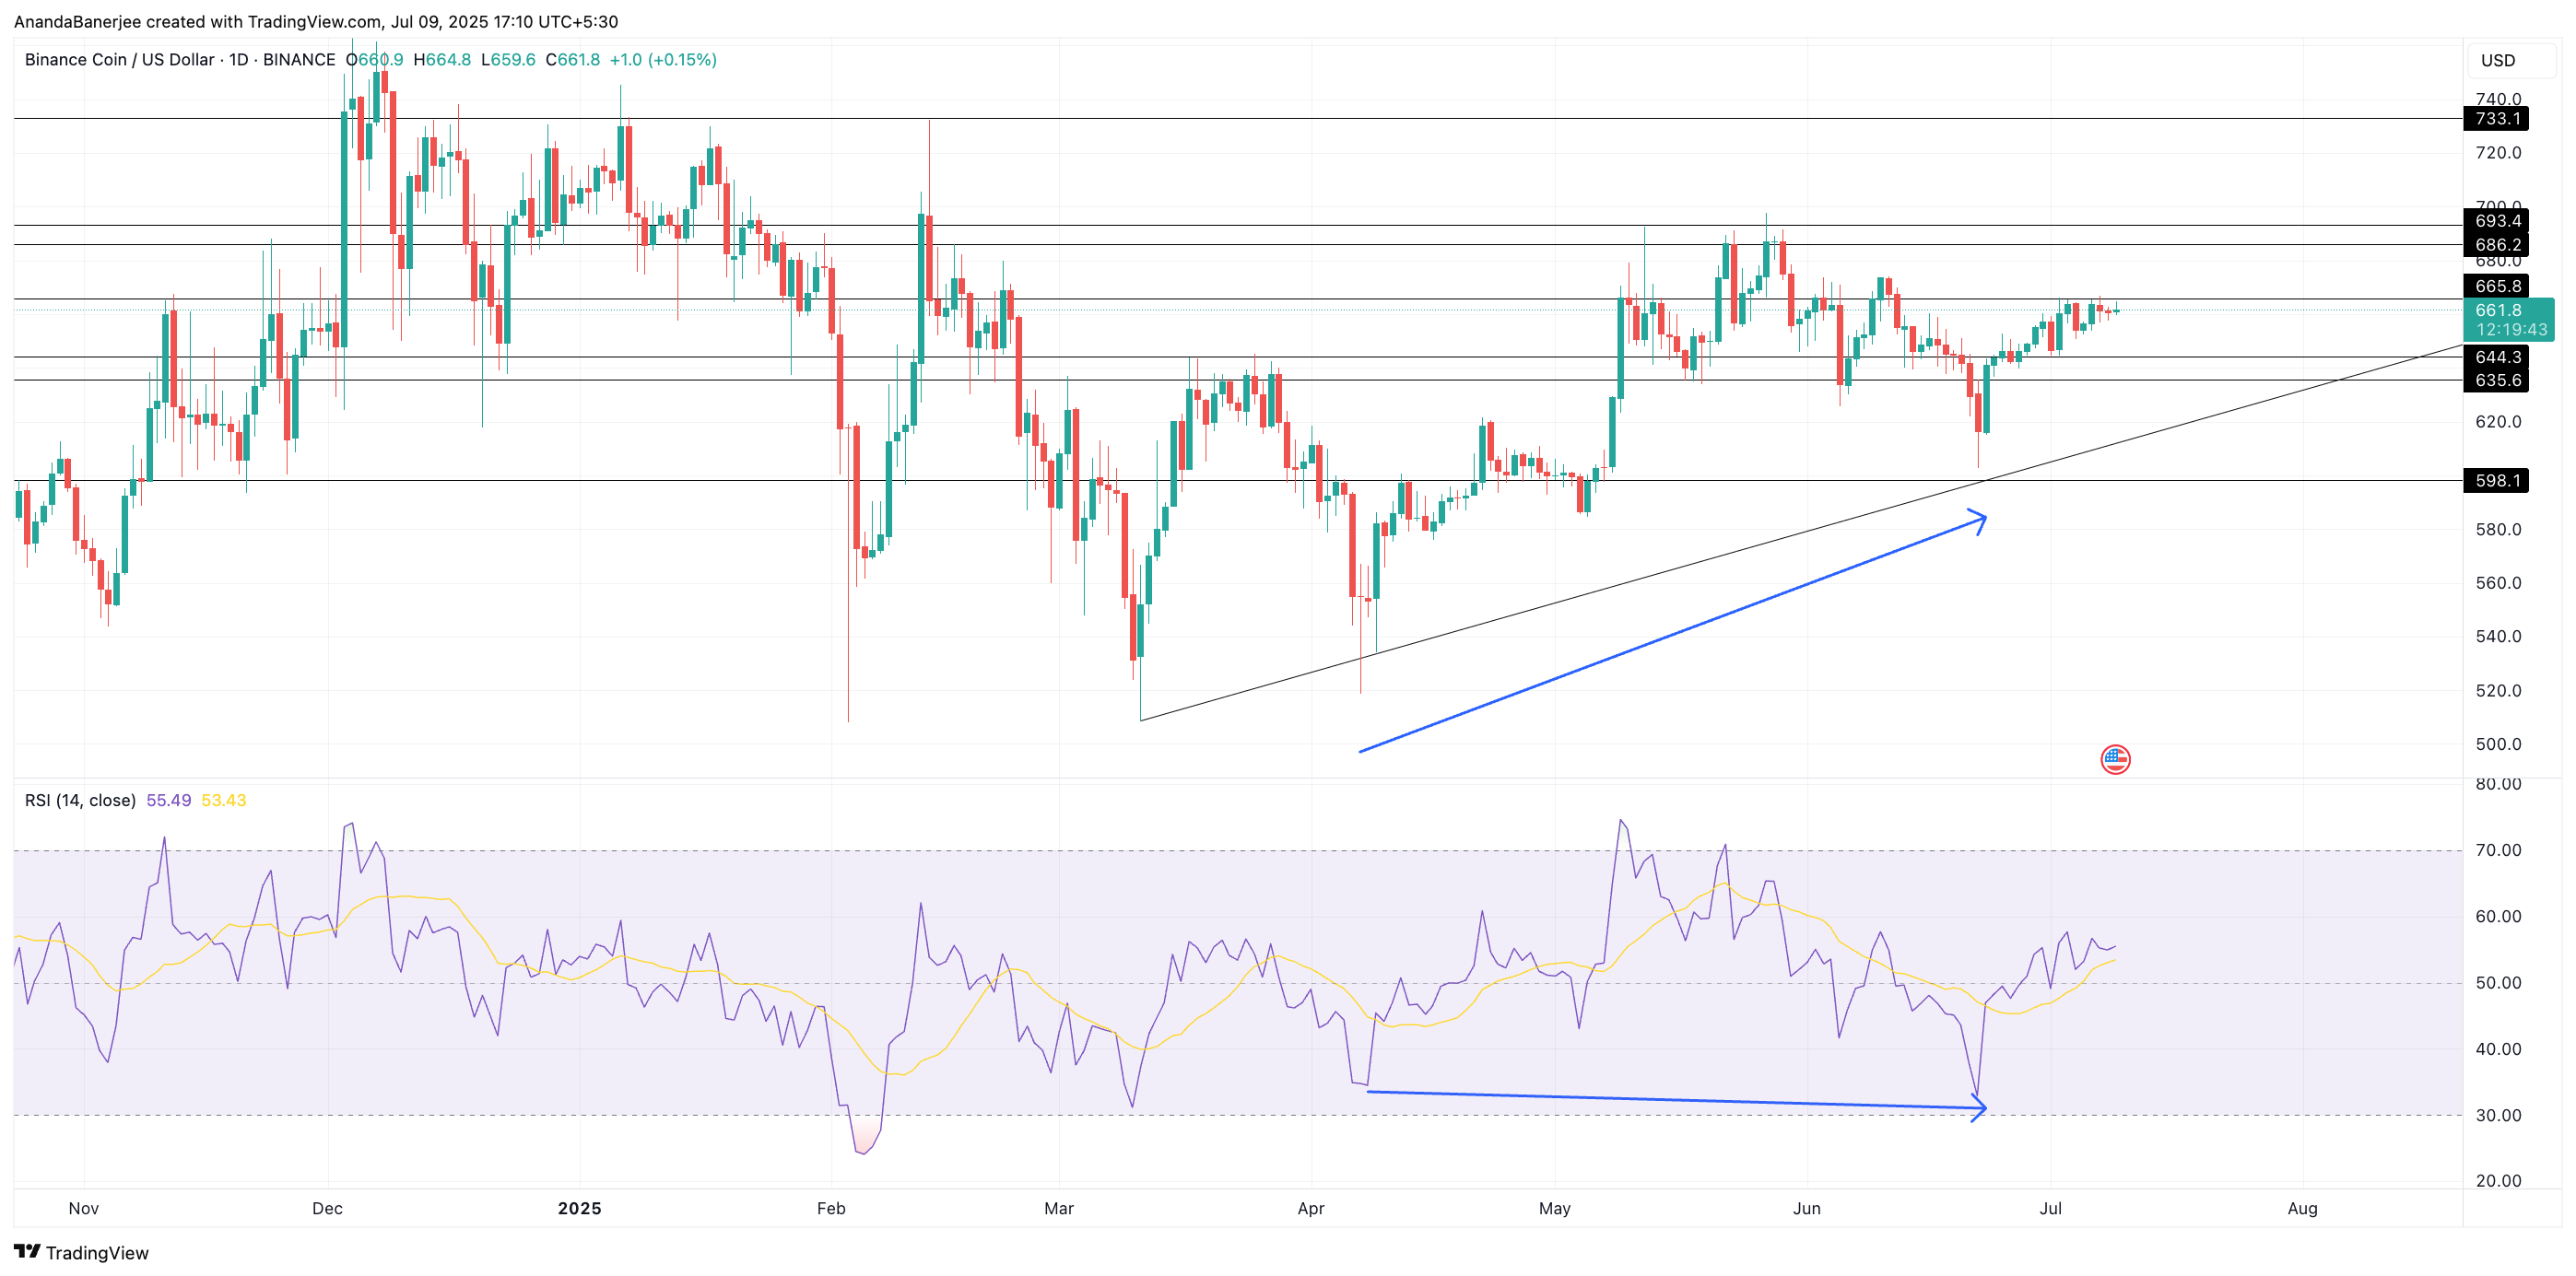
However, as the ascending triangle pattern has a broad upper trendline, made possible by multiple horizontal support and resistance lines, the BNB price WOULD require more firepower than just a single resistance breach. Here’s where it gets interesting. From April 7 to June 22, the BNB price made higher lows, while RSI made lower lows; a classic bullish divergence.
This divergence hints at weakening bearish momentum even as the price holds steady. RSI has since turned back upward, validating the triangle and adding strength to the breakout case. If the current sentiment holds and participation stays high, BNB could eye a MOVE toward $686, $696, or even the longer-term ceiling at $733.
All this bullish structure hinges on one level: $635. A breakdown below this would invalidate both the triangle and the RSI divergence, and would likely come with a drop in active addresses or a reversal in whale holdings. That’s your red flag zone.
