BONK Surges 60% in 7 Days—Golden Cross Primed to Trigger Mega Rally?

Meme coin madness is back—BONK just ripped past resistance with a 60% weekly gain. Now traders are eyeing the looming golden cross like starving wolves spotting fresh meat.
Golden Cross or Golden Trap?
Technical analysts are split. The 50/200-day MA crossover could signal liftoff… or yet another ‘buy the rumor, sell the news’ meme coin rug pull. Remember: in crypto, even dead cats bounce twice.
Volume tells the real story
That 60% pump wasn’t quiet—spot volumes hit three-month highs. Either this is the start of a new ‘dumb money’ cycle or hedge funds are front-running the retail herd again. Place your bets.
Just don’t mortgage your house. The SEC hasn’t even decided if meme coins count as ‘real’ securities yet—though they’ll certainly pretend they knew all along when the subpoenas fly.
Exchange Flows Suggest Supply Drain
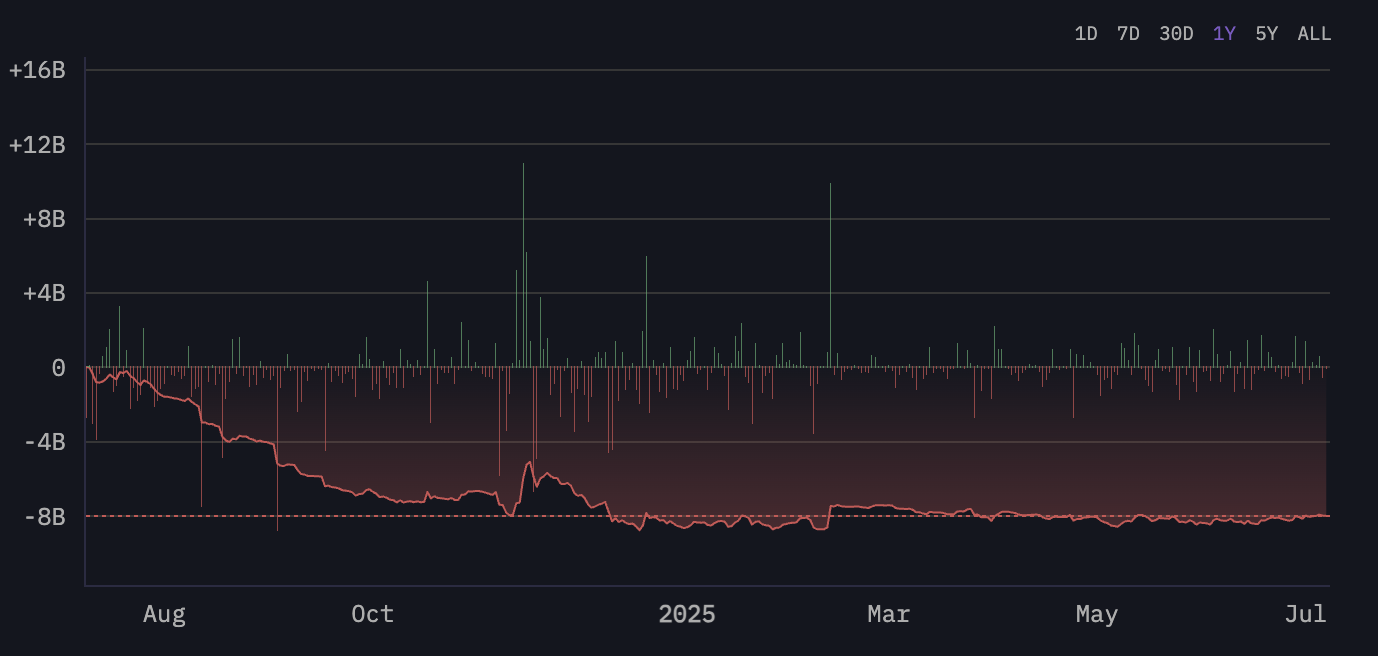
Arkham’s one-year BONK netflow chart shows sustained negative net flows, which means more BONK is leaving exchanges than entering; a classic accumulation pattern, not sell pressure.
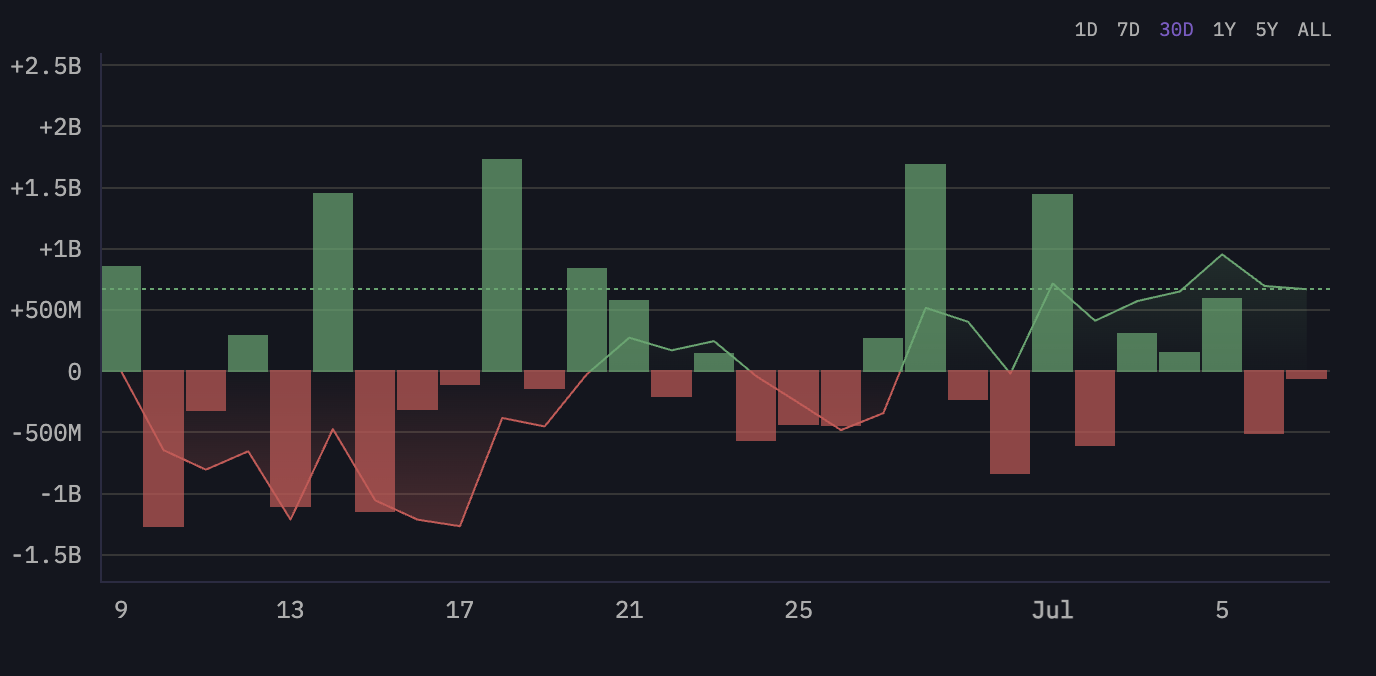
However, zooming into the past 30 days, the trend is less aggressive. Netflows remain negative but have stabilized, indicating neutral-to-bullish positioning rather than panic-driven exits.
In short, the selling already happened months ago. What we’re seeing now is a supply crunch forming quietly, with recent sentiment pushing prices up faster than spot inflows can catch up.
Bulls Have The Edge Now
BONK’s Elder RAY Index just flipped into bullish territory, with bull power overtaking bear pressure; a sign that buyers are back in control.
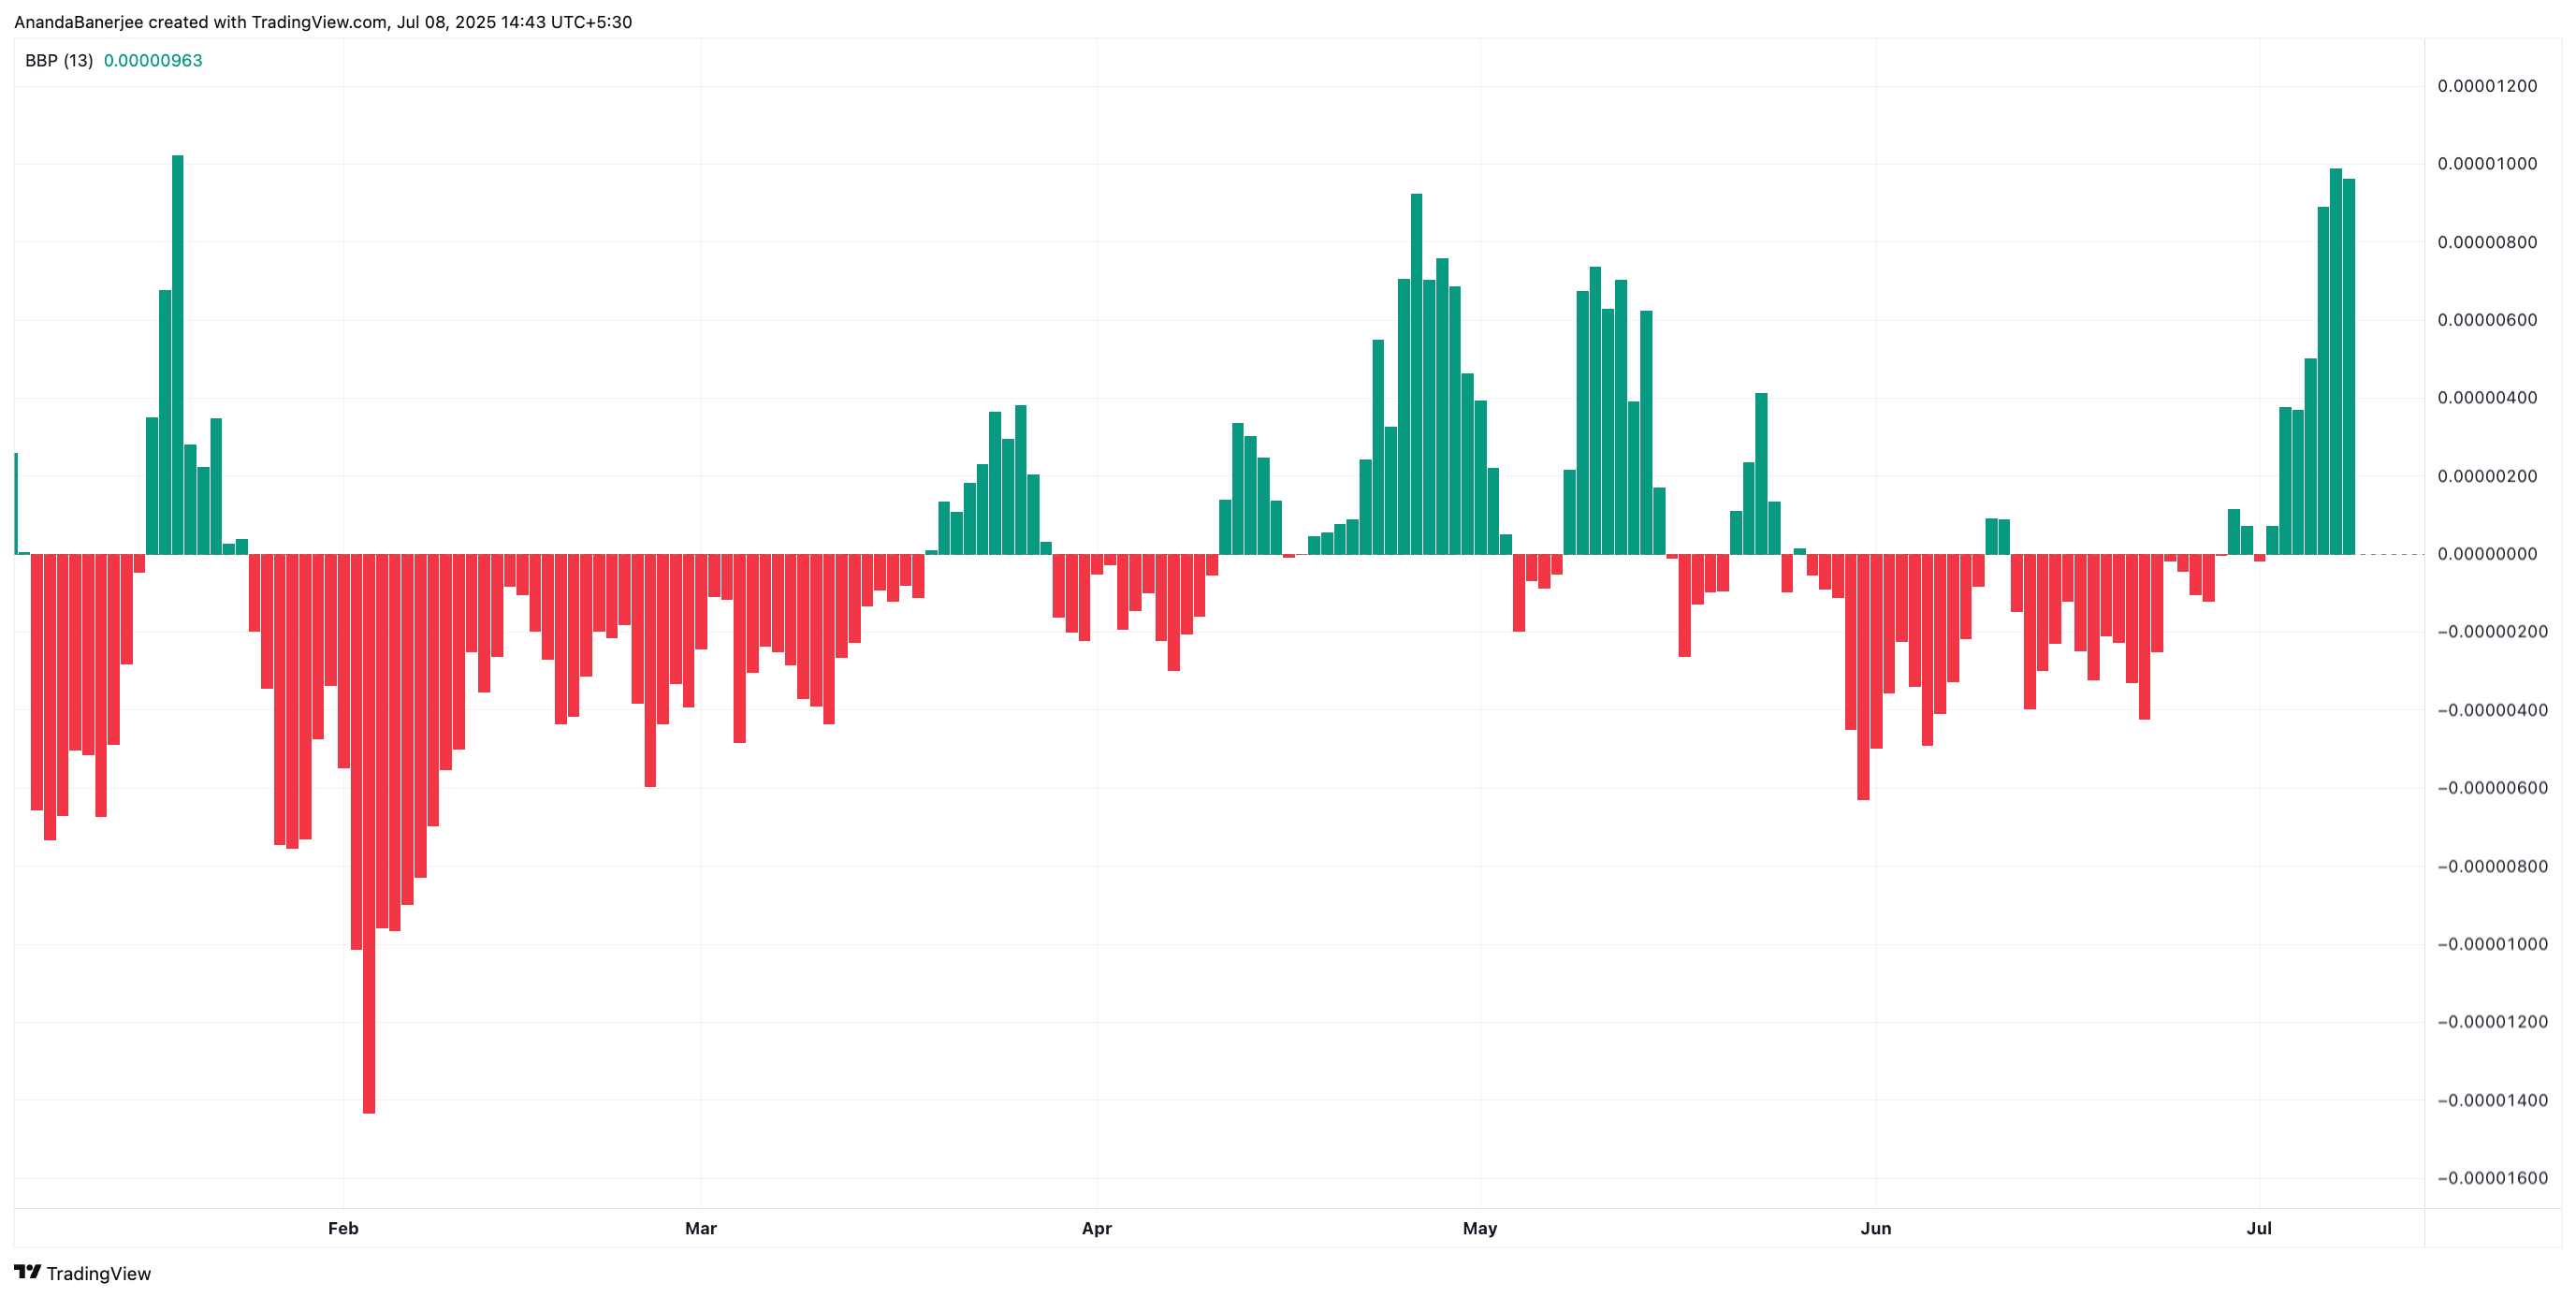
The Elder Ray Index measures the strength of bulls and bears by comparing price action with a moving average; a positive reading means buyers are dominant.
50/200 EMA Golden Crossover Could Be the Real Trigger
One key indicator to watch is the looming Golden Crossover, where the 50-day EMA (the orange line) is about to cross above the 200-day EMA. EMAs, or Exponential Moving Averages, track price trends more sensitively than simple averages. When the shorter EMA crosses the longer one, it’s often seen as a bullish signal.
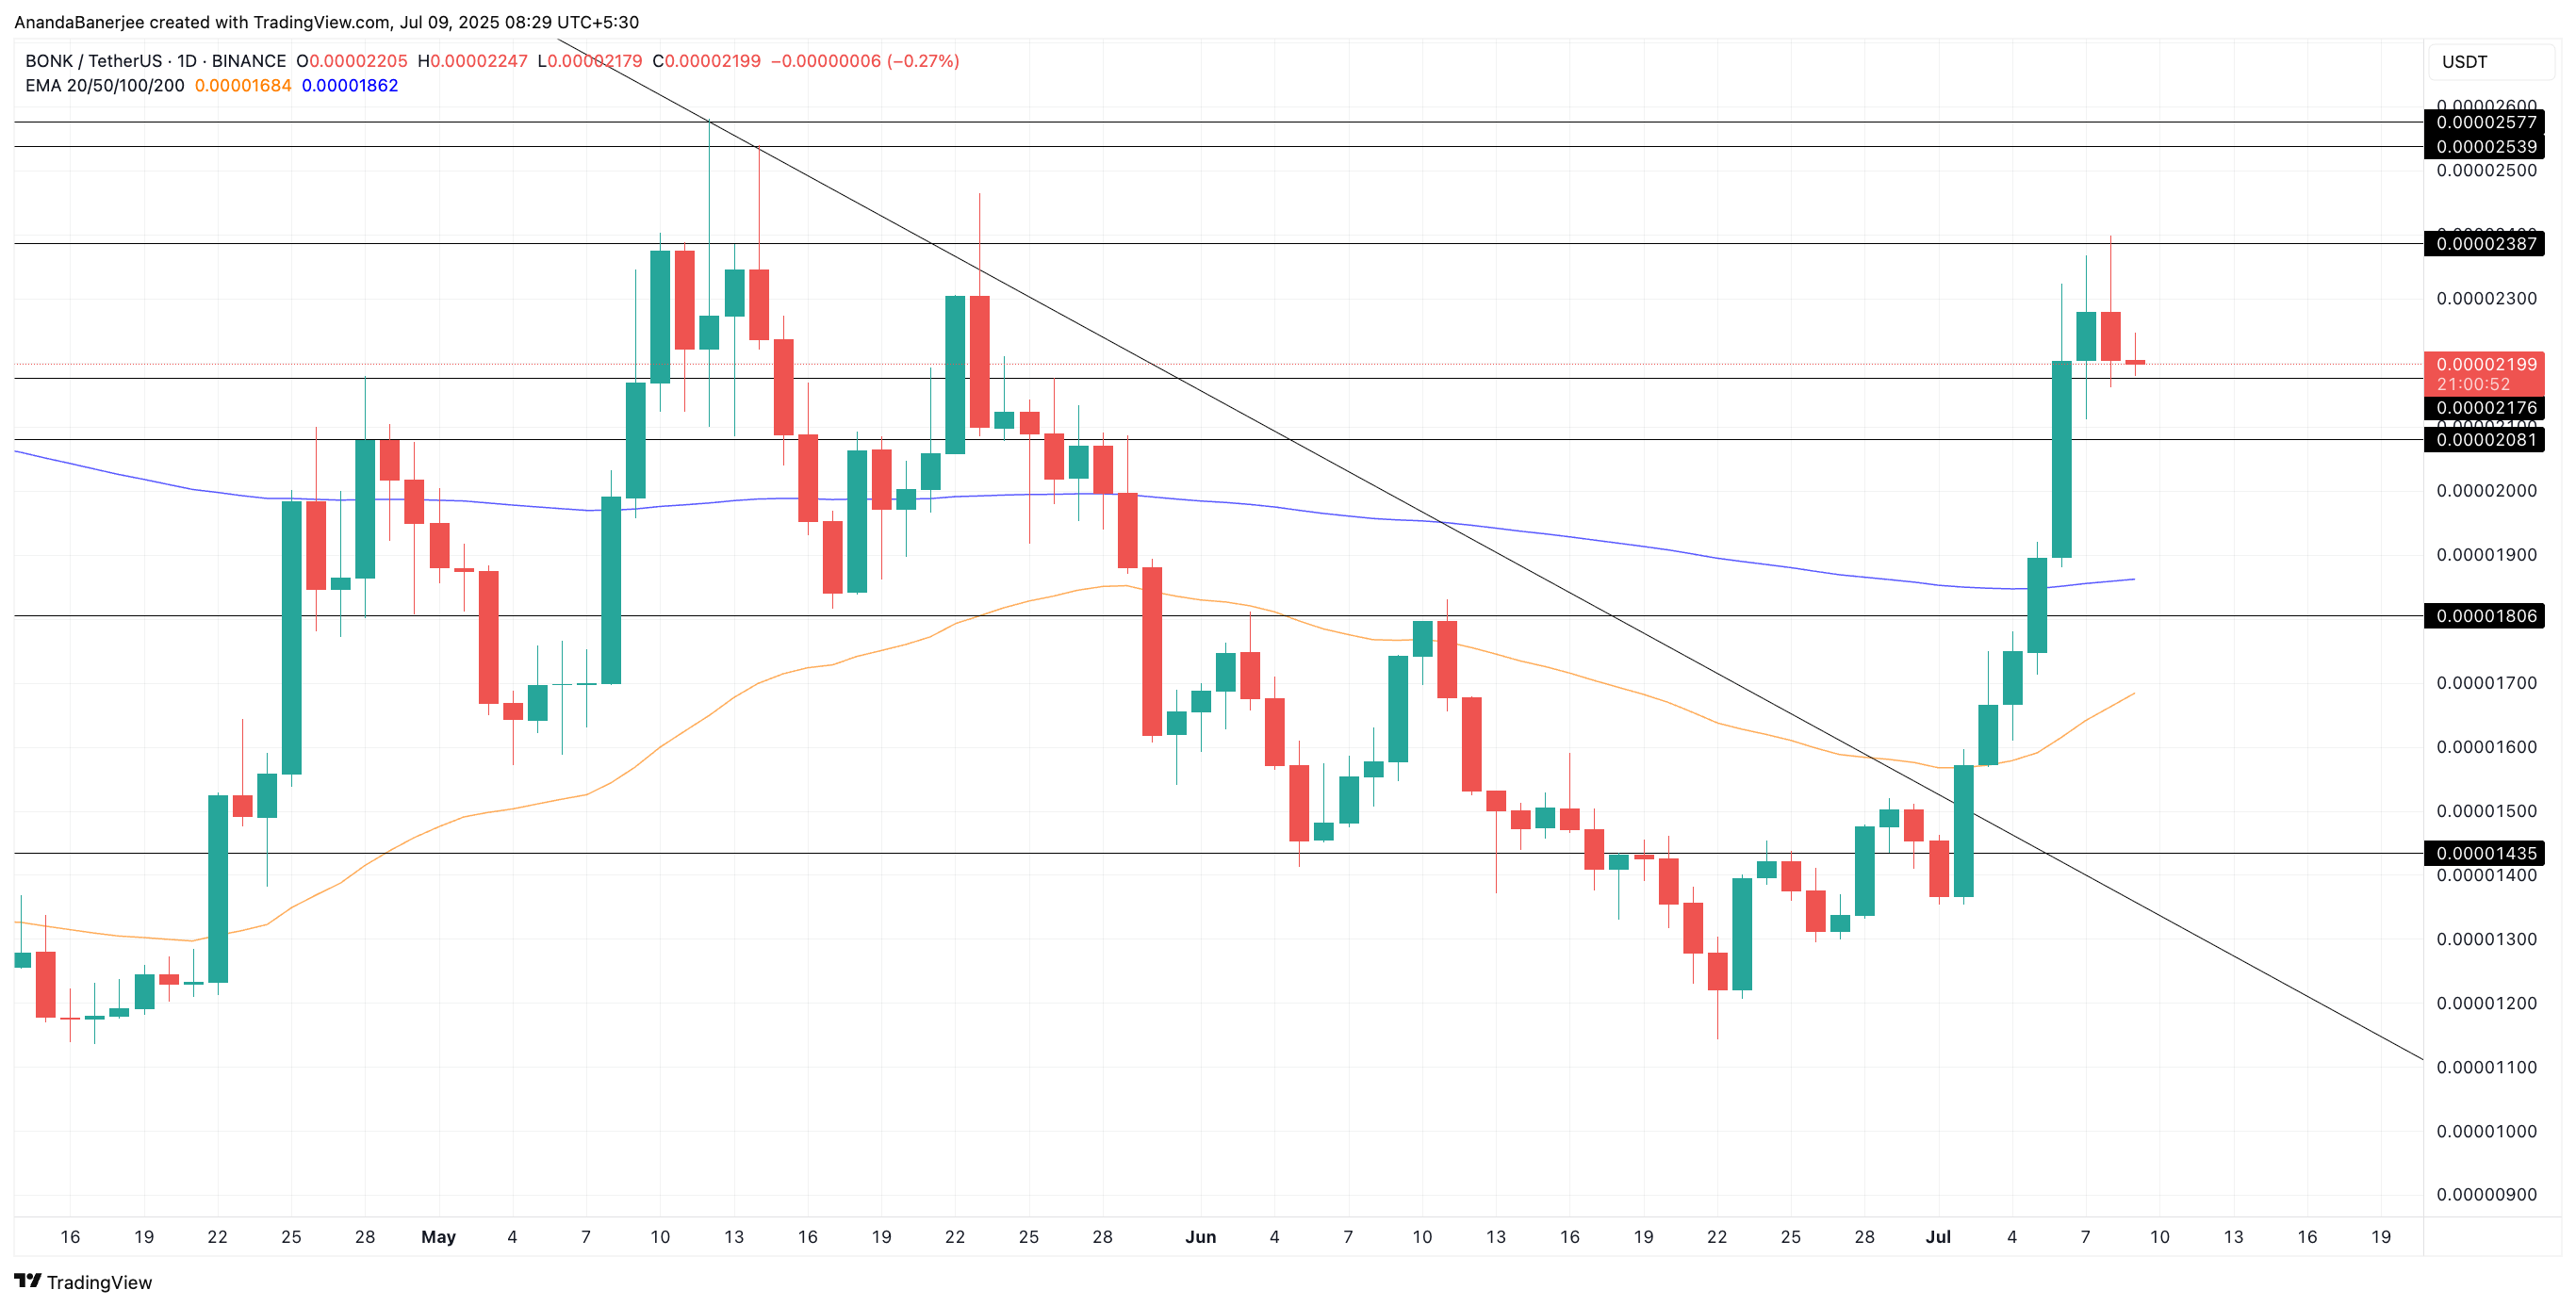
If this crossover confirms in the coming days, BONK could push through resistance at $0.00002840 and attempt a run toward $0.00003600 or even higher.
BONK Price Breaks Out of Year-Long Falling Wedge
BONK price has officially broken out of a year-long falling wedge in the daily timeframe, a pattern that’s typically seen as a bullish reversal setup. The breakout began when the price crossed above $0.00001550, confirming strength after months of compression between lower highs and stable support.
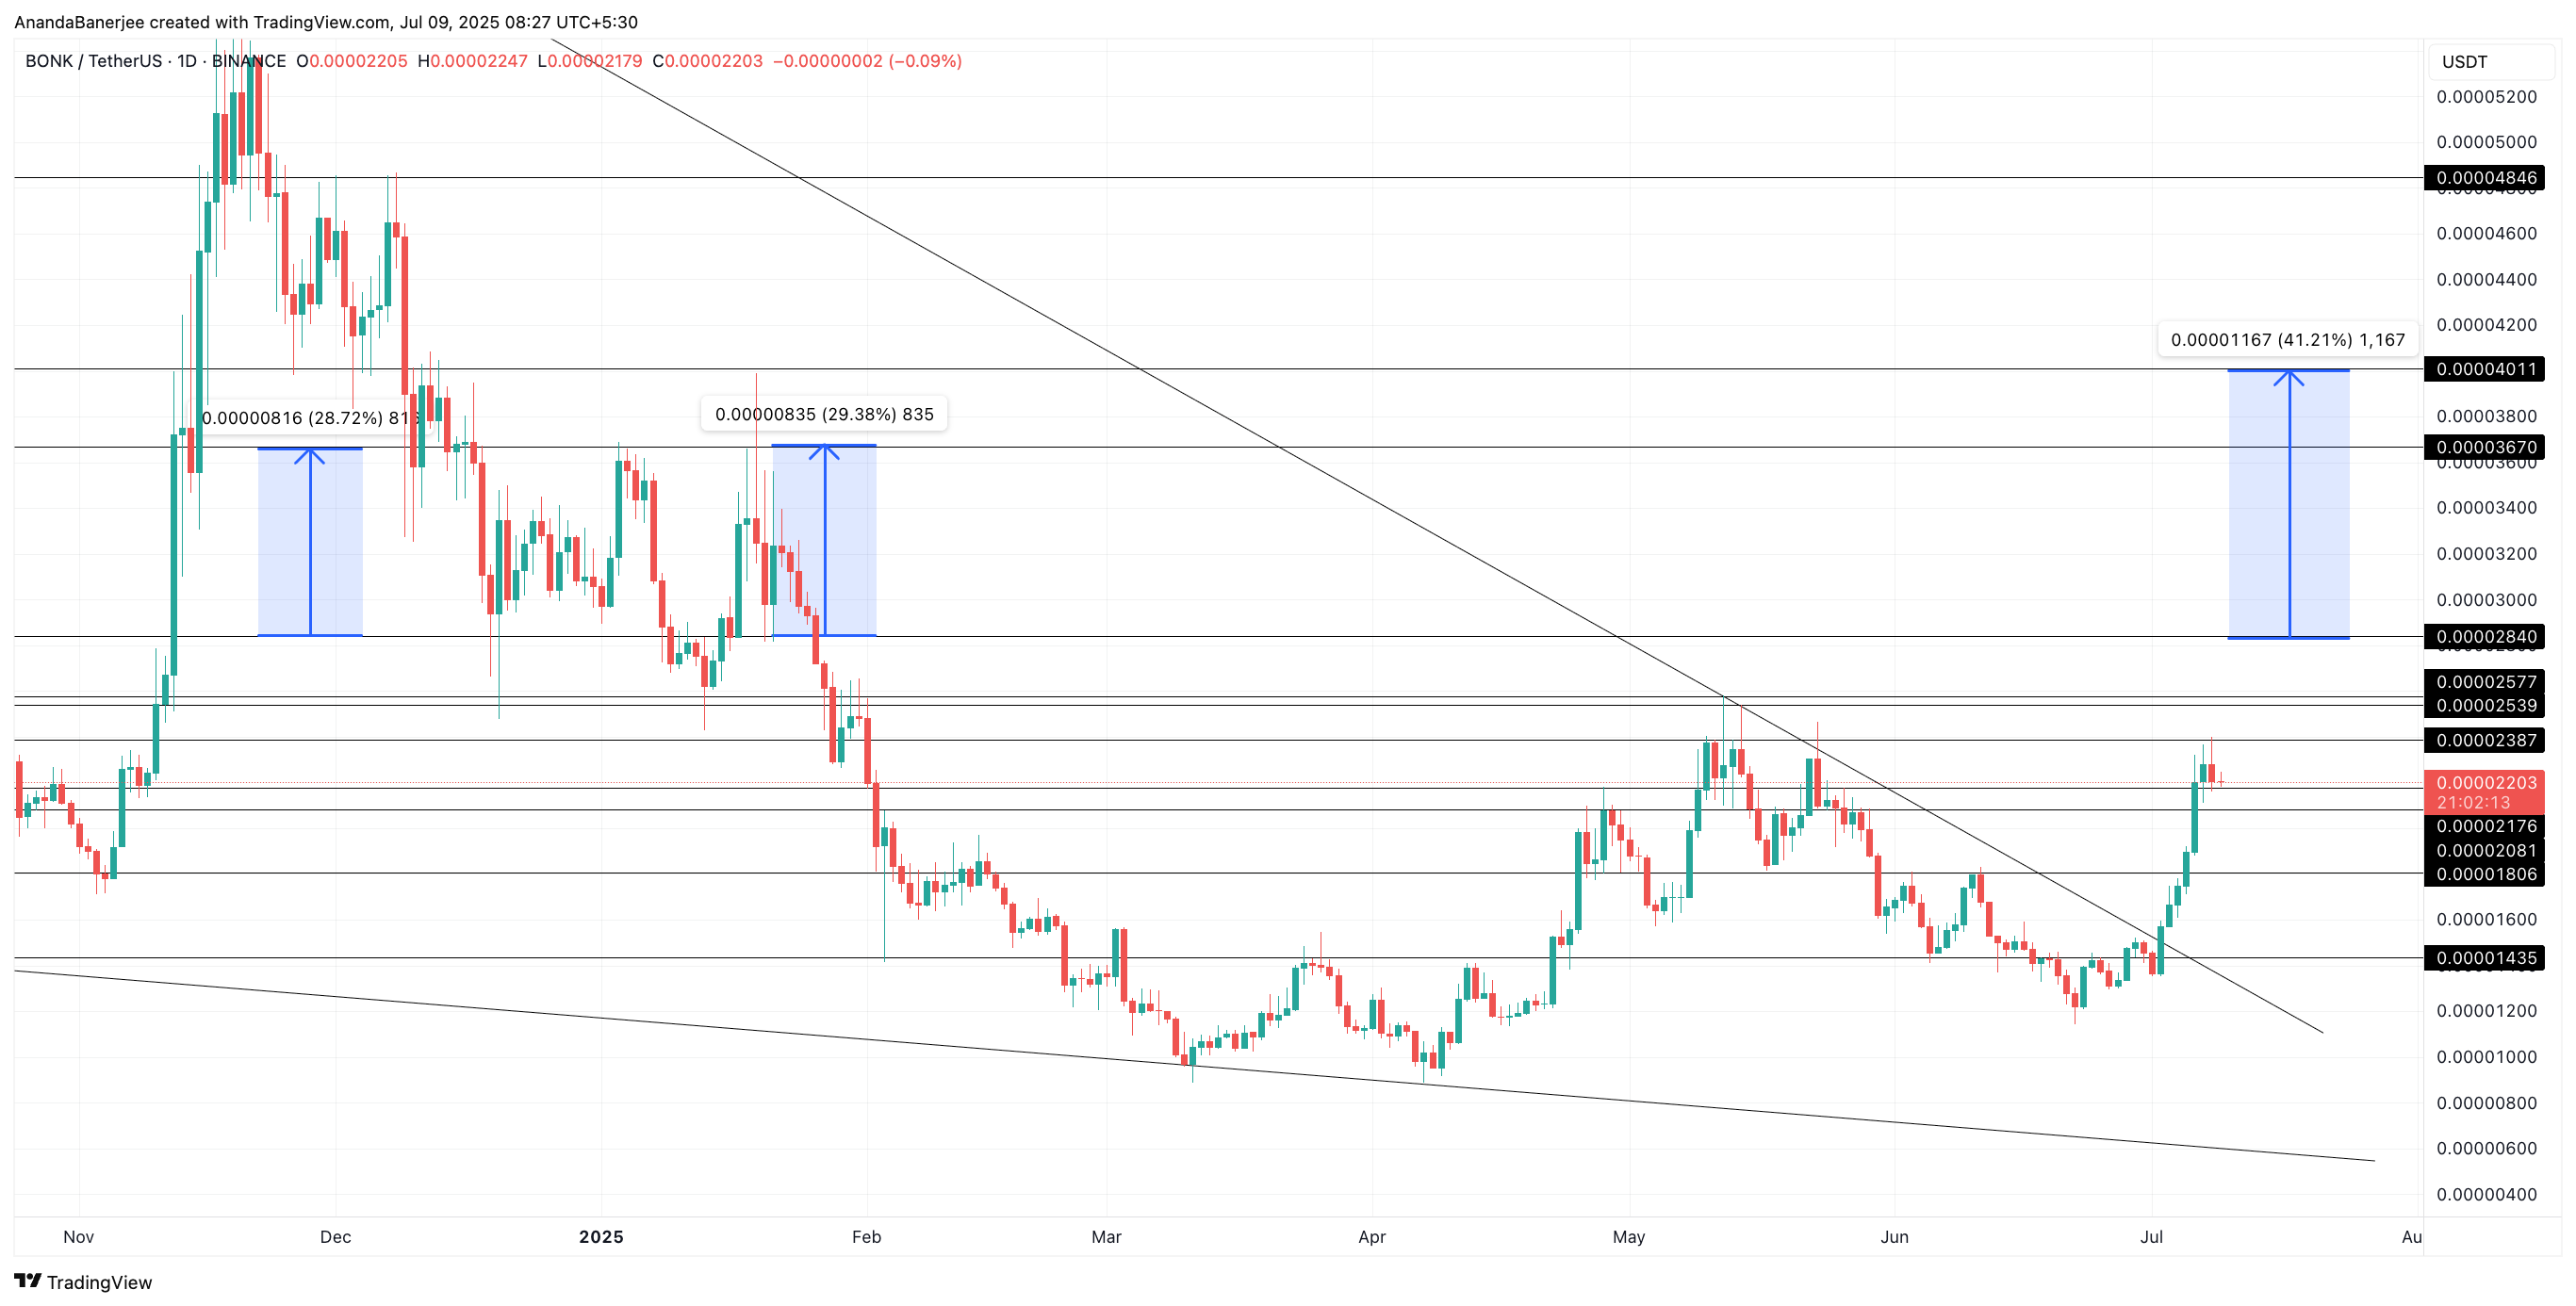
As of now, BONK is consolidating around $0.00002203, just beneath a key resistance zone NEAR $0.00002389. Another key resistance level in the short term is $0.00002577. If the price breaks above this band with volume, the next upside targets lie at $0.00002840, followed by $0.00003670.
Notably, the zone between $0.00002840 and $0.00003670 doesn’t feature many strong resistance points.
For now, the structure favors continuation, but bulls will need a clean breakout above $0.00002577–$0.00002840 to unlock higher targets.
If BONK slides below $0.00001806, the breakout loses momentum. A fallback under $0.00001435 WOULD confirm a failed reversal, putting the wedge pattern in doubt.
