XRP Price Surge: Is This Rally a Bull Trap or the Real Deal?

XRP's latest price spike has traders buzzing—but seasoned crypto vets are side-eyeing the charts. Here's why the optimism might be premature.
The pump before the dump?
While retail FOMO kicks in, on-chain data shows whales quietly accumulating at key support levels. Classic bull trap setup or institutional conviction? The 20% weekly gain smells like both.
Liquidity games in play
Exchanges are seeing abnormal XRP deposit spikes—usually a precursor to sell pressure. Meanwhile, derivatives open interest just hit a 3-month high. Someone's about to get liquidated.
Regulatory deja vu
With the SEC's appeal deadline looming, this rally mirrors 2023's pre-lawsuit pump. Because nothing says 'healthy market' like gambling on courtroom outcomes.
XRP bulls might want to check the calendar before chasing this rally. In crypto, even dead cats bounce—especially when shorts get greedy.
XRP Is Up 4% This Week—But Traders Are Quietly Exiting the Market
Glassnode data reveals a steady uptick in XRP’s Exchange Net Position Change over the past week. On-chain data shows that this metric, which tracks the net amount of tokens moving onto centralized exchanges, ROSE to an eight-month high of 283 million XRP on July 7.
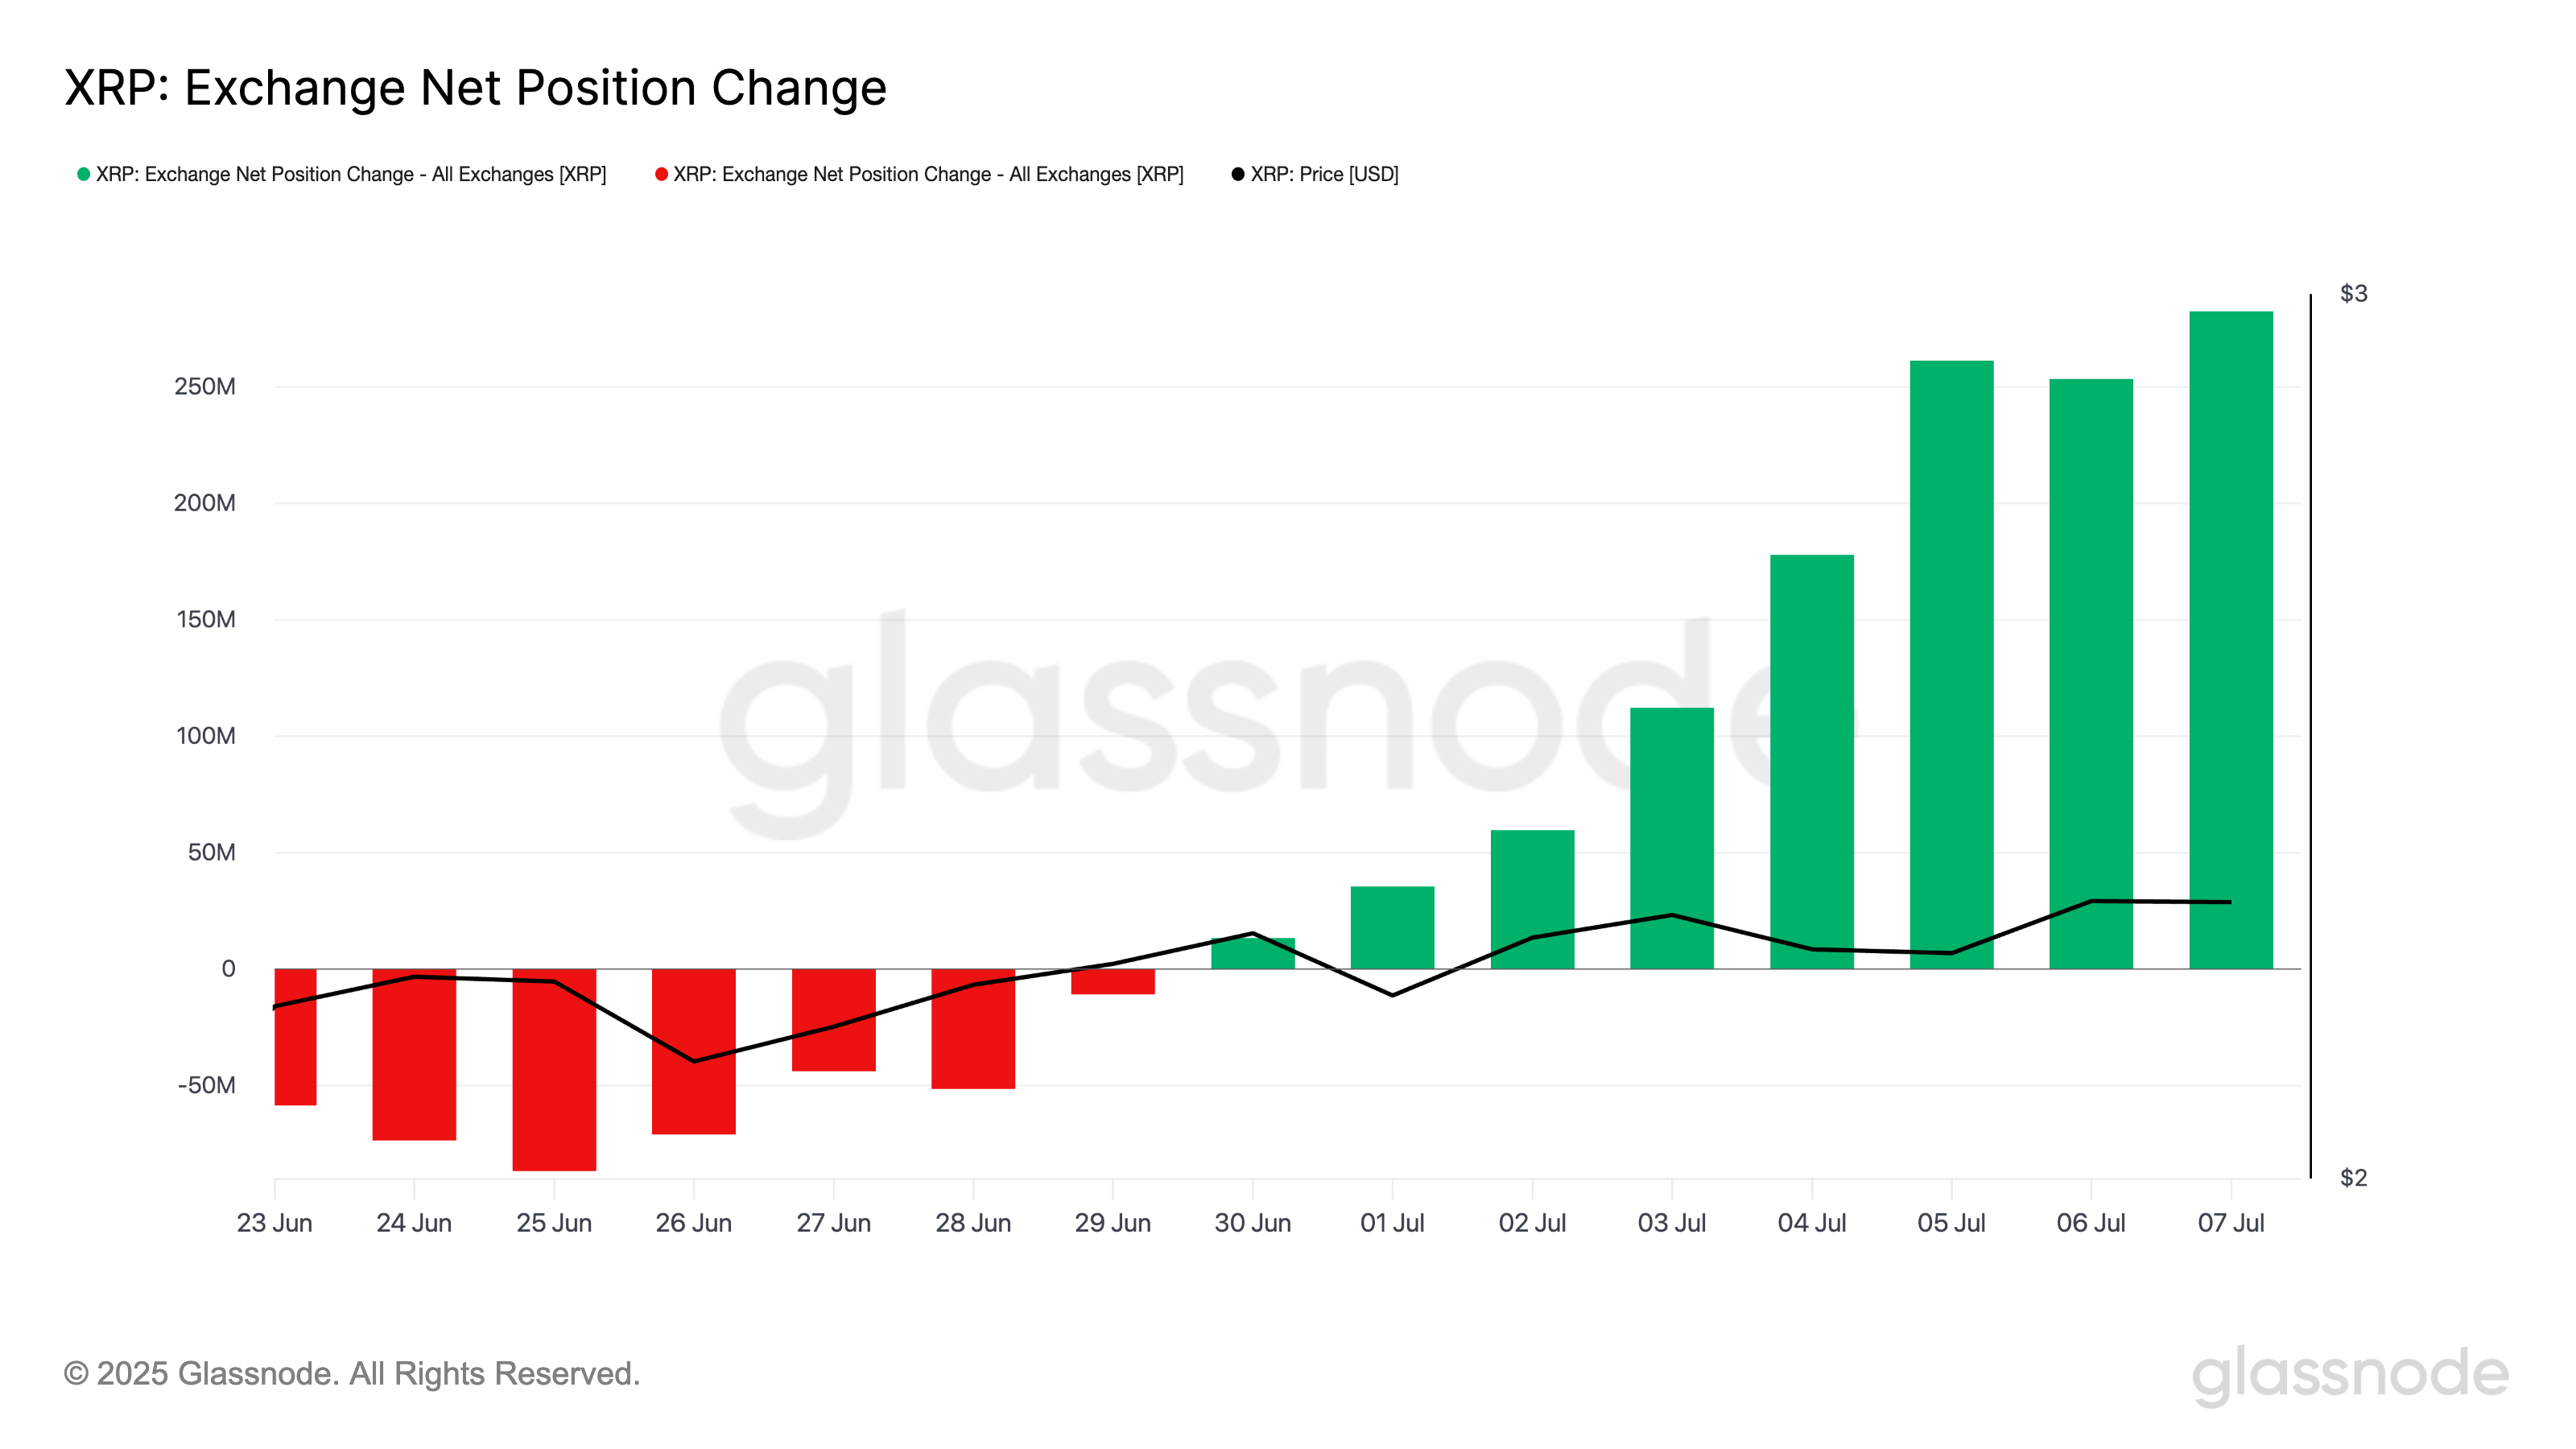
The timing is notable, as the spike in exchange inflows coincides with XRP’s recent price increase. This means that many traders appear to be using the rally as an opportunity to exit positions, exerting some downward pressure on the token.
Furthermore, despite XRP’s spike, its Chaikin Money FLOW (CMF) has gradually trended downward, forming a negative divergence with the token’s price. As of this writing, this indicator is at 0.01, poised to break below the zero line.
The CMF indicator measures how money flows into and out of an asset. When its value is positive, it suggests high demand and upward price momentum. On the other hand, negative CMF readings point to strengthening selling pressure and rising bearish sentiment.
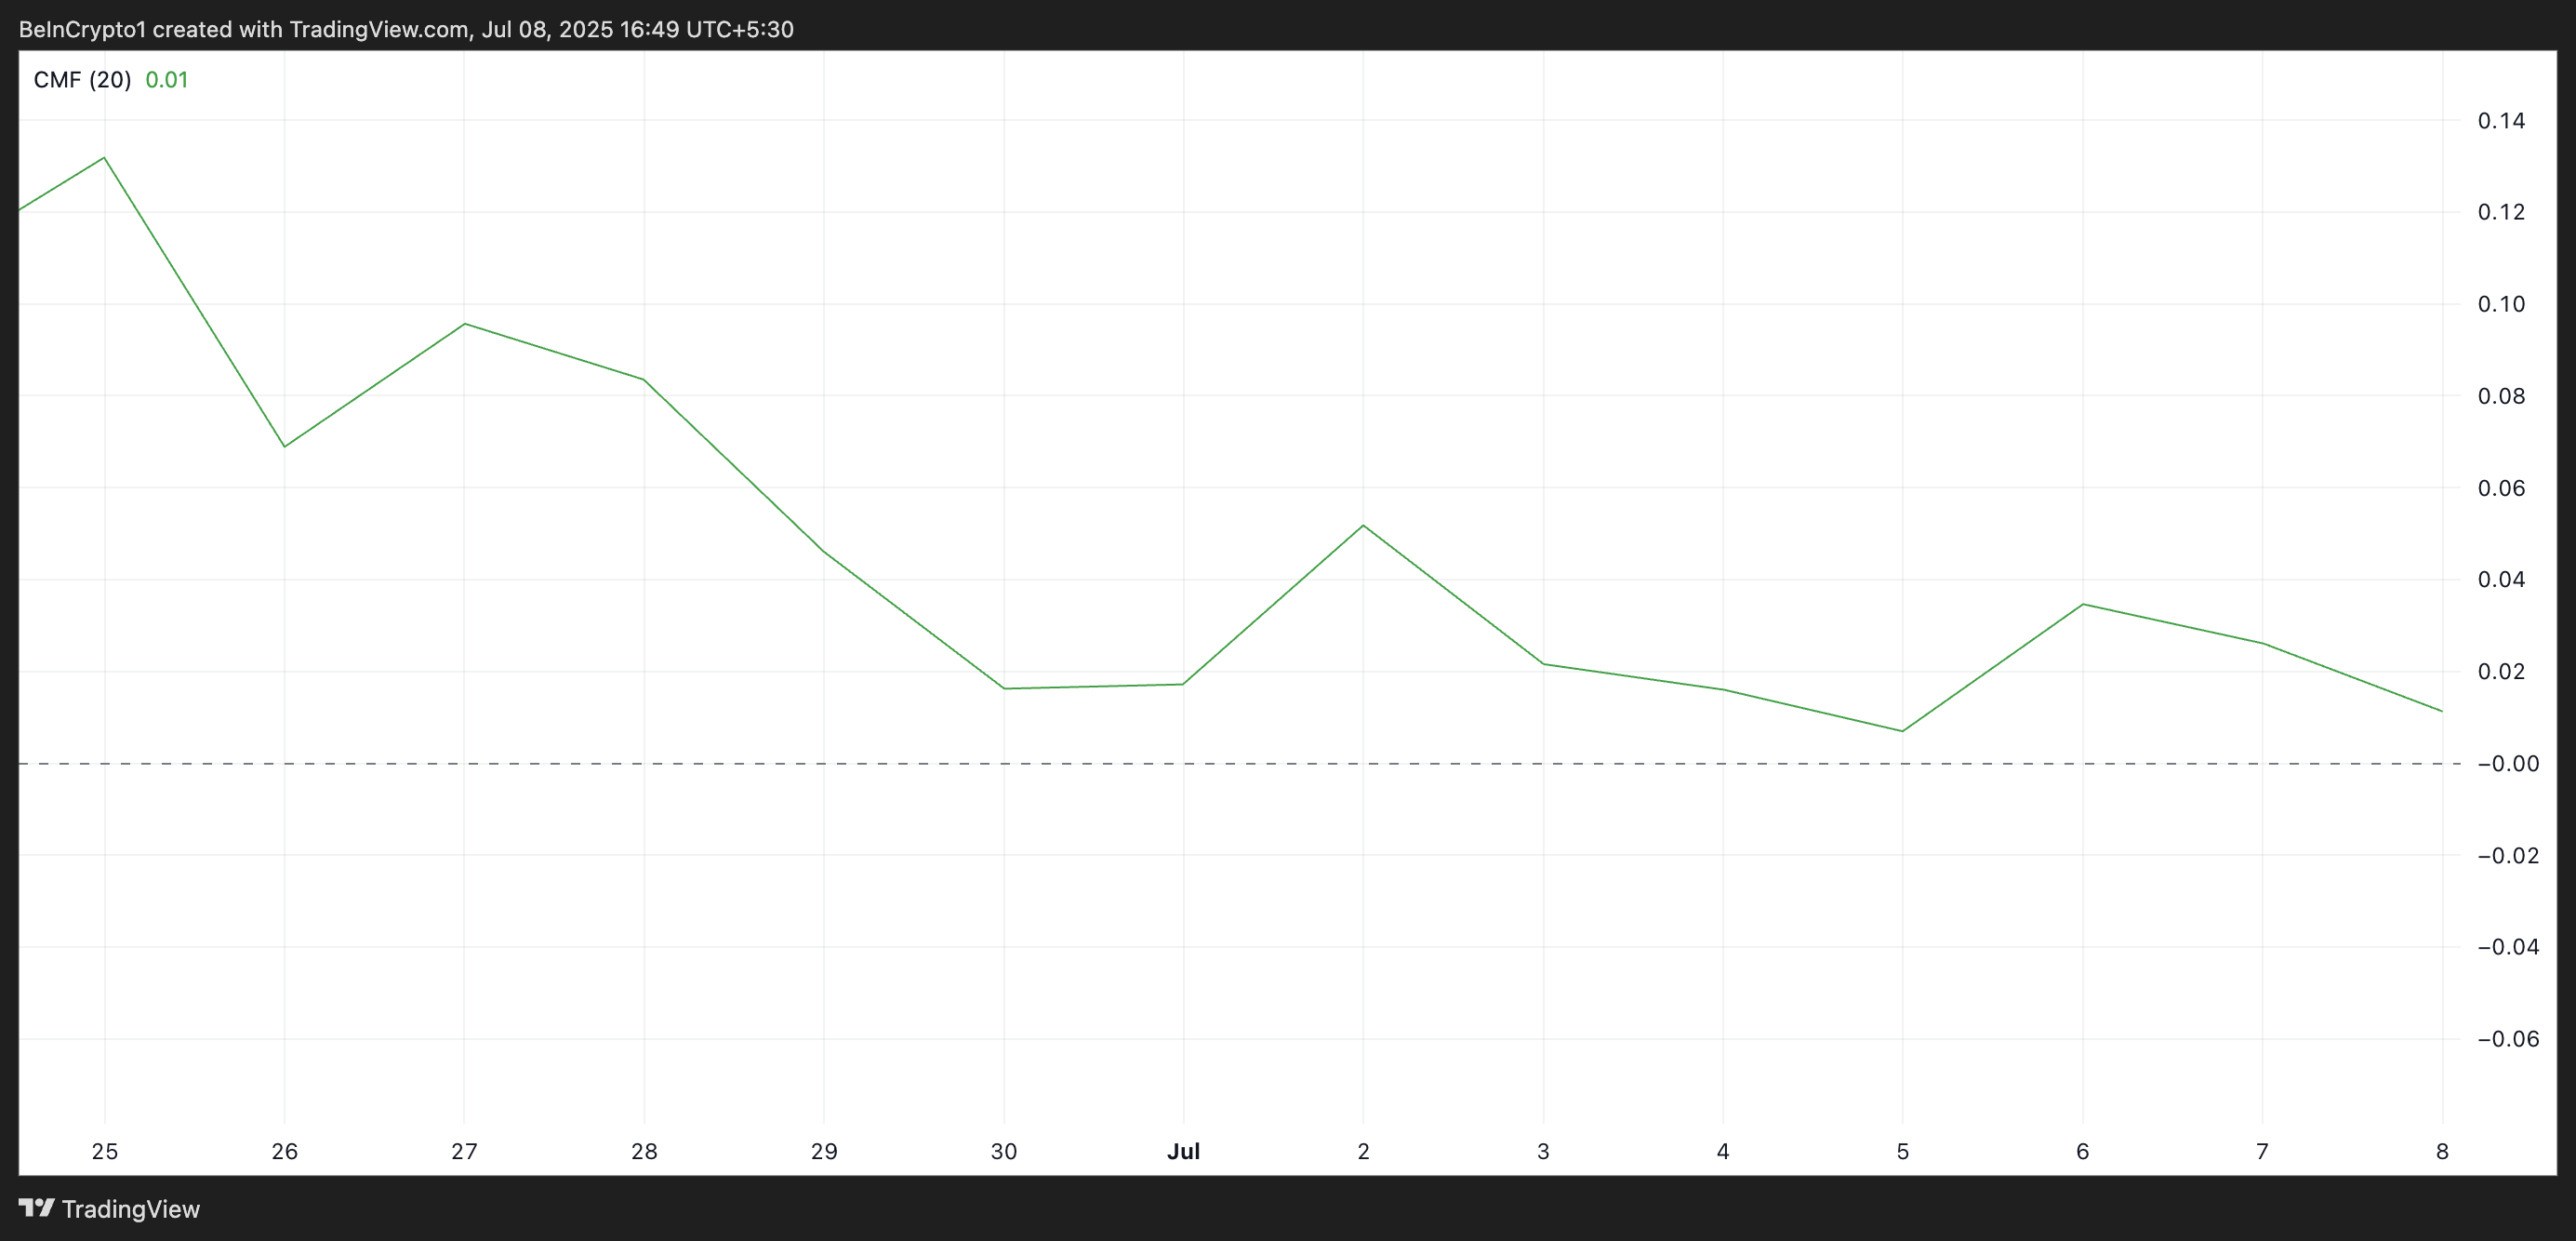
While XRP’s CMF has yet to fall below the zero line, its continued decline signals weakening accumulation. This trend often precedes a bearish reversal, and in XRP’s case, that outcome appears likely unless fresh demand enters the market to absorb the growing supply.
Losing This Support Could Spark a Drop to $2.14
On the daily chart, XRP is retesting the lower line of the ascending channel it has trended within over the past week.
This channel is formed when an asset’s price consistently makes higher highs and higher lows within two upward-sloping, parallel trendlines. The upper line acts as dynamic resistance, while the lower line serves as dynamic support.
Therefore, when the price begins to test the lower boundary, especially after a strong rally, it often signals exhaustion in upward momentum.
A decisive break below this lower support line is considered a bearish signal, as it suggests that buyers can no longer hold the trend. If this happens, XRP risks falling to $2.14.
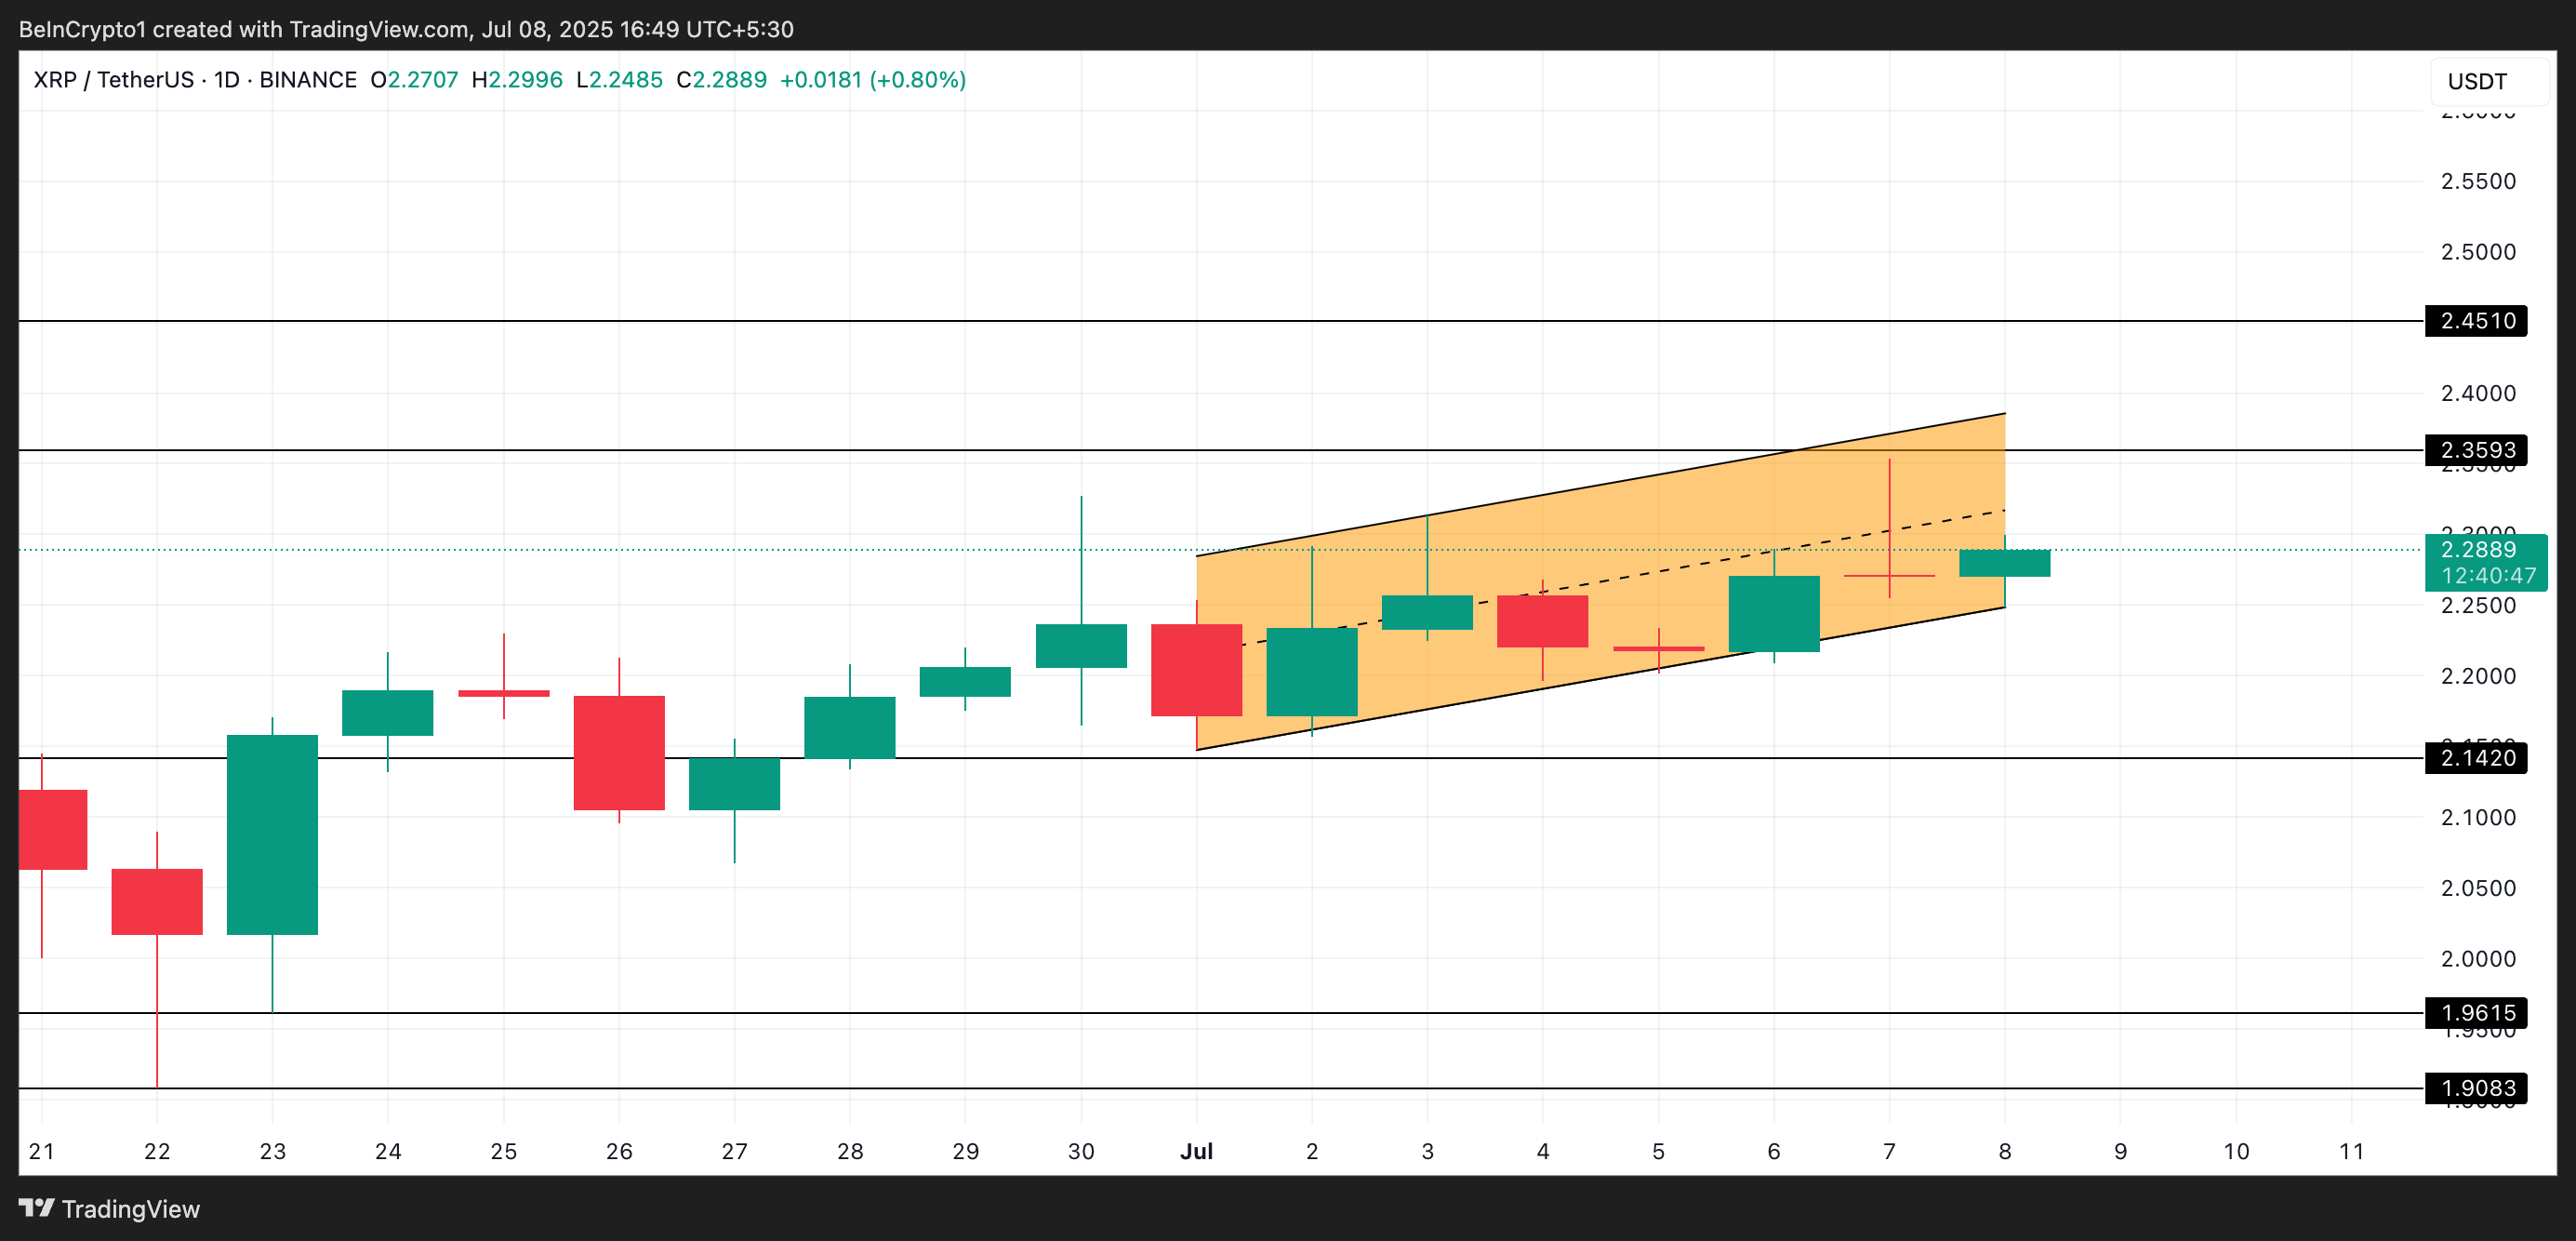
XRP Price Analysis. Source: TradingView
However, if the bulls regain control and demand climbs, they could drive XRP’s price to $2.35.
