Bitcoin at a Crossroads: Could $105,000 Be the Next Stop on This Wild Ride?

Bitcoin's bull run faces a critical test as analysts warn of a potential dip below $105,000—just when Wall Street thought it had crypto figured out.
Market jitters meet institutional FOMO
The king of crypto isn't immune to gravity. After months of relentless gains, Bitcoin's chart is flashing warning signs that even the most bullish traders can't ignore. Liquidity crunches in Asia and overleveraged positions suggest a correction might be brewing.
Whales vs. the little guy—again
While hedge funds scramble to hedge their exposure, retail investors face the age-old crypto dilemma: buy the dip or get wiped out? The $105,000 level could become ground zero for the next battle between paper hands and diamond-handed HODLers.
Remember: in crypto, the only certainty is volatility—and that your broker will still collect fees either way.
Bitcoin Sell-Side Pressure Mounts
According to CryptoQuant, BTC’s Apparent Demand has once again flipped negative. This signals that buyer activity is failing to keep pace with the growing supply being introduced into the market.
At press time, the metric, observed on a 30-day small moving average (SMA), stands at -36.98. The Apparent Demand metric measures the balance between new market demand and two key sources of supply: newly mined coins and those spent by LTHs who had been previously inactive.
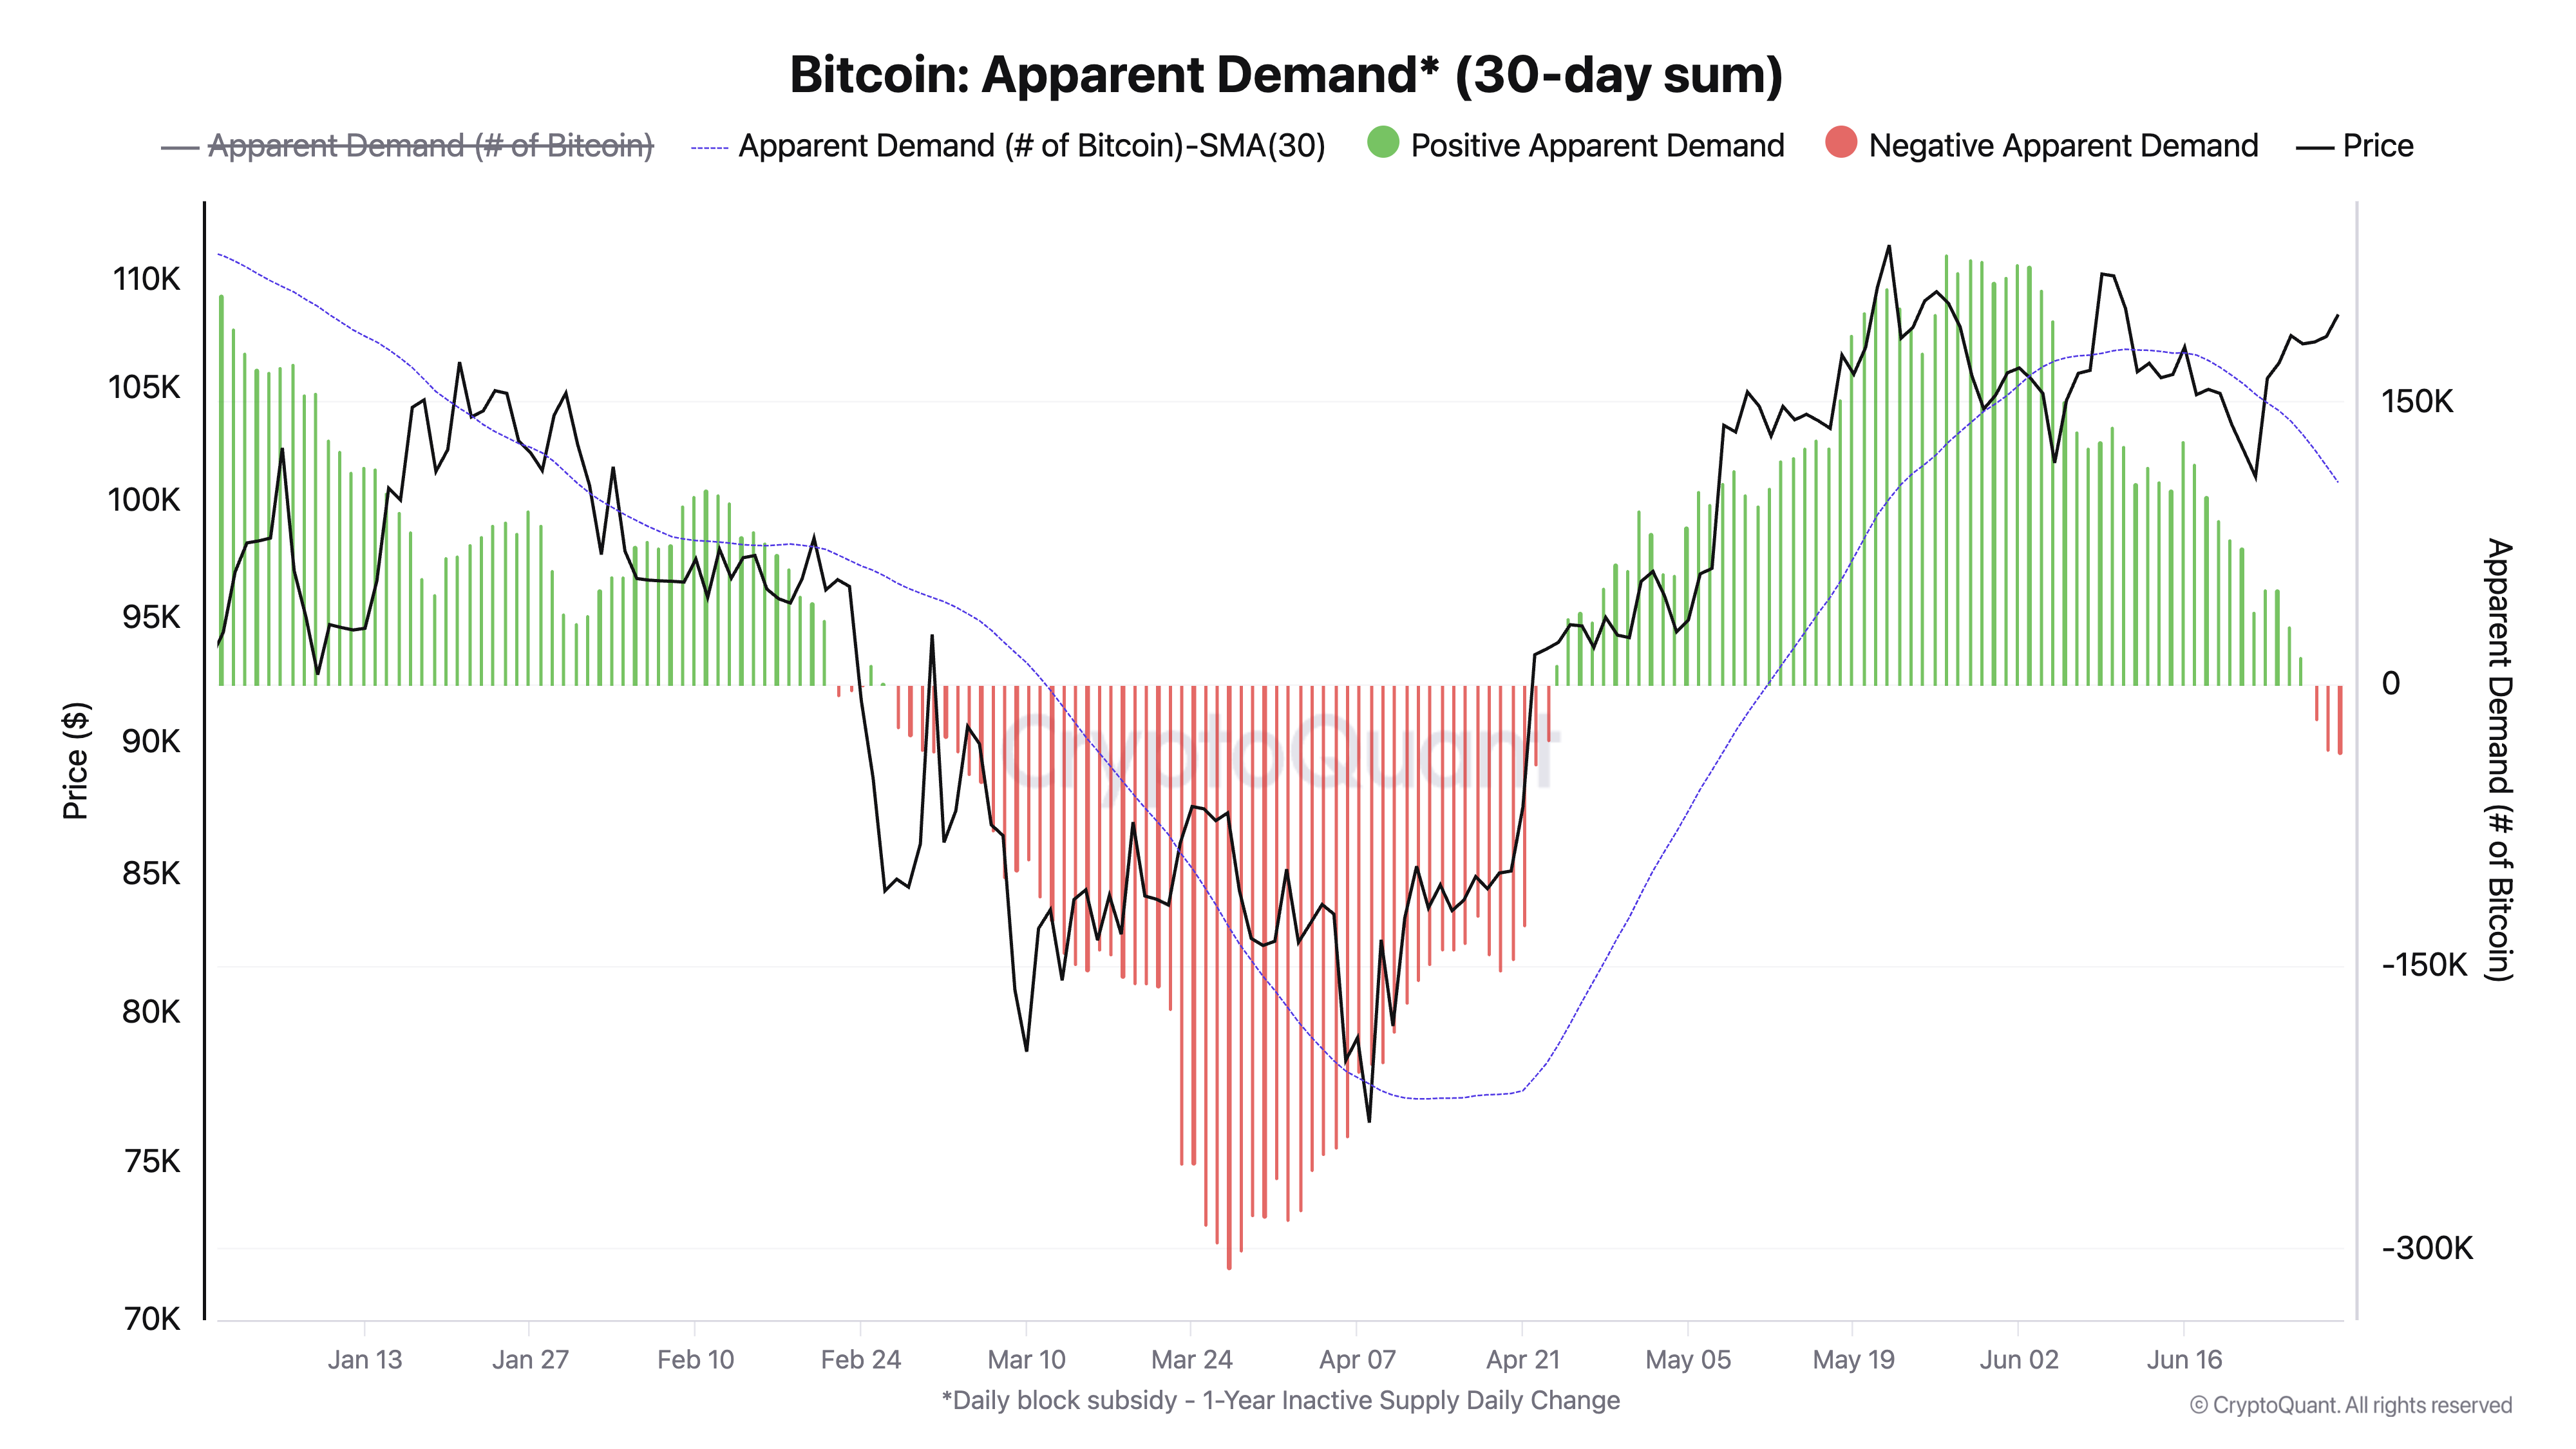
A negative reading like this indicates that the volume of BTCs entering the market now exceeds what new buyers can absorb. This shows the lingering market weakness stemming from the recent geopolitical tensions involving Israel, Iran, and the US, even as those tensions appear to be easing.
Furthermore, readings from BTC’s long/short ratio support this bearish outlook. At press time, the ratio is 0.96, indicating more traders are betting against the coin.
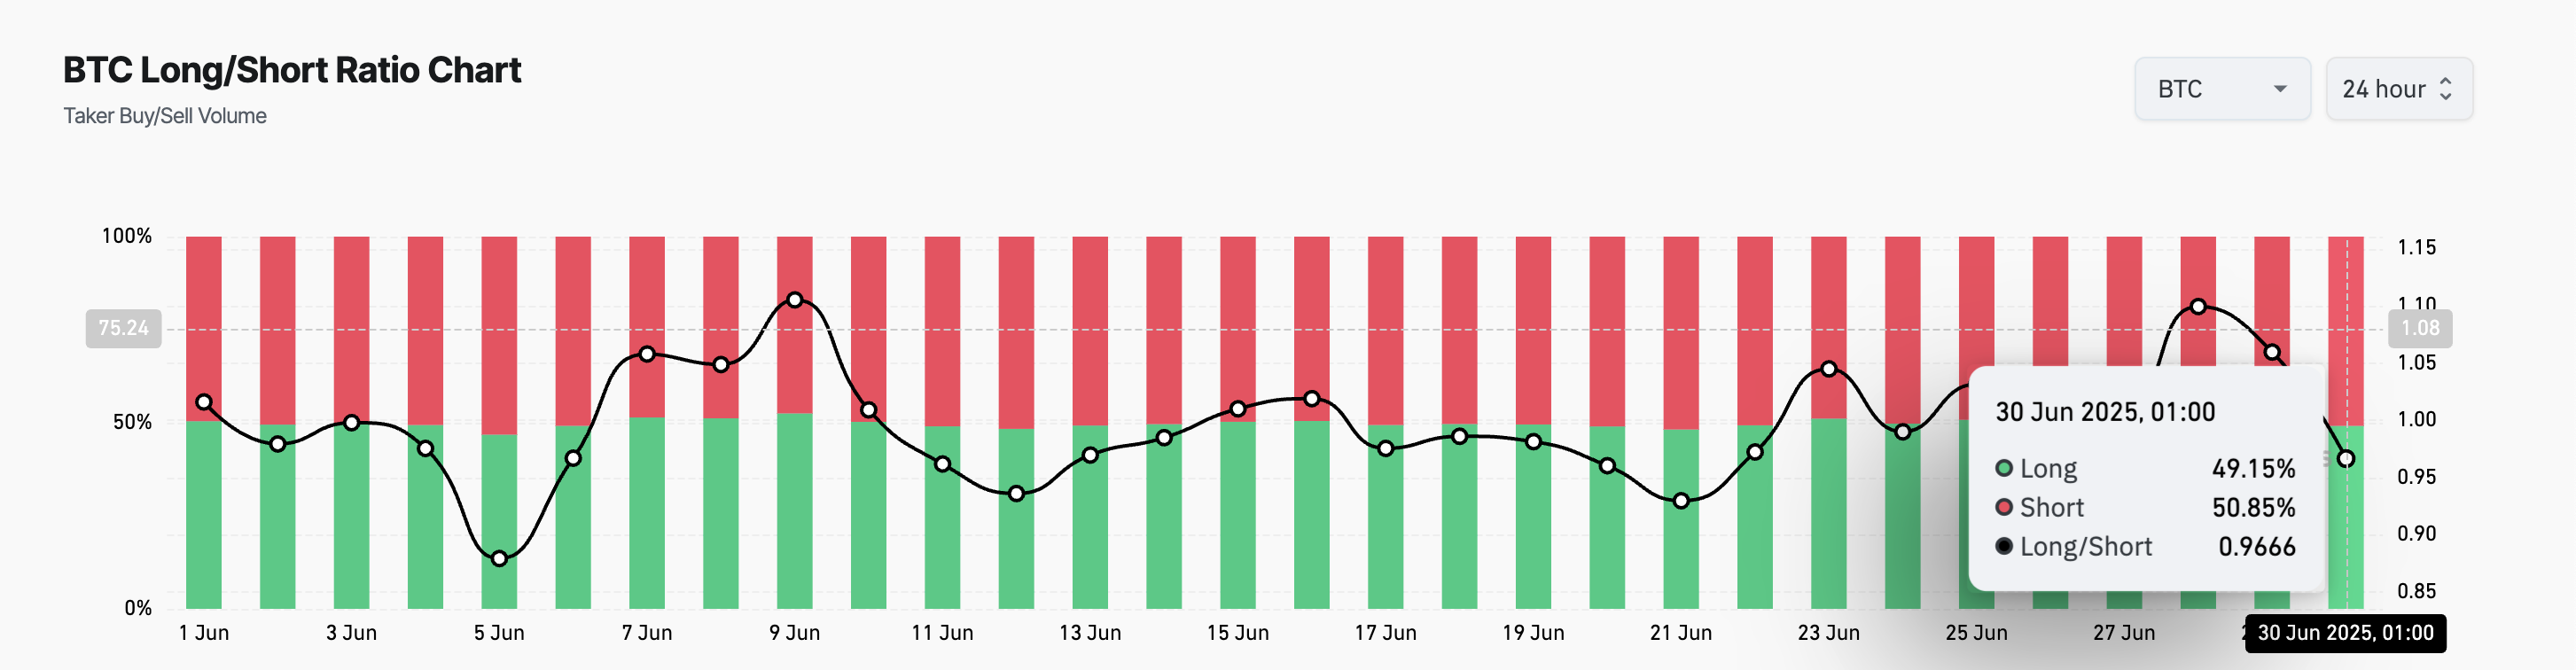
This ratio compares the number of long and short positions in a market. When an asset’s long/short ratio is above 1, there are more long than short positions, indicating that traders are predominantly betting on a price increase.
Conversely, as with BTC, a ratio below one indicates that most traders are positioning for a price drop. This reflects heightened bearish sentiment and growing expectations of continued decline.
With short positions outnumbering longs among BTC holders, sentiment across derivatives markets mirrors the same demand scarcity reflected on-chain, confirming growing expectations of a potential price pullback.
Bitcoin Supply Surge Threatens Drop to $105,000
At press time, BTC trades at $108,102. If buyers fail to absorb the climbing wave of supply, the coin’s price could struggle to hold above this price level and risk retesting the $107,745 support zone.
Should this level fail to hold, BTC could fall below $105,000 to trade at $104,709.
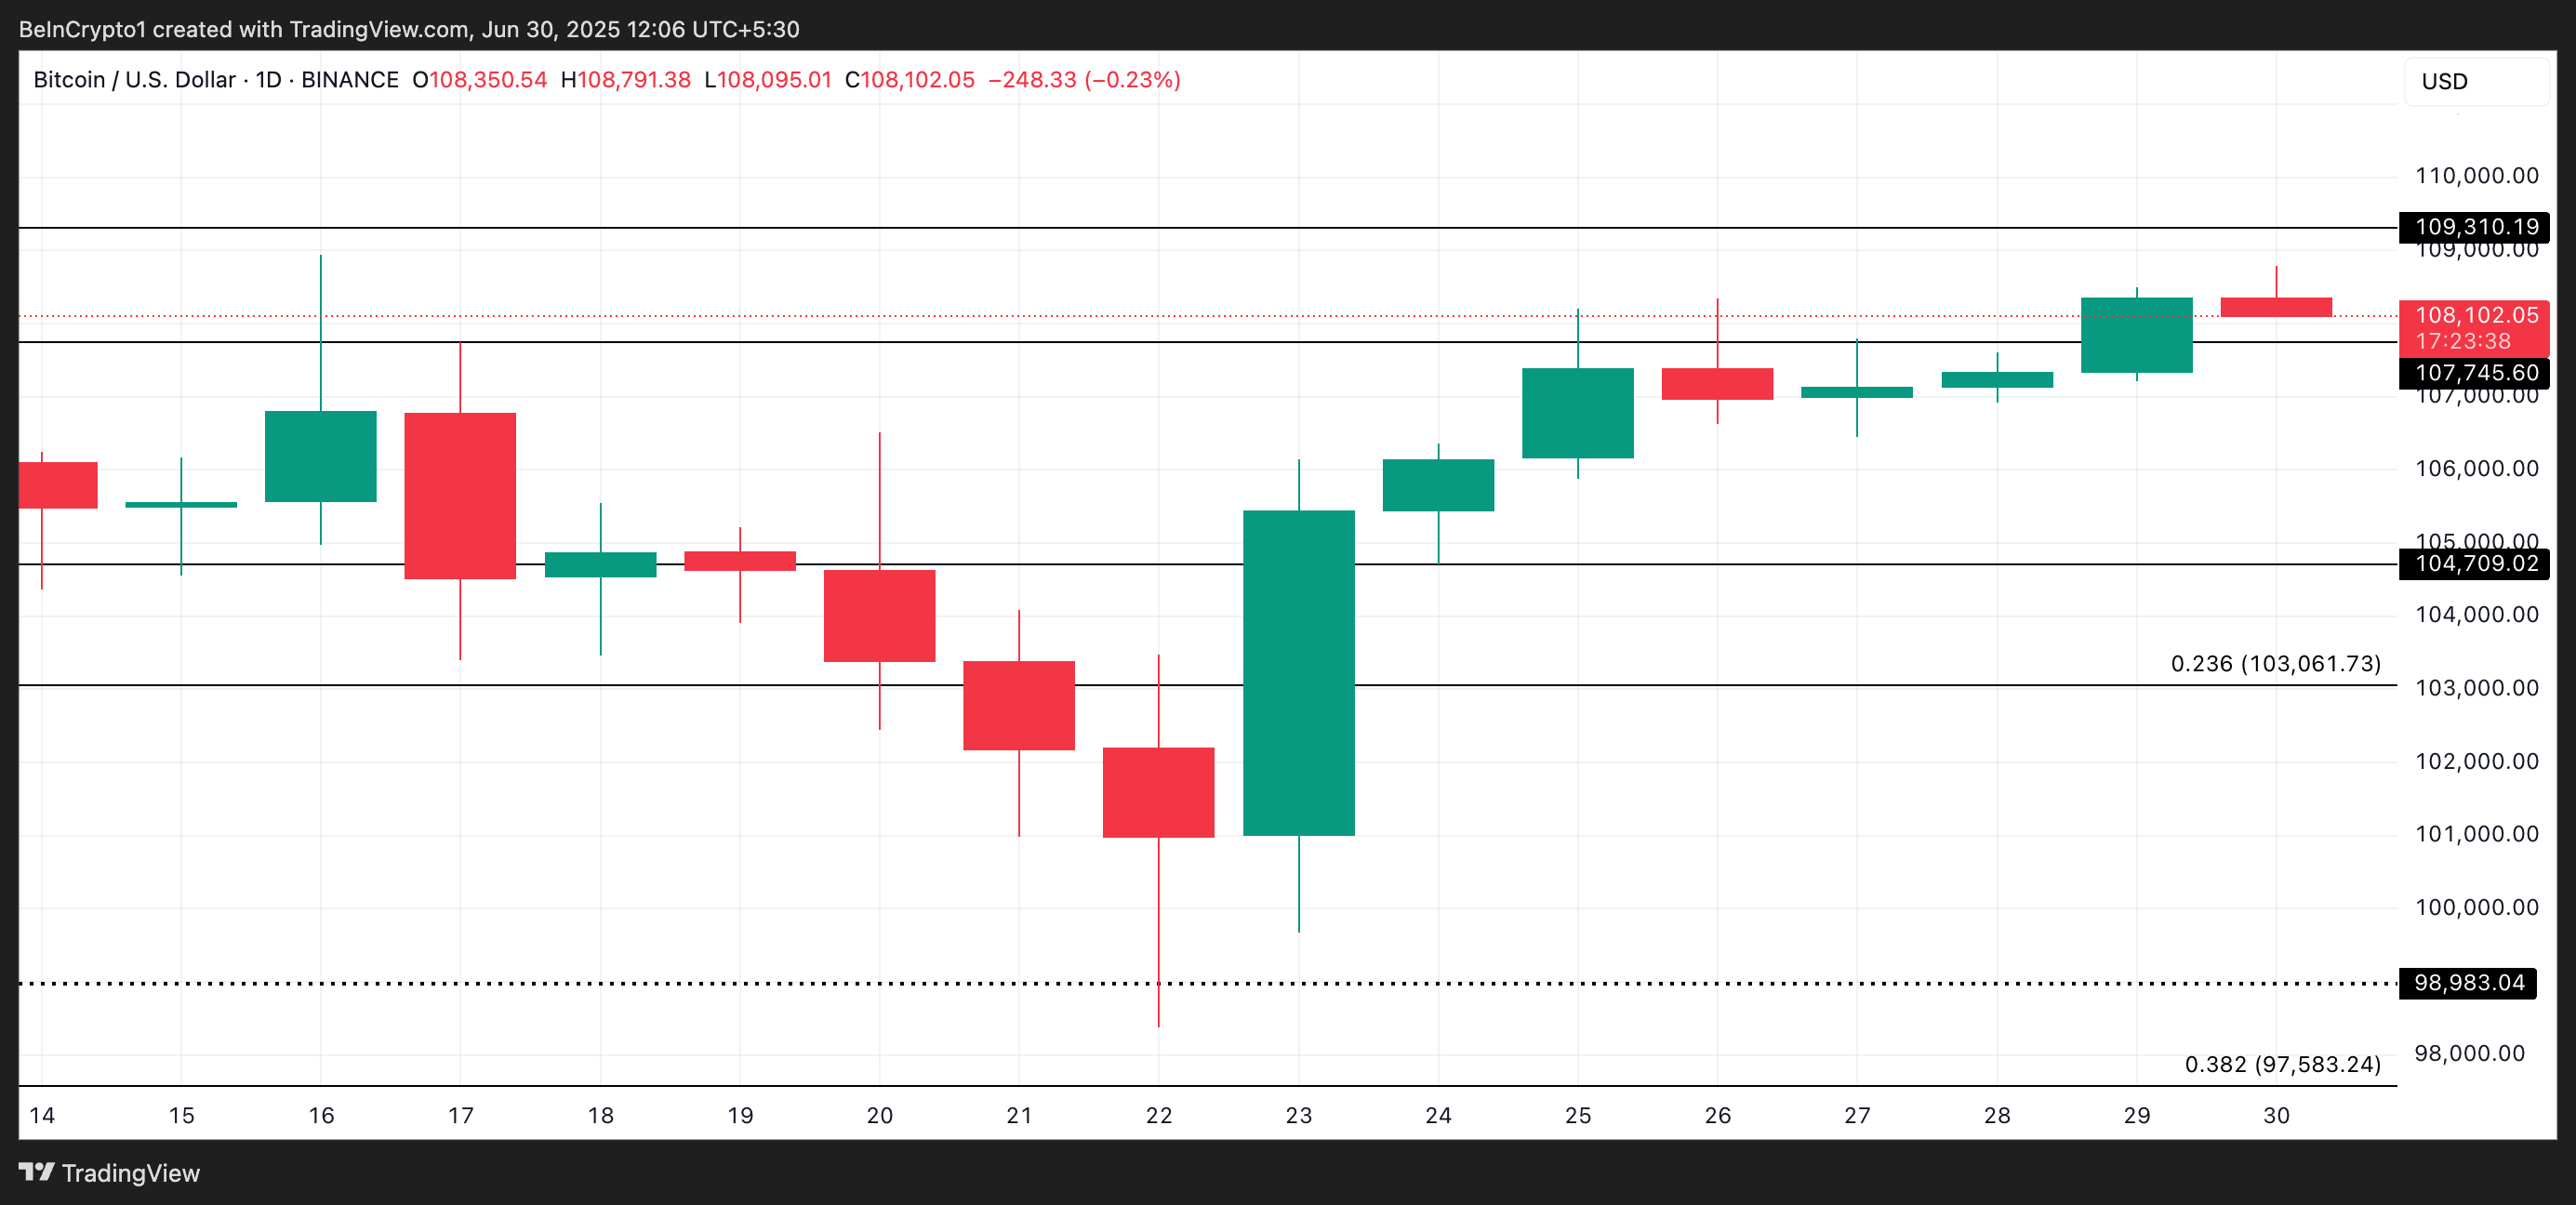
However, a resurgence in demand could prevent further losses. In that scenario, BTC may rebound, break above the $109,304 resistance level, and try to retest its all-time high at $111,917.
