Aptos Soars to 16-Day Peak as Historic Spot ETF Nears Approval – Is This the Next Crypto Breakout?

Aptos just punched through its highest price in over two weeks—and Wall Street might be fueling the rally. With the first-ever Aptos spot ETF now on the horizon, traders are piling in ahead of institutional demand.
The ETF Effect: More Than Just Hype?
Let’s be real—nothing juicies up a crypto chart like the mere whisper of an ETF. Aptos’ 16-day high coincides with regulatory filings gaining traction, and the market’s betting big on mainstream money flooding in. Never mind that most traditional finance still can’t spell ‘blockchain’ correctly.
What’s Next for APT?
If this ETF clears final hurdles, Aptos joins the big leagues alongside Bitcoin and Ethereum. But remember kids—past performance is no guarantee of future gains (especially in crypto). Bulls are charging, but keep an eye on those liquidation levels.
One thing’s certain: the suits are coming. Whether that’s good for decentralization? Well… that’s another story.
APT Rallies Nearly 10% on ETF Momentum
APT’s price nearly 10% surge over the past 24 hours has propelled the token to a 16-day high, fueled by growing investor optimism. The rally comes as Bitwise submitted updated S-1 filings to the US SEC on Thursday for its proposed APT ETFs.
Bitwise originally filed for the Aptos ETF in March. The updated filings signal a continued commitment to bringing the fund to the market, sparking renewed demand for APT as traders bet on the potential for institutional inflows.
On the APT/USD daily chart, the coin’s positive Balance of Power (BoP) reflects the growing demand among spot market participants. As of this writing, this momentum indicator is at 0.67.
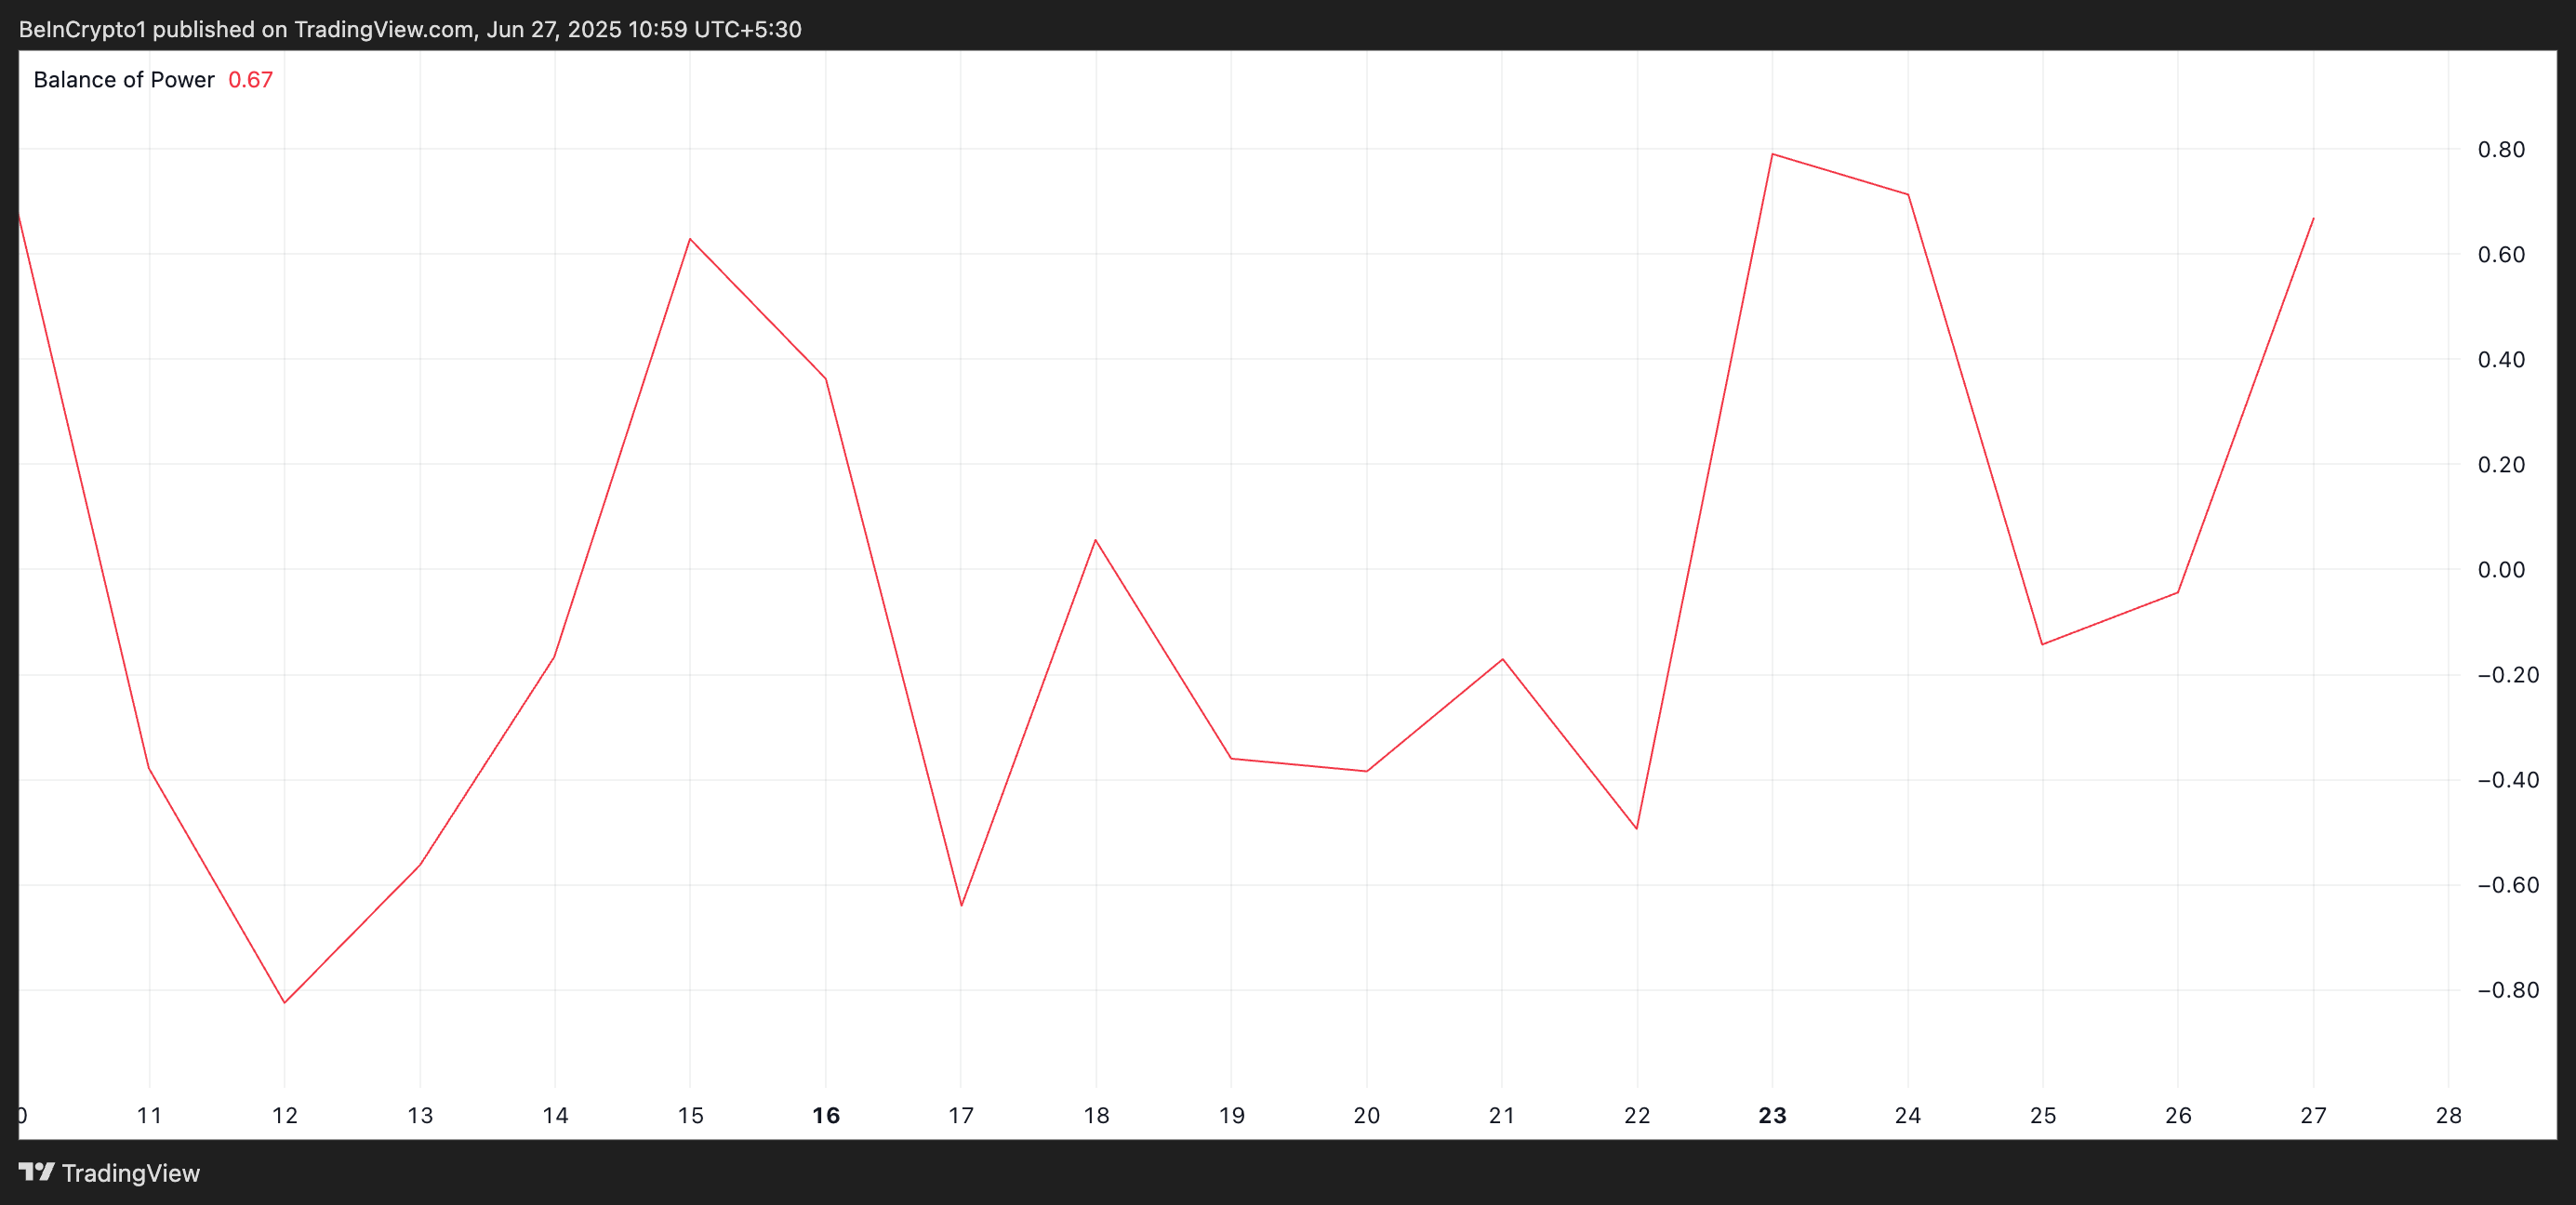
The BOP indicator measures the strength of buyers versus sellers by comparing the price range within a trading period. When BOP is positive, buyers dominate the market, suggesting upward pressure on the asset’s price.
Therefore, APT’s BoP signals strong buying pressure behind its price surge. This suggests that bulls are firmly in control as the coin attempts to extend its rally.
Furthermore, as of this writing, the altcoin rests solidly above its 20-day Exponential Moving Average (EMA), which forms dynamic support at $4.68.
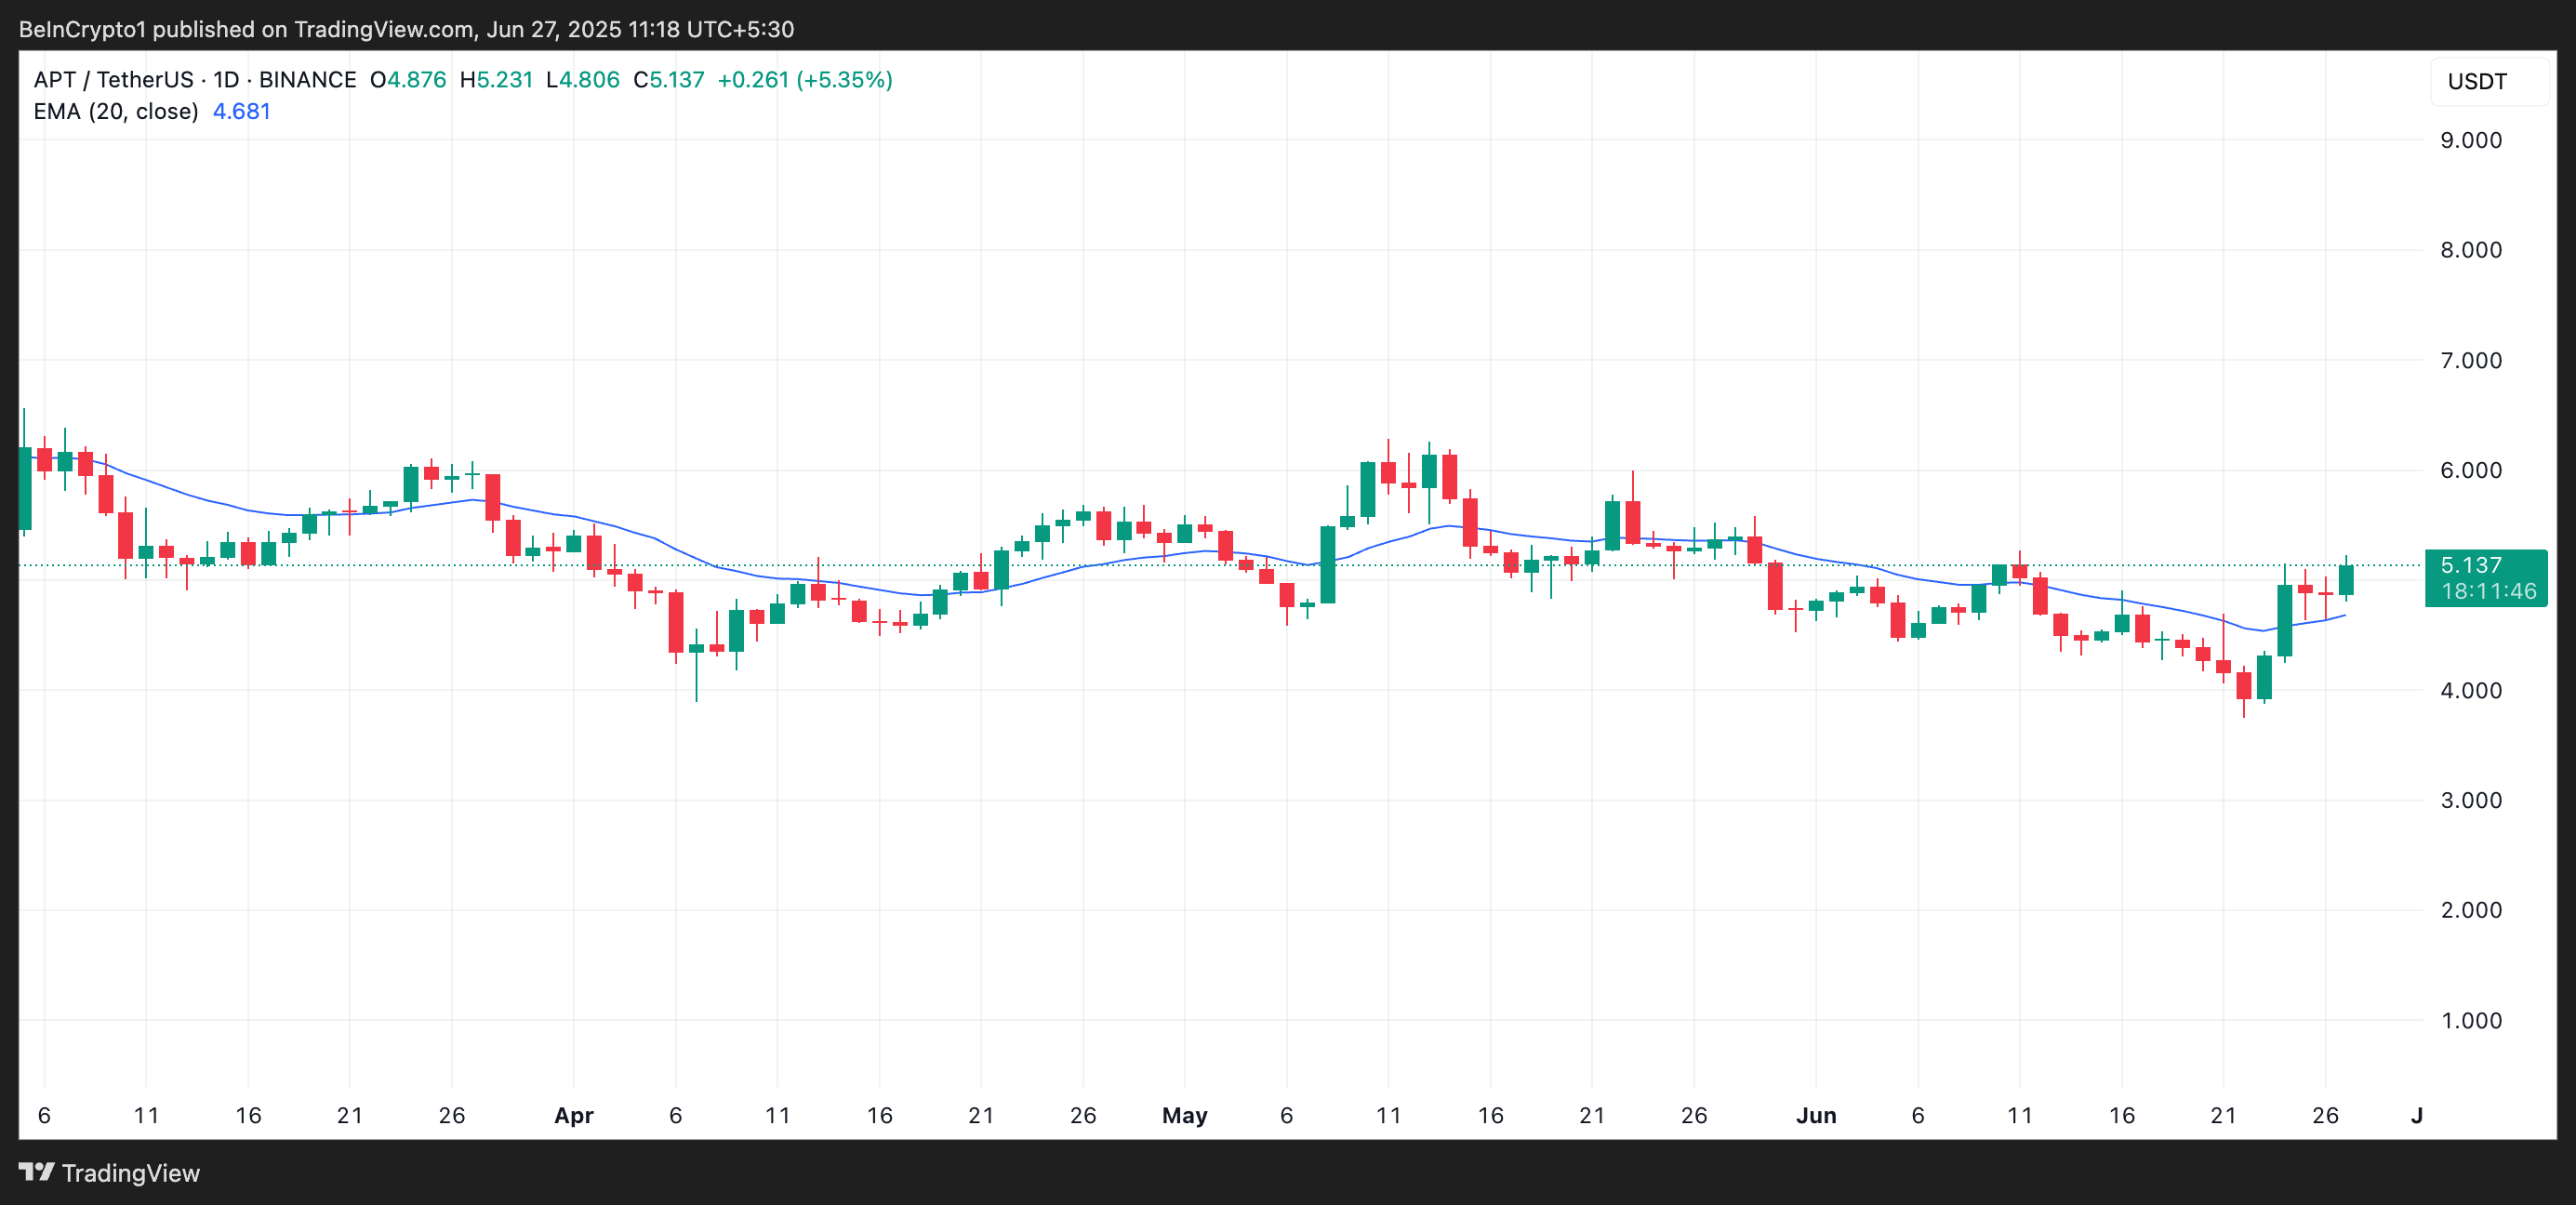
The 20-day EMA measures an asset’s average price over the past 20 trading days, giving weight to recent prices. When an asset’s price trades above the 20-day EMA, it signals short-term bullish momentum and suggests buyers are in control.
APT Holds Above Key Support
As the market awaits the regulator’s decision, the growing expectations that the ETF could attract institutional capital could drive more bullish gains for APT in the short term.
The coin’s 20-day EMA forms a strong support floor at $4.68, which could prevent sharp price dips below this level. This price level could propel APT toward $5.99, a high last seen in May.
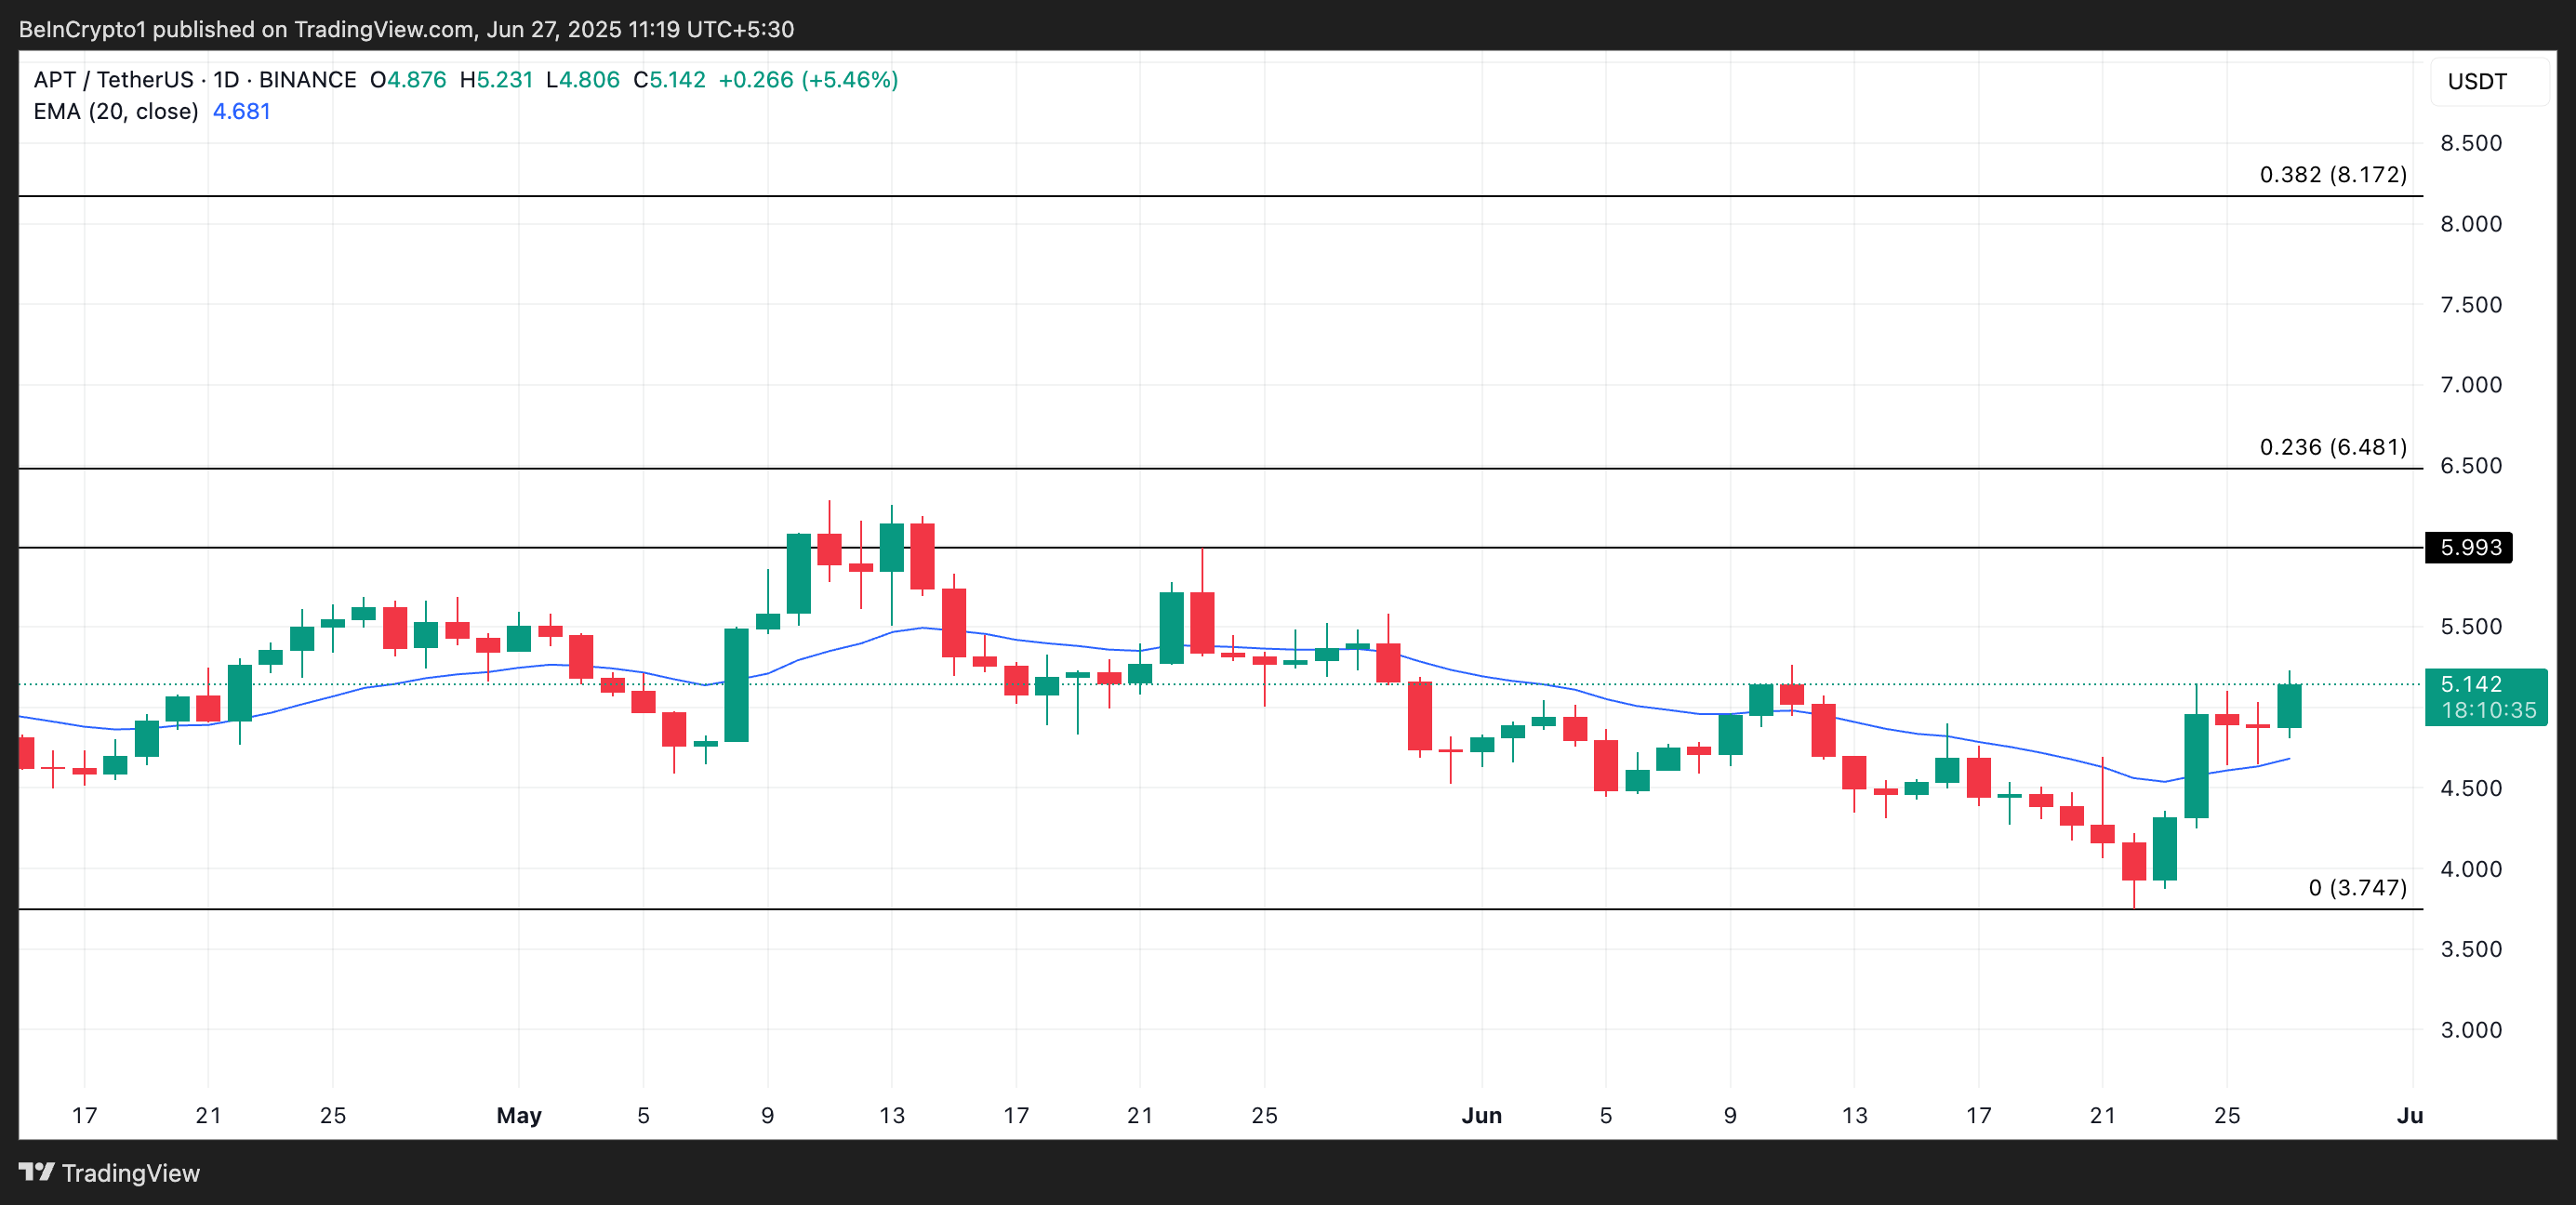
However, if demand stalls, APT’s price could break below its 20-day EMA and slide toward $3.74.
