Solana’s Comeback: Why Smart Money Is Flooding Back In

Solana’s Lazarus act is pulling hedge funds and whales off the sidelines—here’s the playbook.
### The Phoenix Chain Rises Again
Once left for dead after FTX’s collapse, SOL’s 300% rebound since January has institutional wallets accumulating. On-chain data shows smart money positions now at 18-month highs.
### Behind the Big Bets
Cheaper transactions than ETH, NFT volumes doubling monthly, and that sweet institutional FOMO—VCs can’t resist a redemption arc. Even after the 2022 ‘Sam Coin’ stigma.
### The Cynic’s Corner
Because nothing revives crypto enthusiasm like watching bankers ‘discover’ a blockchain they abandoned two years ago. Next up: a fresh round of ‘web3 infrastructure’ pitch decks.
Smart Money Backs Solana
The geopolitical relief, which began on Monday after the ceasefire was announced, has sparked renewed risk appetite, drawing smart money back into the SOL market. Readings from the SOL/USD one-day chart show a 1% uptick in the coin’s Smart-Money Index (SMI) since Monday’s announcement.
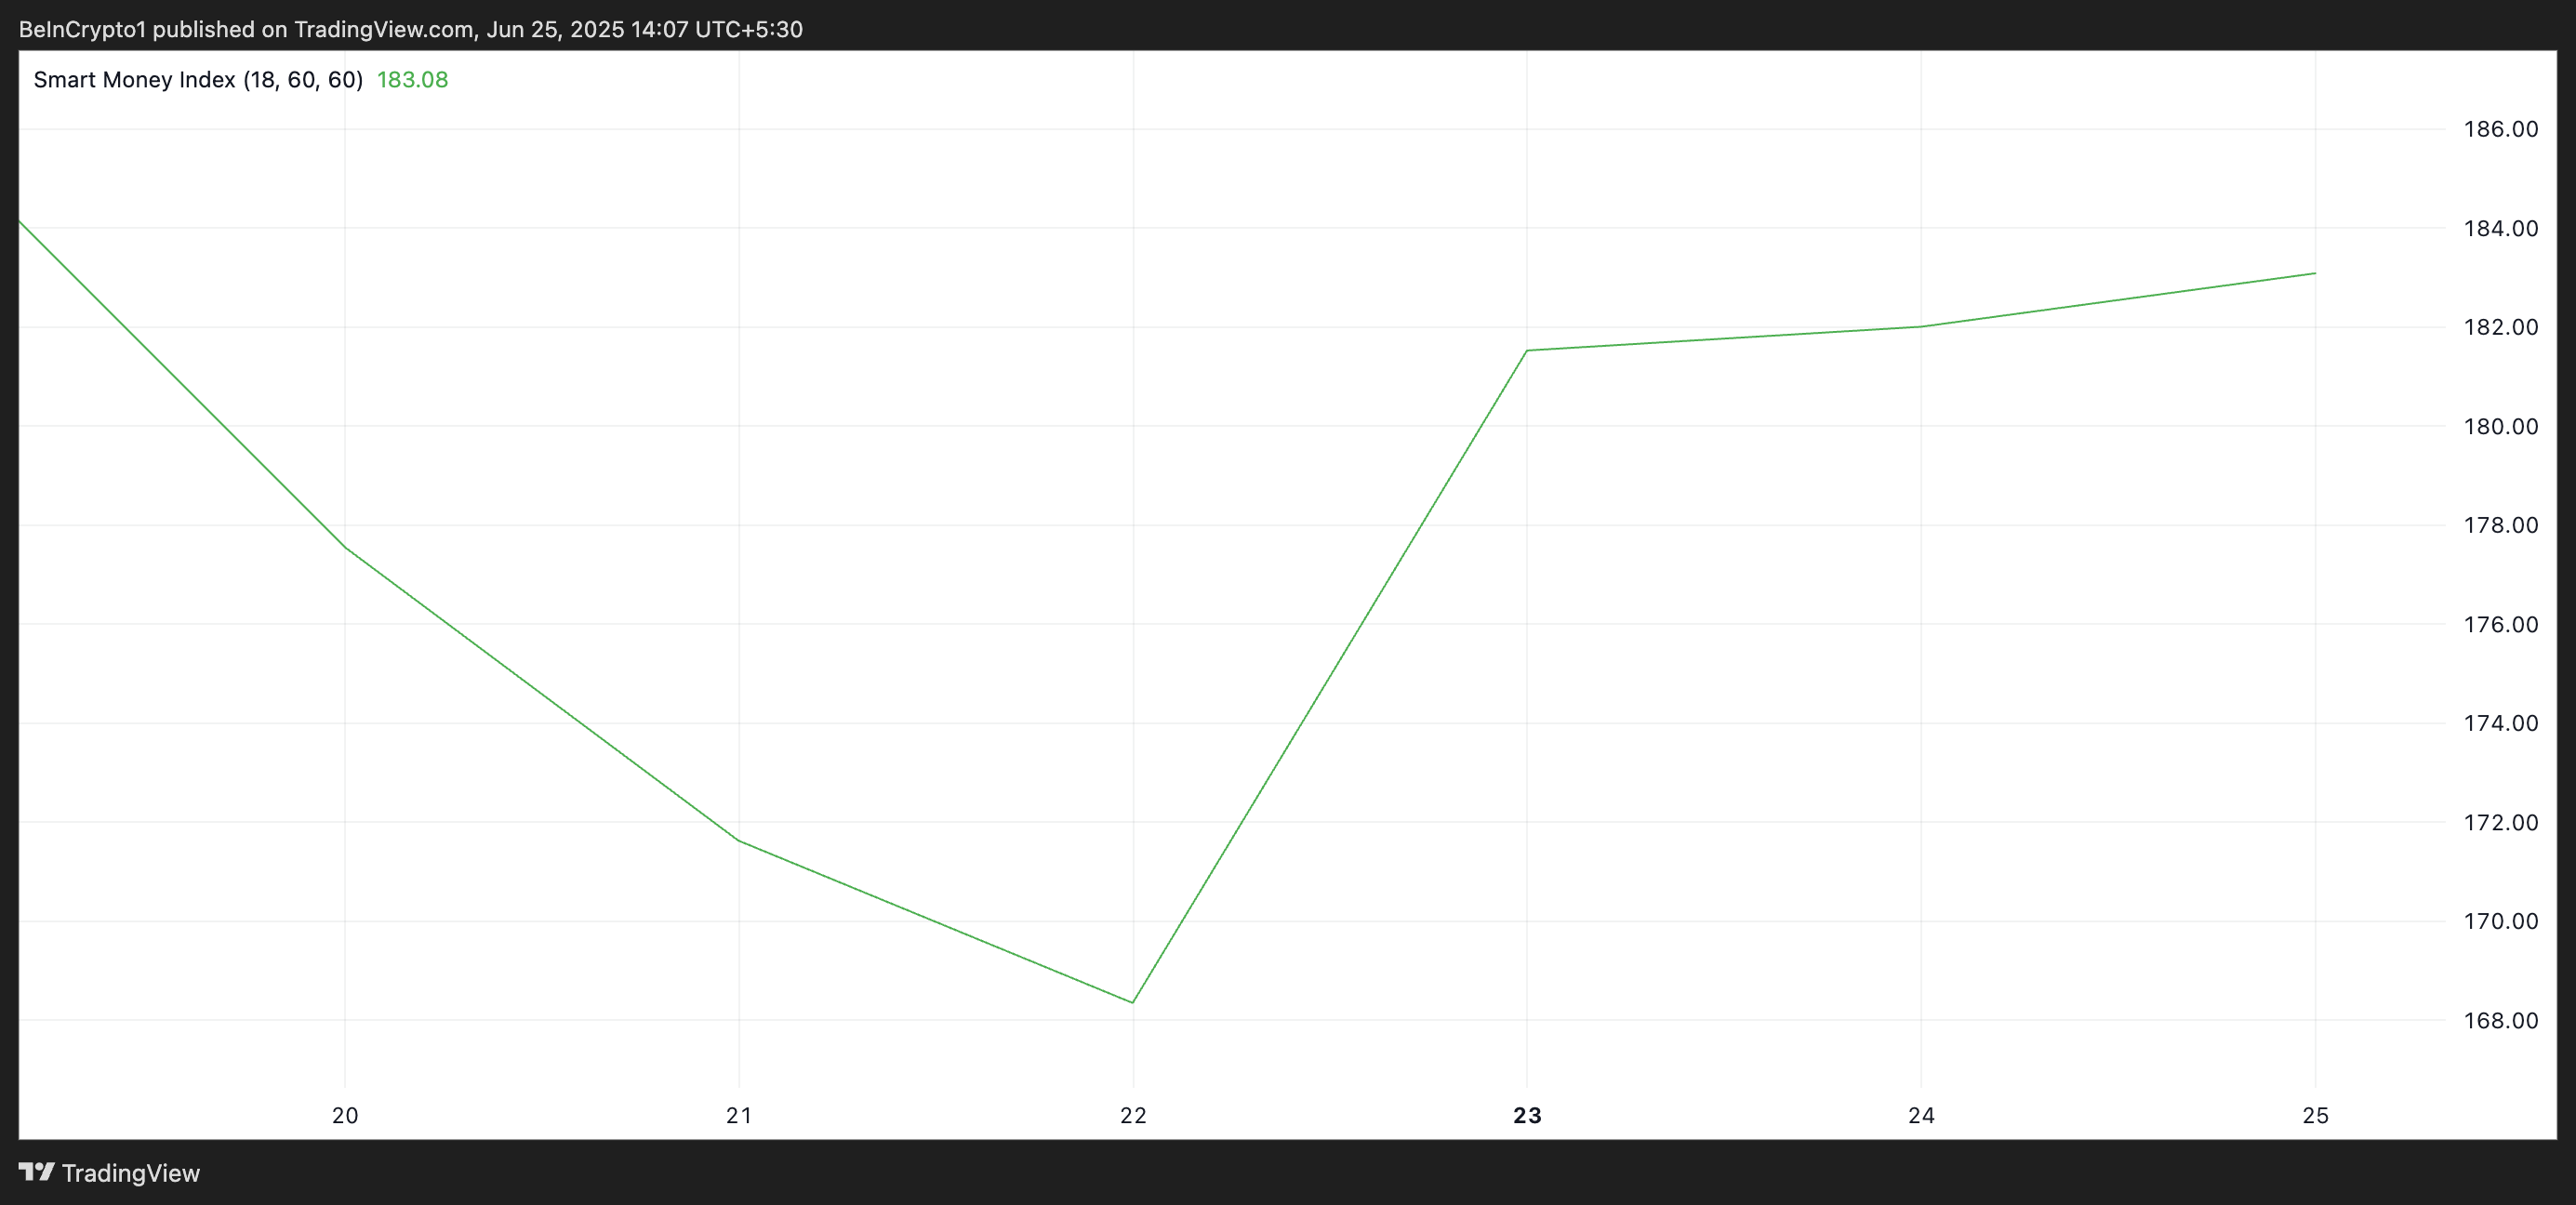
The SMI measures the activity of institutional investors by tracking price movements at specific times of the trading day. It reflects how “smart money” trades during the end-of-day sessions, after retail-driven volatility in the morning. When the SMI spikes, it signals increased confidence from institutional investors, often indicating a bullish outlook.
The gradual surge in SOL’s SMI suggests growing conviction among key investors as its price climbs. This trend indicates that institutional players are positioning for further upside as the coin rides the broader market recovery.
Moreover, SOL’s long/short ratio supports this bullish outlook. Per Coinglass, this is at 1.013, reflecting growing confidence among SOL futures traders.
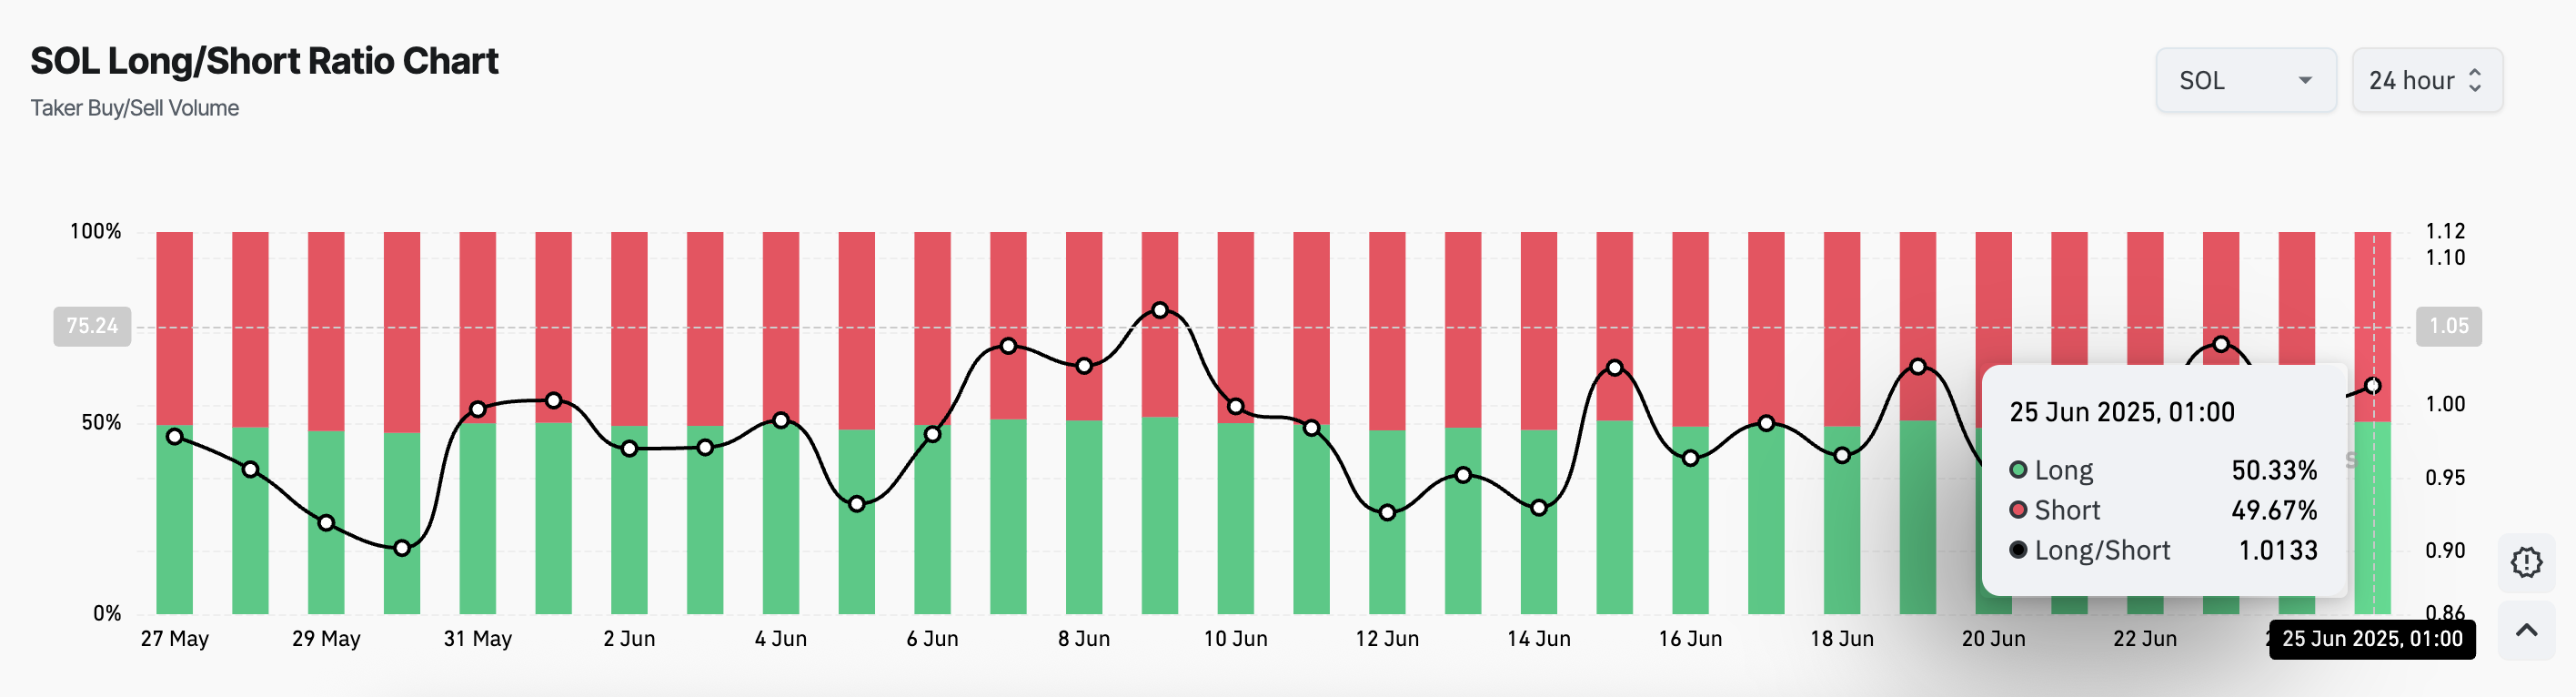
This ratio compares the number of long and short positions in a market. When an asset’s long/short ratio is above 1, there are more long than short positions, indicating that SOL traders are predominantly betting on a price increase.
Solana Battles Critical Resistance
With rising key holder interest and overall market momentum improving, SOL looks poised to extend its gains into July. A push toward the $150 level could be on the cards if the altcoin successfully breaks above the resistance at $148.81.
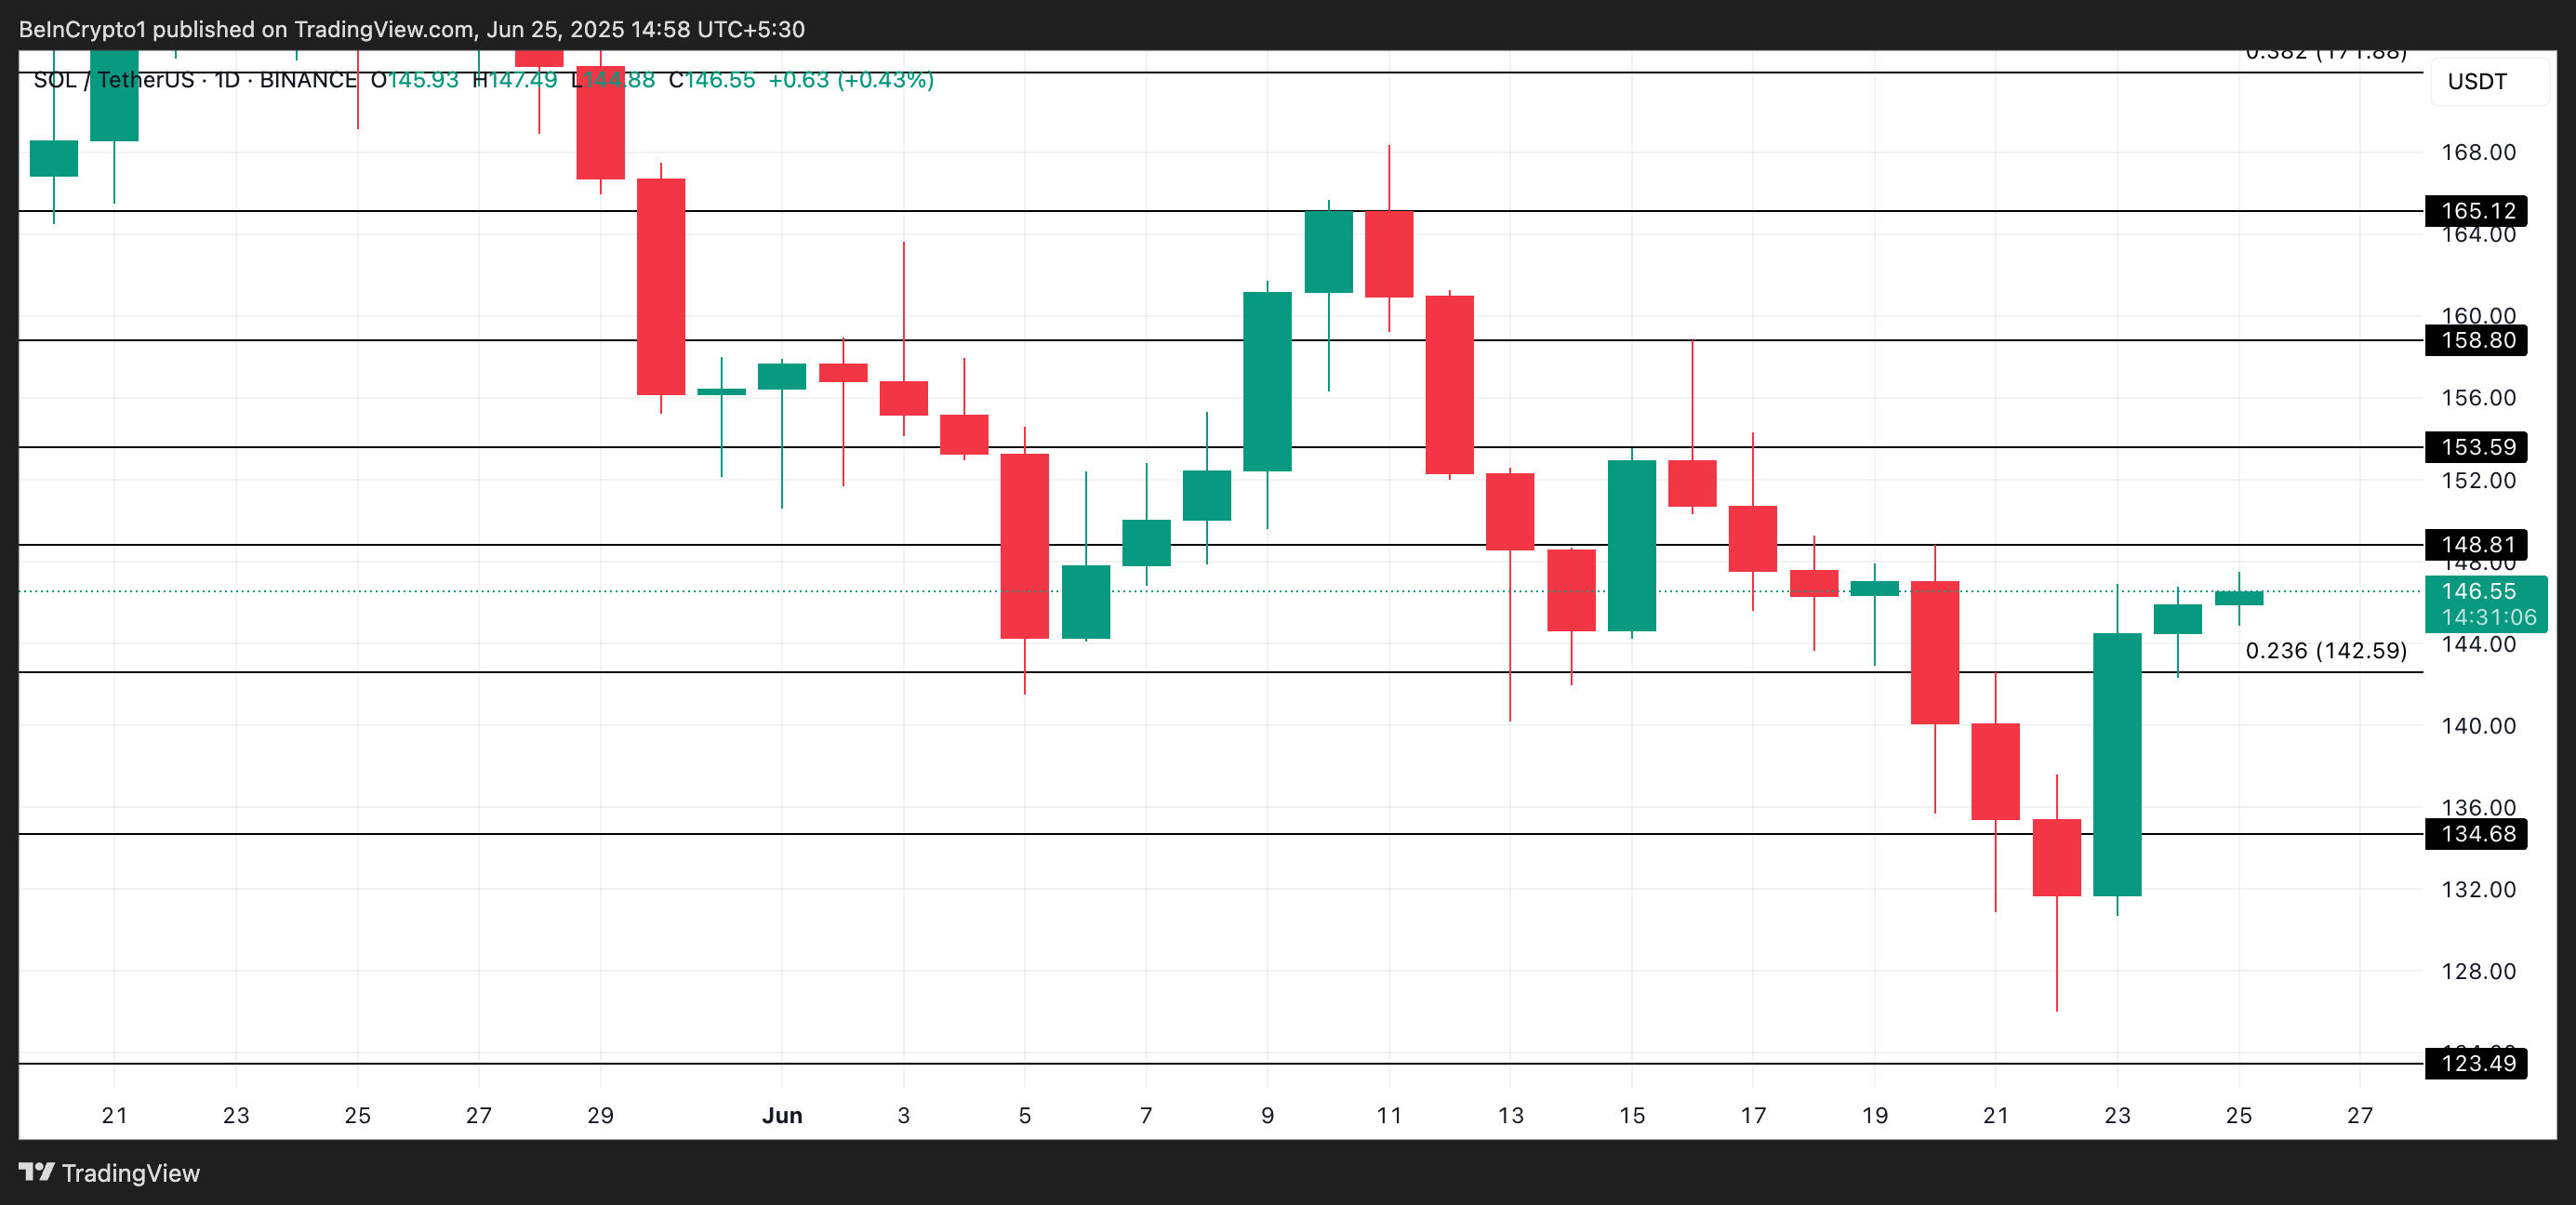
However, if demand stalls and SOL distribution recommences, the altcoin’s value could plunge to $142.59. If bearish pressure strengthens here, the coin’s value could dip further to $134.68.
