Shiba Inu Roars Back: Bullish Crossover Emerges After 16-Month Low—Time to Buy?

Shiba Inu just flashed its first bullish signal in over a year—and the memecoin crowd is losing its collective mind. After bottoming out at levels not seen since early 2024, SHIB’s technicals suggest a potential reversal. But is this the real deal or just another dead-cat bounce?
The setup: A golden cross formation—that holy grail of crypto traders—appears to be forming on the daily chart. For the uninitiated, that’s when the 50-day moving average punches through the 200-day. Textbook buy signal? Maybe. In crypto? Probably just another trap.
Why it matters: SHIB’s last major rally coincided with Bitcoin’s 2021 bull run. Now, with BTC testing new highs again, the ‘doge killer’ might be priming for round two. Or it might just be riding the coattails of a broader market pump—like that one hedge fund intern who takes credit for his team’s trades.
The bottom line: Memecoins move fast. Either catch the wave or watch from shore—just don’t cry when the ‘next big thing’ turns out to be the same old speculative casino with a dog-themed wrapper.
SHIB’s Bullish Crossover Signals Momentum Shift
On June 22, SHIB briefly cratered to its lowest price in 16 months, dragged down by a broader crypto market downturn. However, sentiment shifted quickly after news of a ceasefire agreement between Israel and Iran sparked a relief rally across the crypto market.
SHIB trades at $0.00001162 at press time, climbing 16% from Sunday’s multi-year low. Technical indicators now suggest that the meme coin may be gearing up to extend these gains as July approaches.
Most notably, the token’s Moving Average Convergence Divergence (MACD) has just flashed its first succesful bullish crossover in 39 days, signaling improving momentum. Readings from the indicator show its MACD line (blue) resting above the signal line (orange) for the first time in over a month.

The MACD indicator identifies trends and momentum in its price movement. It helps traders spot potential buy or sell signals through crossovers between the MACD and signal lines.
When the MACD line rests above the signal line, it indicates bullish momentum, suggesting climbing buying activity. Traders often see this setup as a buy signal, which could drive more demand into the meme coin.
Furthermore, in recent sessions, SHIB’s Chaikin Money FLOW (CMF) has climbed higher, indicating growing capital inflows and significant demand for the altcoin. As of this writing, this key momentum indicator is at 0.15 and climbing.
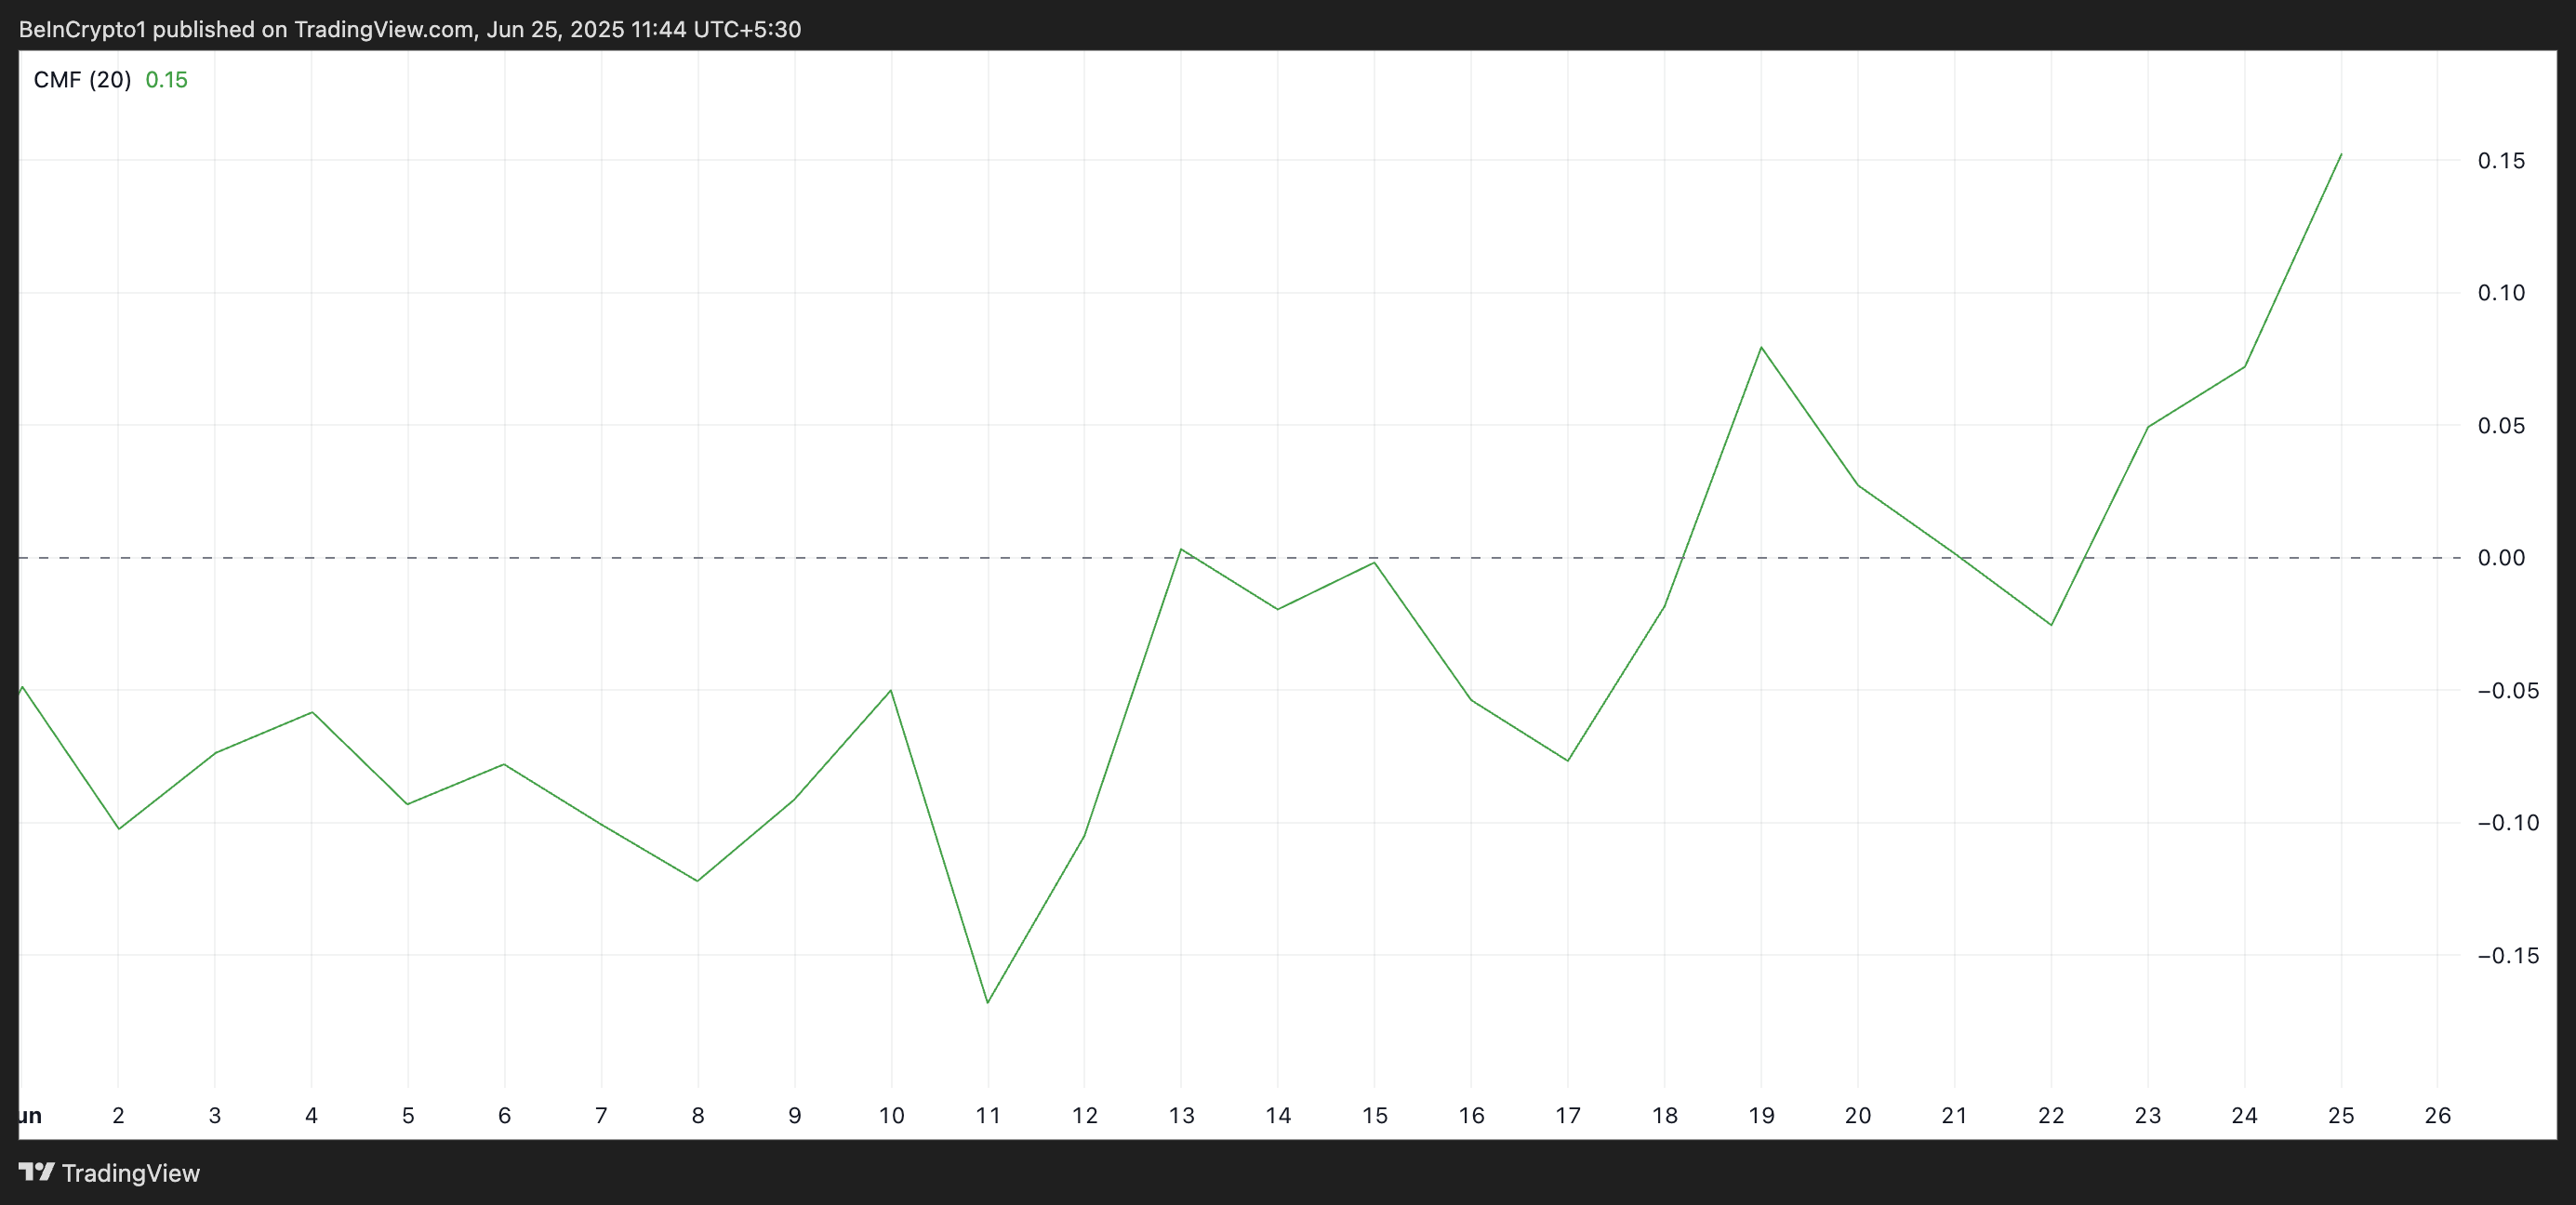
The CMF indicator measures how money flows into and out of an asset. A positive reading like this indicates that buying pressure outweighs selling pressure. It reflects strong capital inflows into SHIB, suggesting its investors are accumulating more positions.
Shiba Inu Eyes 17% Rally
This combination of improving market sentiment and bullish signals could set the stage for a continued rebound. If demand continues to soar, SHIB could rocket to $0.00001362, a 17% jump from its current value.
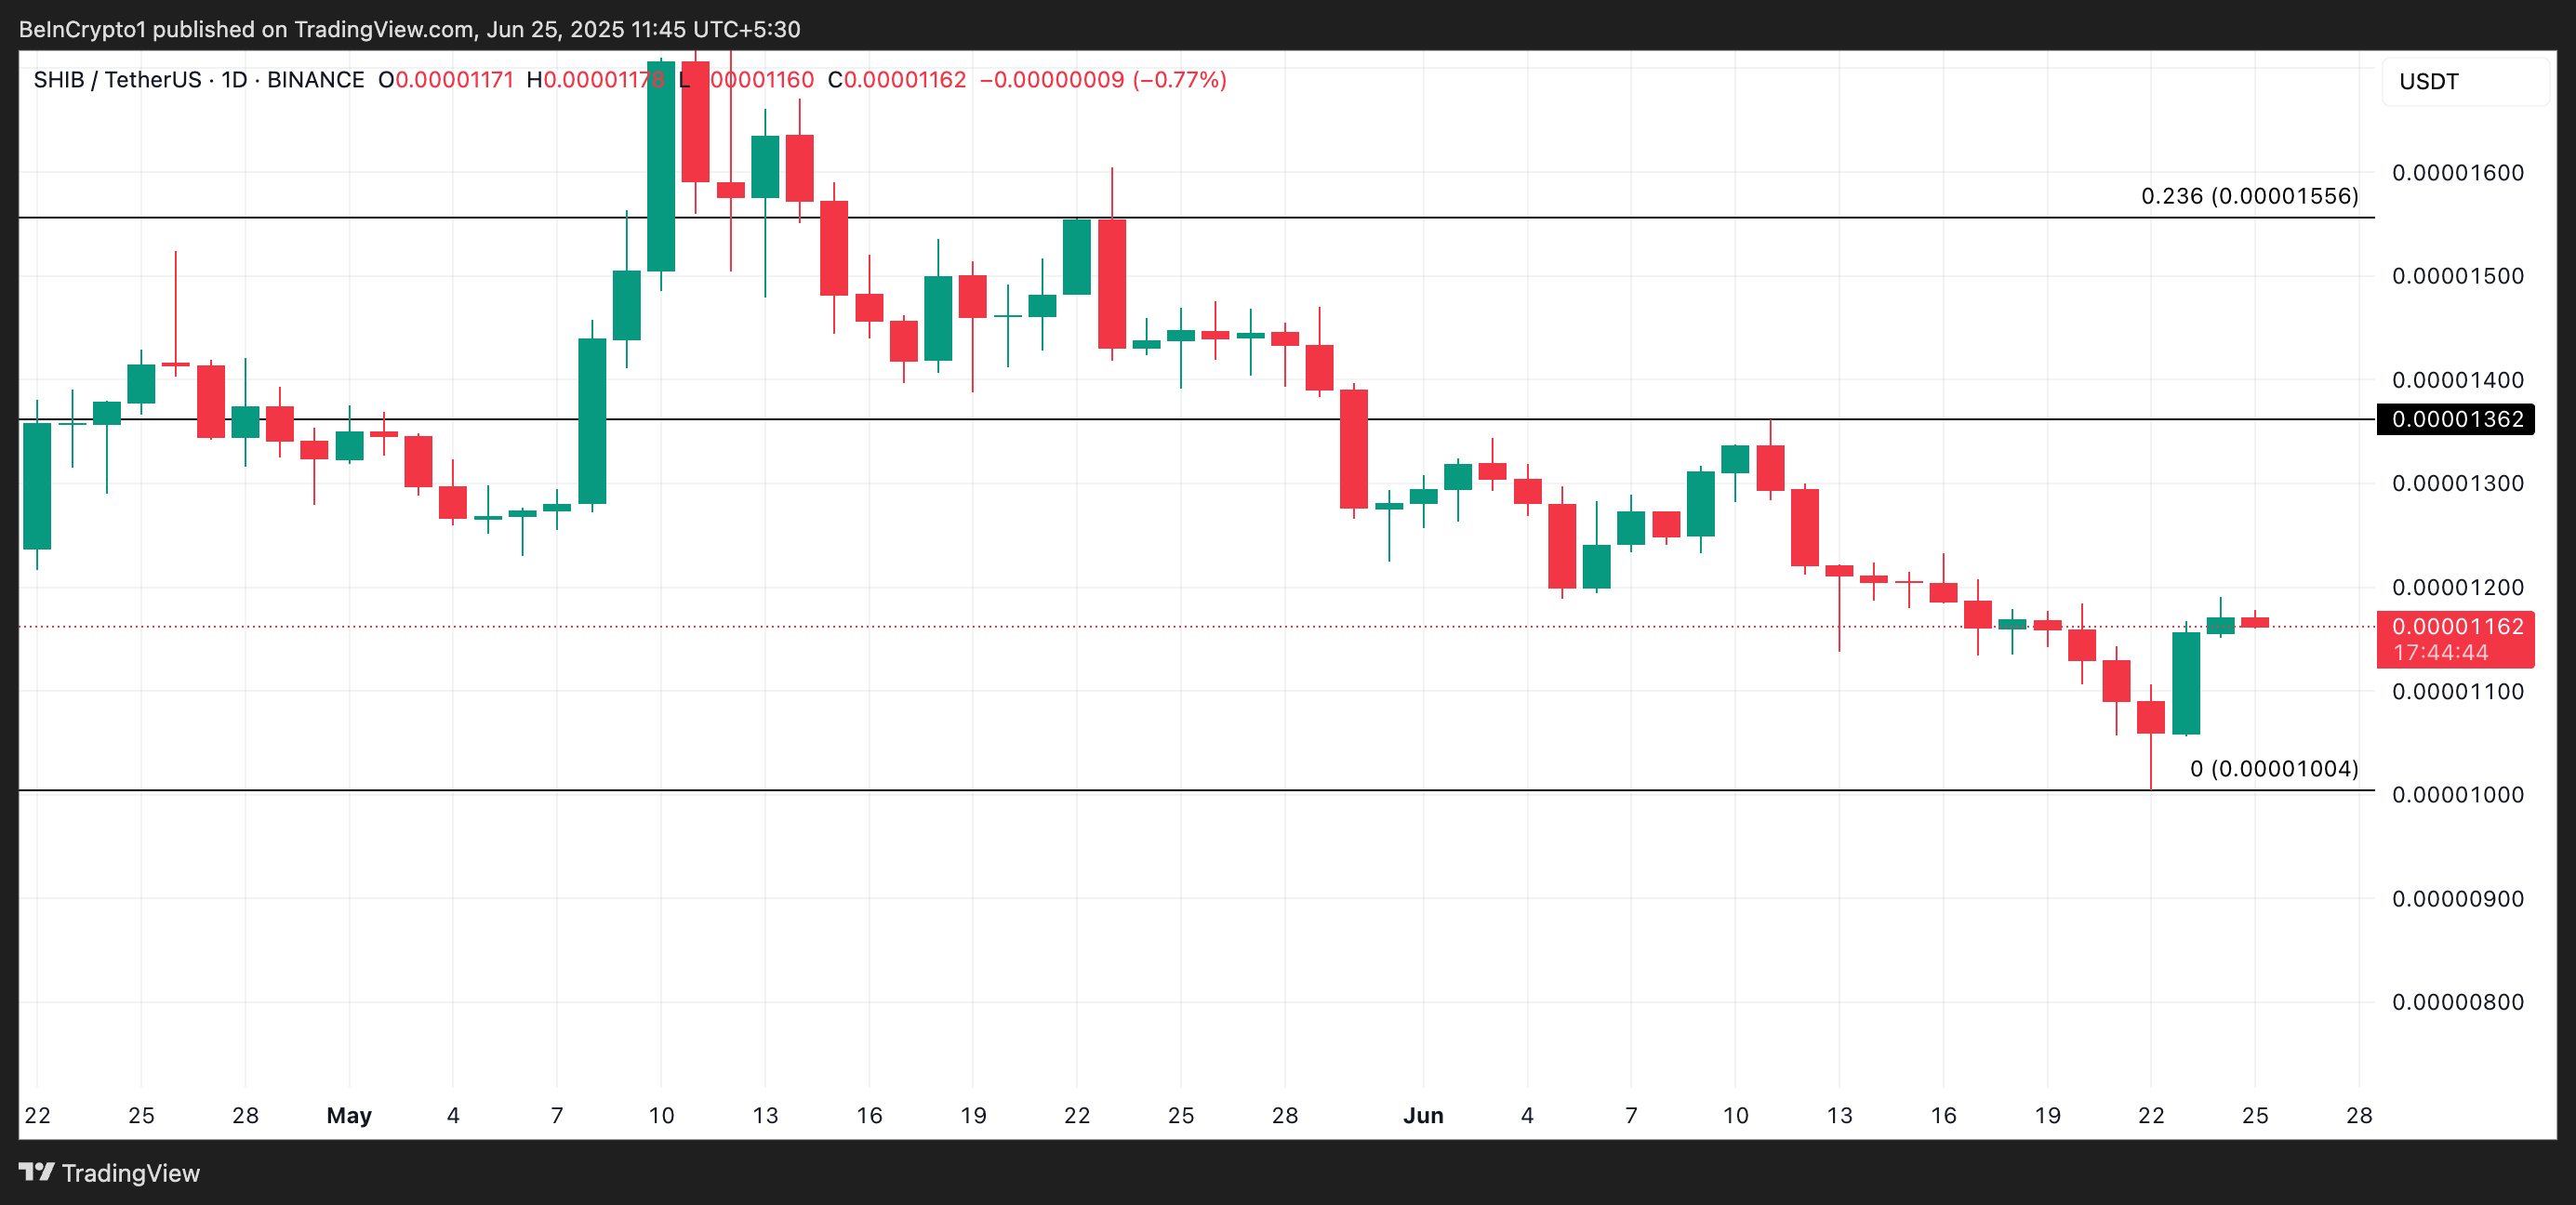
However, if profit-taking resumes and market sentiment flips bearish again, Shiba Inu’s price could dip toward the multi-year low of $0.00001004.

Log in to Reply
Log in to comment your thoughtsComments
Related Articles
|Square
Get the BTCC app to start your crypto journey
Get started today Scan to join our 100M+ users