Hedera on the Brink: Will It Shatter Its Two-Month Low?

Hedera's price action is flirting with danger—teetering on the edge of a breakdown that could send it plunging below a critical support level. Here's why traders are sweating.
### The Bearish Perfect Storm
Network activity dips, macro headwinds howl, and suddenly that two-month floor looks shaky. Even hashgraph's speed can't outrun market gravity.
### Liquidity Exodus Ahead?
Watch the order books. If retail bails while institutions stay sidelined, we might see that classic crypto combo: thin liquidity meets panic selling. (Cue the 'we told you so' from Bitcoin maxis.)
### Last Defense: The $0.08 Zone
A hold here could spark a relief rally. But break it? Prepare for algorithmic traders to pile on like wolves on a wounded deer—because nothing excites bots like a good old-fashioned liquidation cascade.
Remember: In crypto, 'support' is just resistance that hasn't failed yet. And somewhere in Miami, a VC is still calling this 'a healthy correction.'
Traders Turn Bearish on HBAR
According to Coinglass, HBAR’s long/short ratio is 0.95 at press time, indicating the bearish bias dominating its future market.
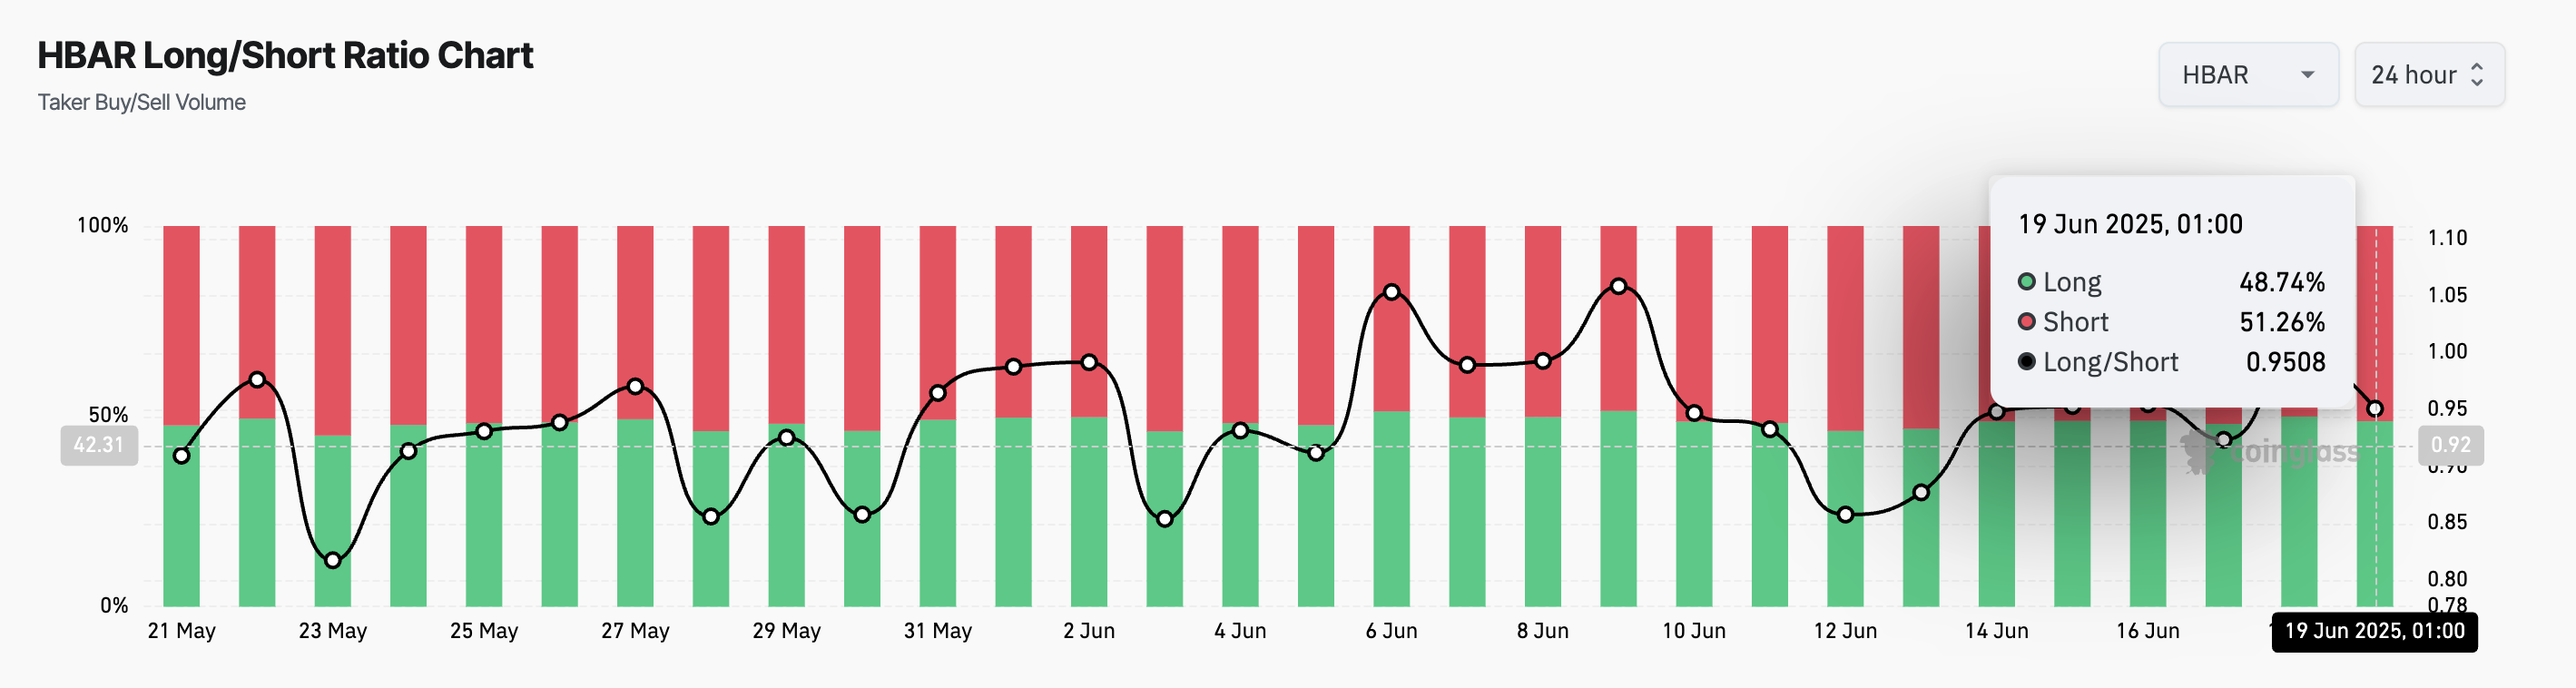
This ratio compares the number of long and short positions in a market. When its value is above 1, there are more long than short positions, indicating that traders are predominantly betting on a price increase.
Conversely, as with HBAR, a long/short ratio below one indicates that most traders anticipate a price drop. This shows heightened bearish sentiment against the altcoin and declining confidence in any short-term price rebound.
Furthermore, the setup of HBAR’s Super Trend line on the daily chart confirms this bearish outlook. At press time, this indicator forms a dynamic resistance above the token’s price at $0.14.

The Super Trend line helps traders identify the market’s direction by placing a line above or below the price chart based on the asset’s volatility. When an asset’s price trades below the Super Trend line, it signals a bearish trend, indicating that the market is in a downtrend and selling pressure is dominant.
As HBAR struggles to break above this level, the trend line reinforces the bearish sentiment and increases the downward pressure on the price.
Will HBAR Revisit April Levels?
Currently exchanging hands at a ten-day low of $0.14, HBAR has remained below a descending trend line throughout the past week.
This pattern emerges when an asset’s price forms lower highs over time, connecting those peaks with a downward-sloping line. It signals persistent selling pressure and confirms HBAR’s ongoing bearish setup.
If demand weakens further, HBAR could fall to $0.12, a level last seen in April.
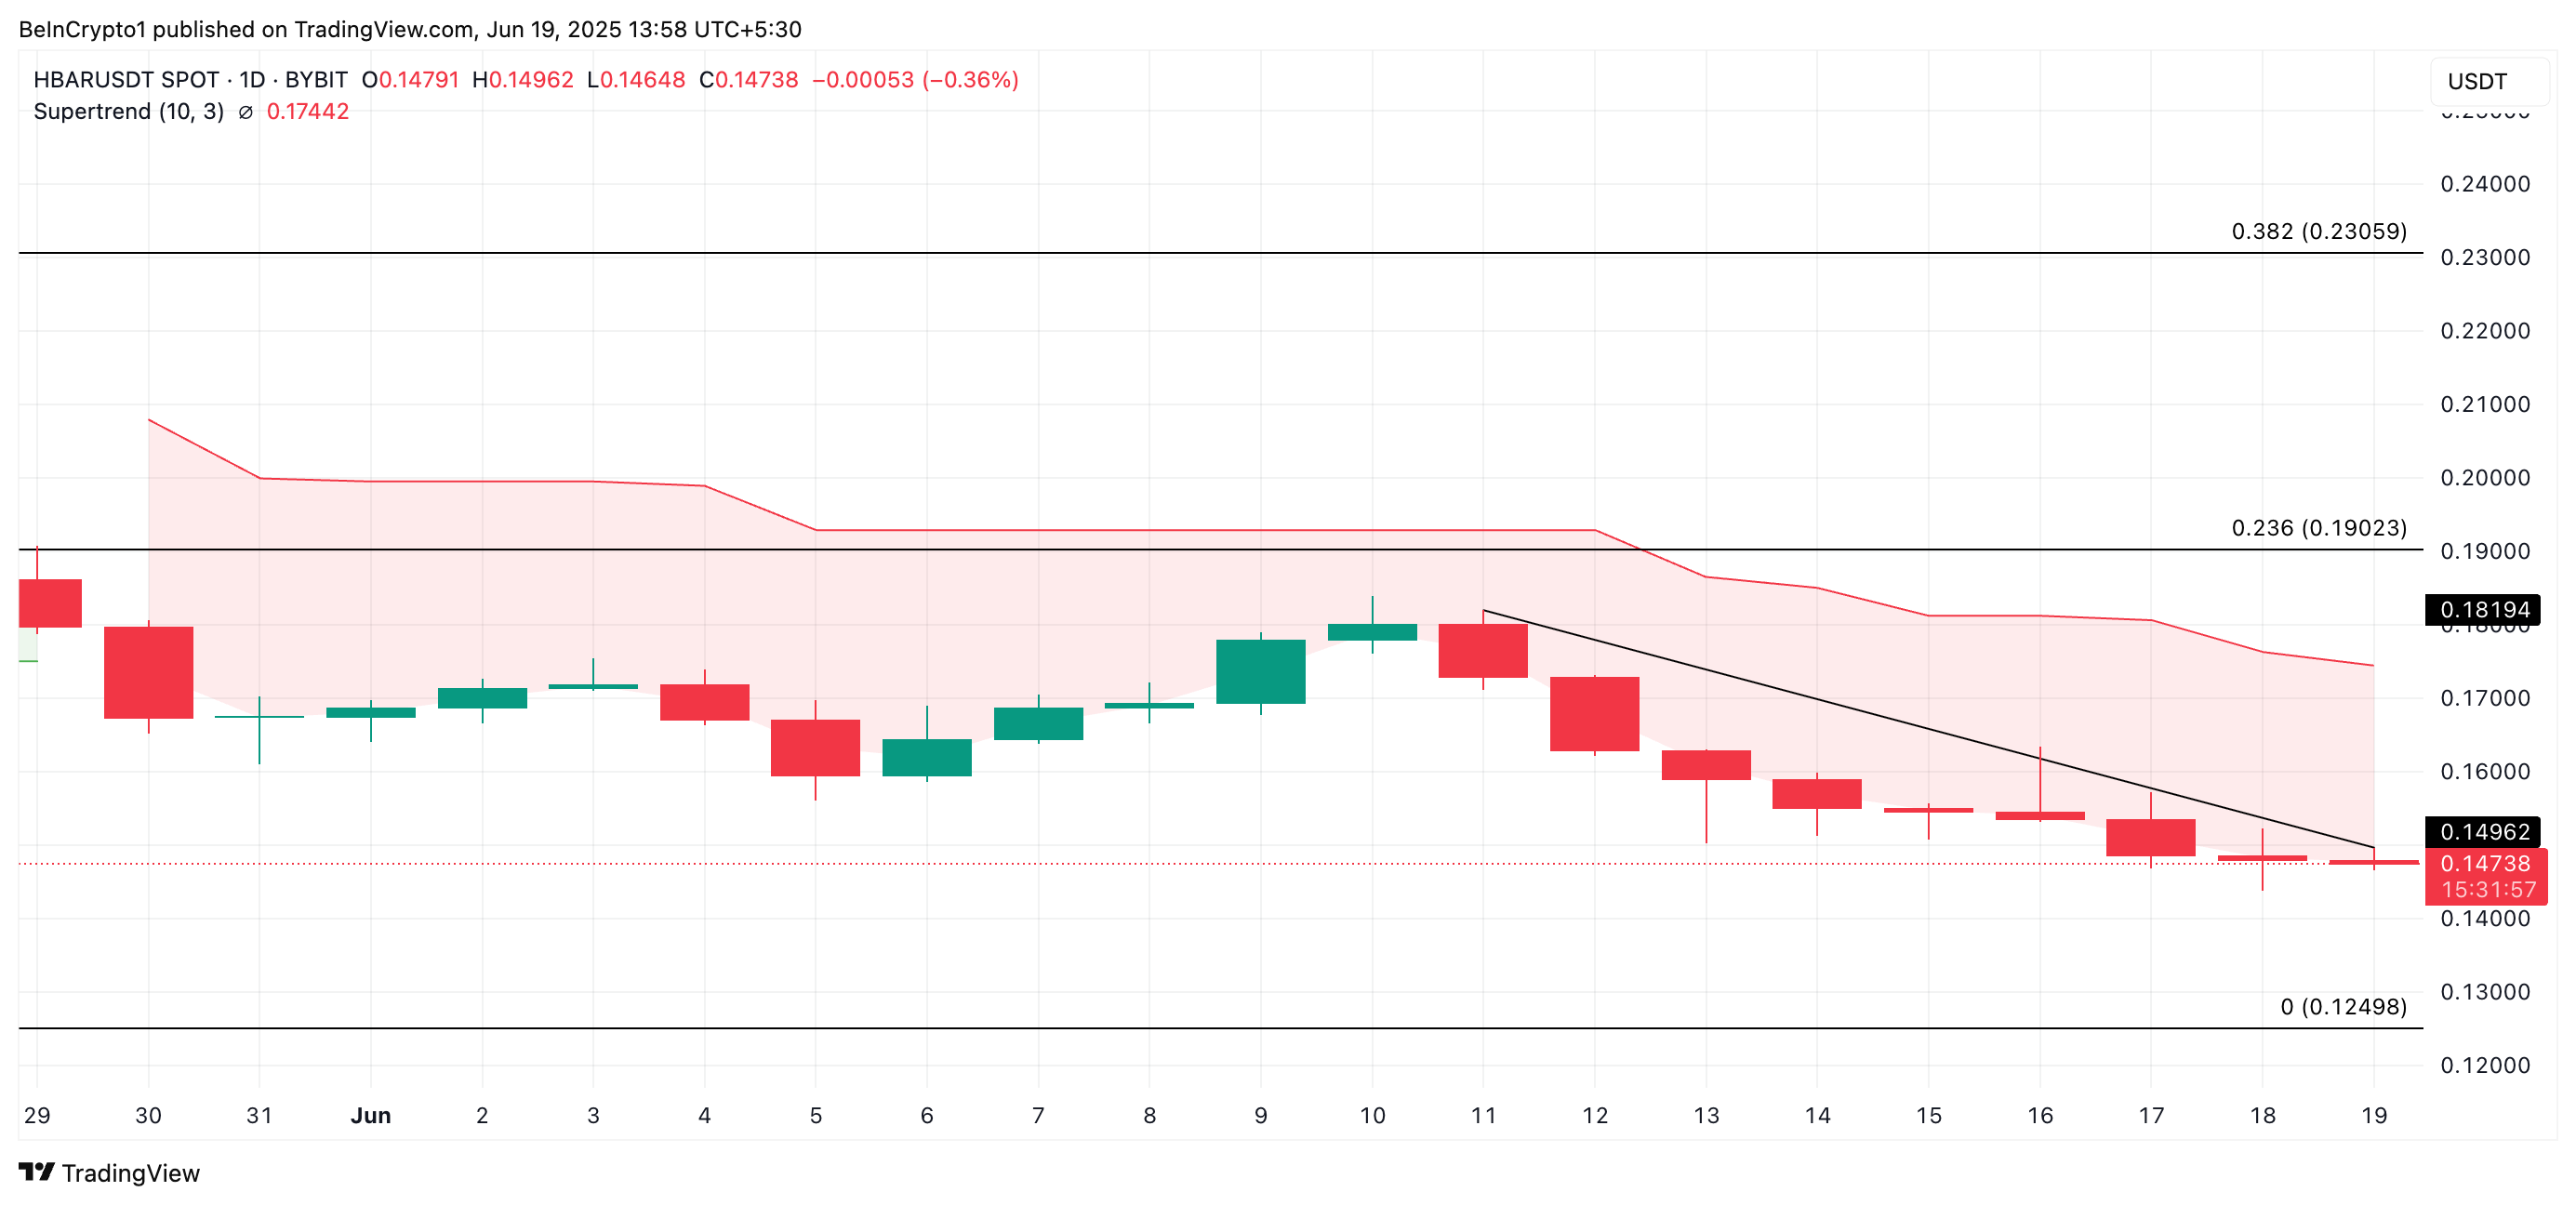
However, a rebound in buying interest could see the Hedera token break above the resistance formed by its descending trend line and Super Trend indicator, potentially rallying toward $0.19.
