FARTCOIN Plunges 13%: Is This the Start of a Crypto Winter?

FARTCOIN just got swept up in the crypto undertow—down over 13% as bearish signals flash red. Traders are bracing for what comes next.
Blood in the water? The charts don’t lie. When a coin sheds double-digits in hours, it’s either a fire sale or the market smelling weakness. And right now, the algos are voting with sell orders.
Technical breakdown. The drop wasn’t just a blip—it’s part of a broader rejection from recent highs. Support levels cracked like thin ice, and now everyone’s wondering how low it goes before the dip-buyers show up (if they do).
Meanwhile, Bitcoin maximalists are smugly sipping coffee—another ‘shitcoin’ proving their point. Because nothing unites crypto like schadenfreude.
FARTCOIN Momentum Reverses as BBTrend Turns Deeply Negative
FARTCOIN’s BBTrend has flipped sharply into bearish territory, currently sitting at -6.22 after turning negative two days ago. This marks a steep reversal from its recent high of 27 just five days ago, signaling a significant shift in momentum.
The BBTrend, or Bollinger Band Trend, measures the directional strength of price action by analyzing how far prices are moving relative to their Bollinger Bands.
Positive values indicate a strong bullish trend with expanding volatility, while negative values suggest bearish momentum and contracting price action.

With FARTCOIN’s BBTrend now firmly below zero, the indicator points to increasing downside pressure.
A reading of -6.22 implies that the asset is trading NEAR the lower edge of its volatility envelope and also doing so with growing intensity.
This typically reflects a loss of buyer interest and could foreshadow continued price weakness unless sentiment quickly reverses.
FARTCOIN Loses Steam as ADX Drops Below Key Threshold
FARTCOIN’s Directional Movement Index (DMI) is showing clear signs of weakening trend strength, with its Average Directional Index (ADX) falling to 14.83 from 27.82 just three days ago.
The ADX measures the strength of a trend, regardless of direction—values above 25 typically suggest a strong trend, while values below 20 imply low momentum or consolidation.
With the ADX now under 15, FARTCOIN appears to be entering a low-volatility phase, where directional conviction is fading and price action may turn choppy.
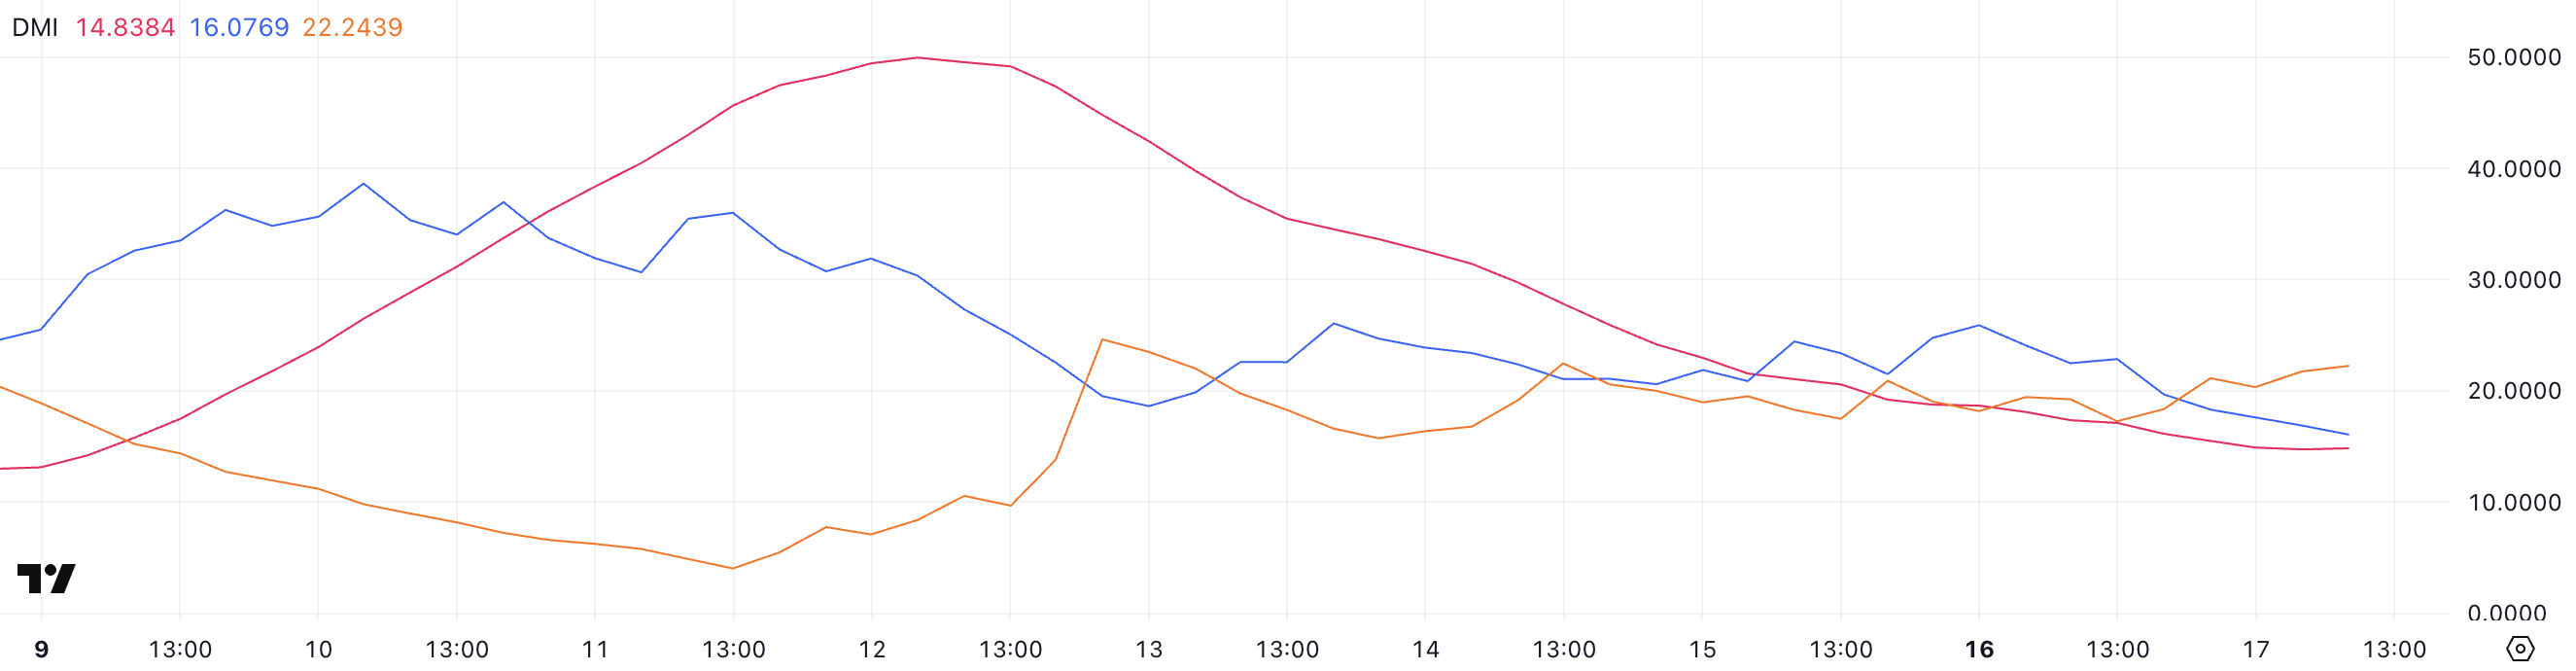
Meanwhile, the directional indicators paint a bearish short-term picture for the meme coin. The +DI, which tracks bullish pressure, dropped sharply to 16 from 25.89, indicating fading buying interest.
At the same time, the -DI ROSE to 22.24 from 17.27, suggesting growing sell-side momentum.
This widening gap between bearish and bullish strength, combined with the falling ADX, points to a market where sellers are taking control—but without strong conviction yet.
If trend strength begins to rebuild with bearish dominance, FARTCOIN could face further downside.
FARTCOIN Slips 22% In 6 Days as Death Cross Looms on Charts
FARTCOIN was one of the top-performing meme coins earlier this month, rallying 64% between June 5 and June 11. However, momentum has shifted sharply, with the token dropping 22% over the last six days.
The recent pullback has put technical pressure on the price, and chart indicators suggest a potential trend reversal. FARTCOIN’s EMA lines are now close to forming a death cross—a bearish signal that often precedes extended downtrends.
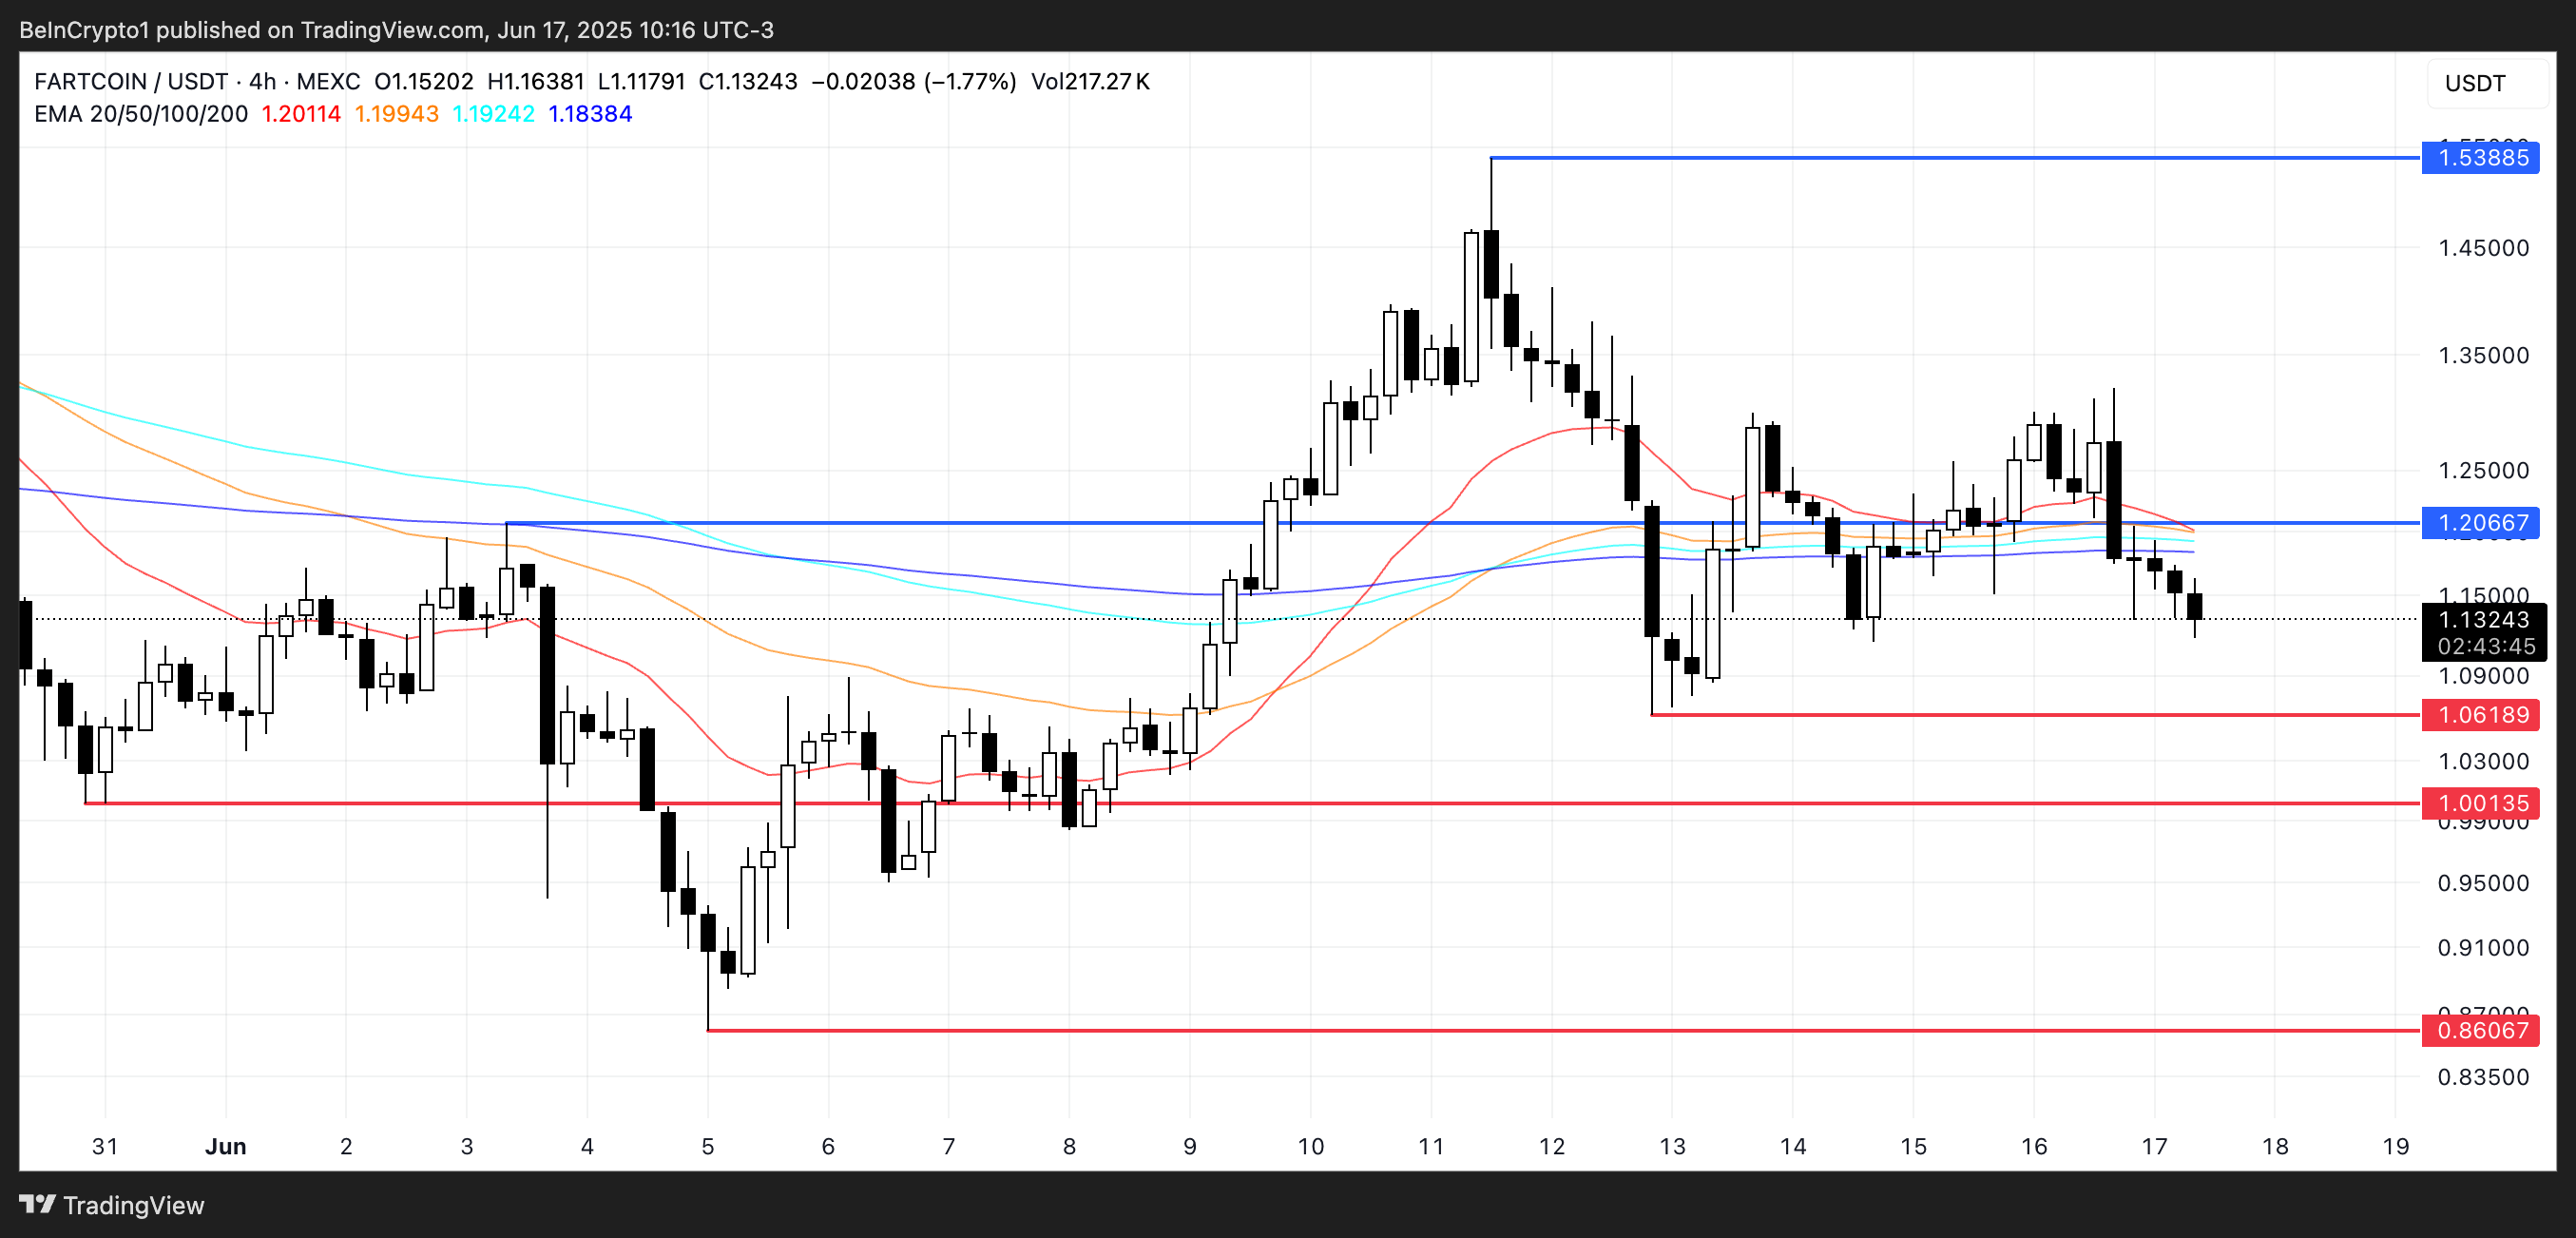
If the death cross confirms, the meme coin could slide to test support at $1.06, then $1.00, and possibly fall as low as $0.86 if bearish momentum accelerates.
On the flip side, if bulls reclaim control and the trend turns upward, FARTCOIN could retest resistance at $1.20. A clean breakout above that level could pave the way for a MOVE toward $1.53.
