Bitcoin’s $107K Liquidity Pool Fuels Bullish Frenzy—Is This the Launchpad?

Whales are circling as BTC's order book thickens near $107,000—a classic accumulation zone that's triggered rallies before. Market makers smell blood.
Liquidity clusters like this either become rocket fuel or trapdoors. With institutional custody at all-time highs and spot ETFs hungry for supply, the smart money's betting on liftoff. Just don't tell the 'efficient market' academics.
BTC Poised to Clear $105,000 as On-Chain Metrics Signal Bullish Momentum
BTC’s liquidation heatmap shows a significant liquidity cluster around the $106,736 price region. These clusters tend to attract Bitcoin buyers, making a breakout above $105,000 increasingly likely.
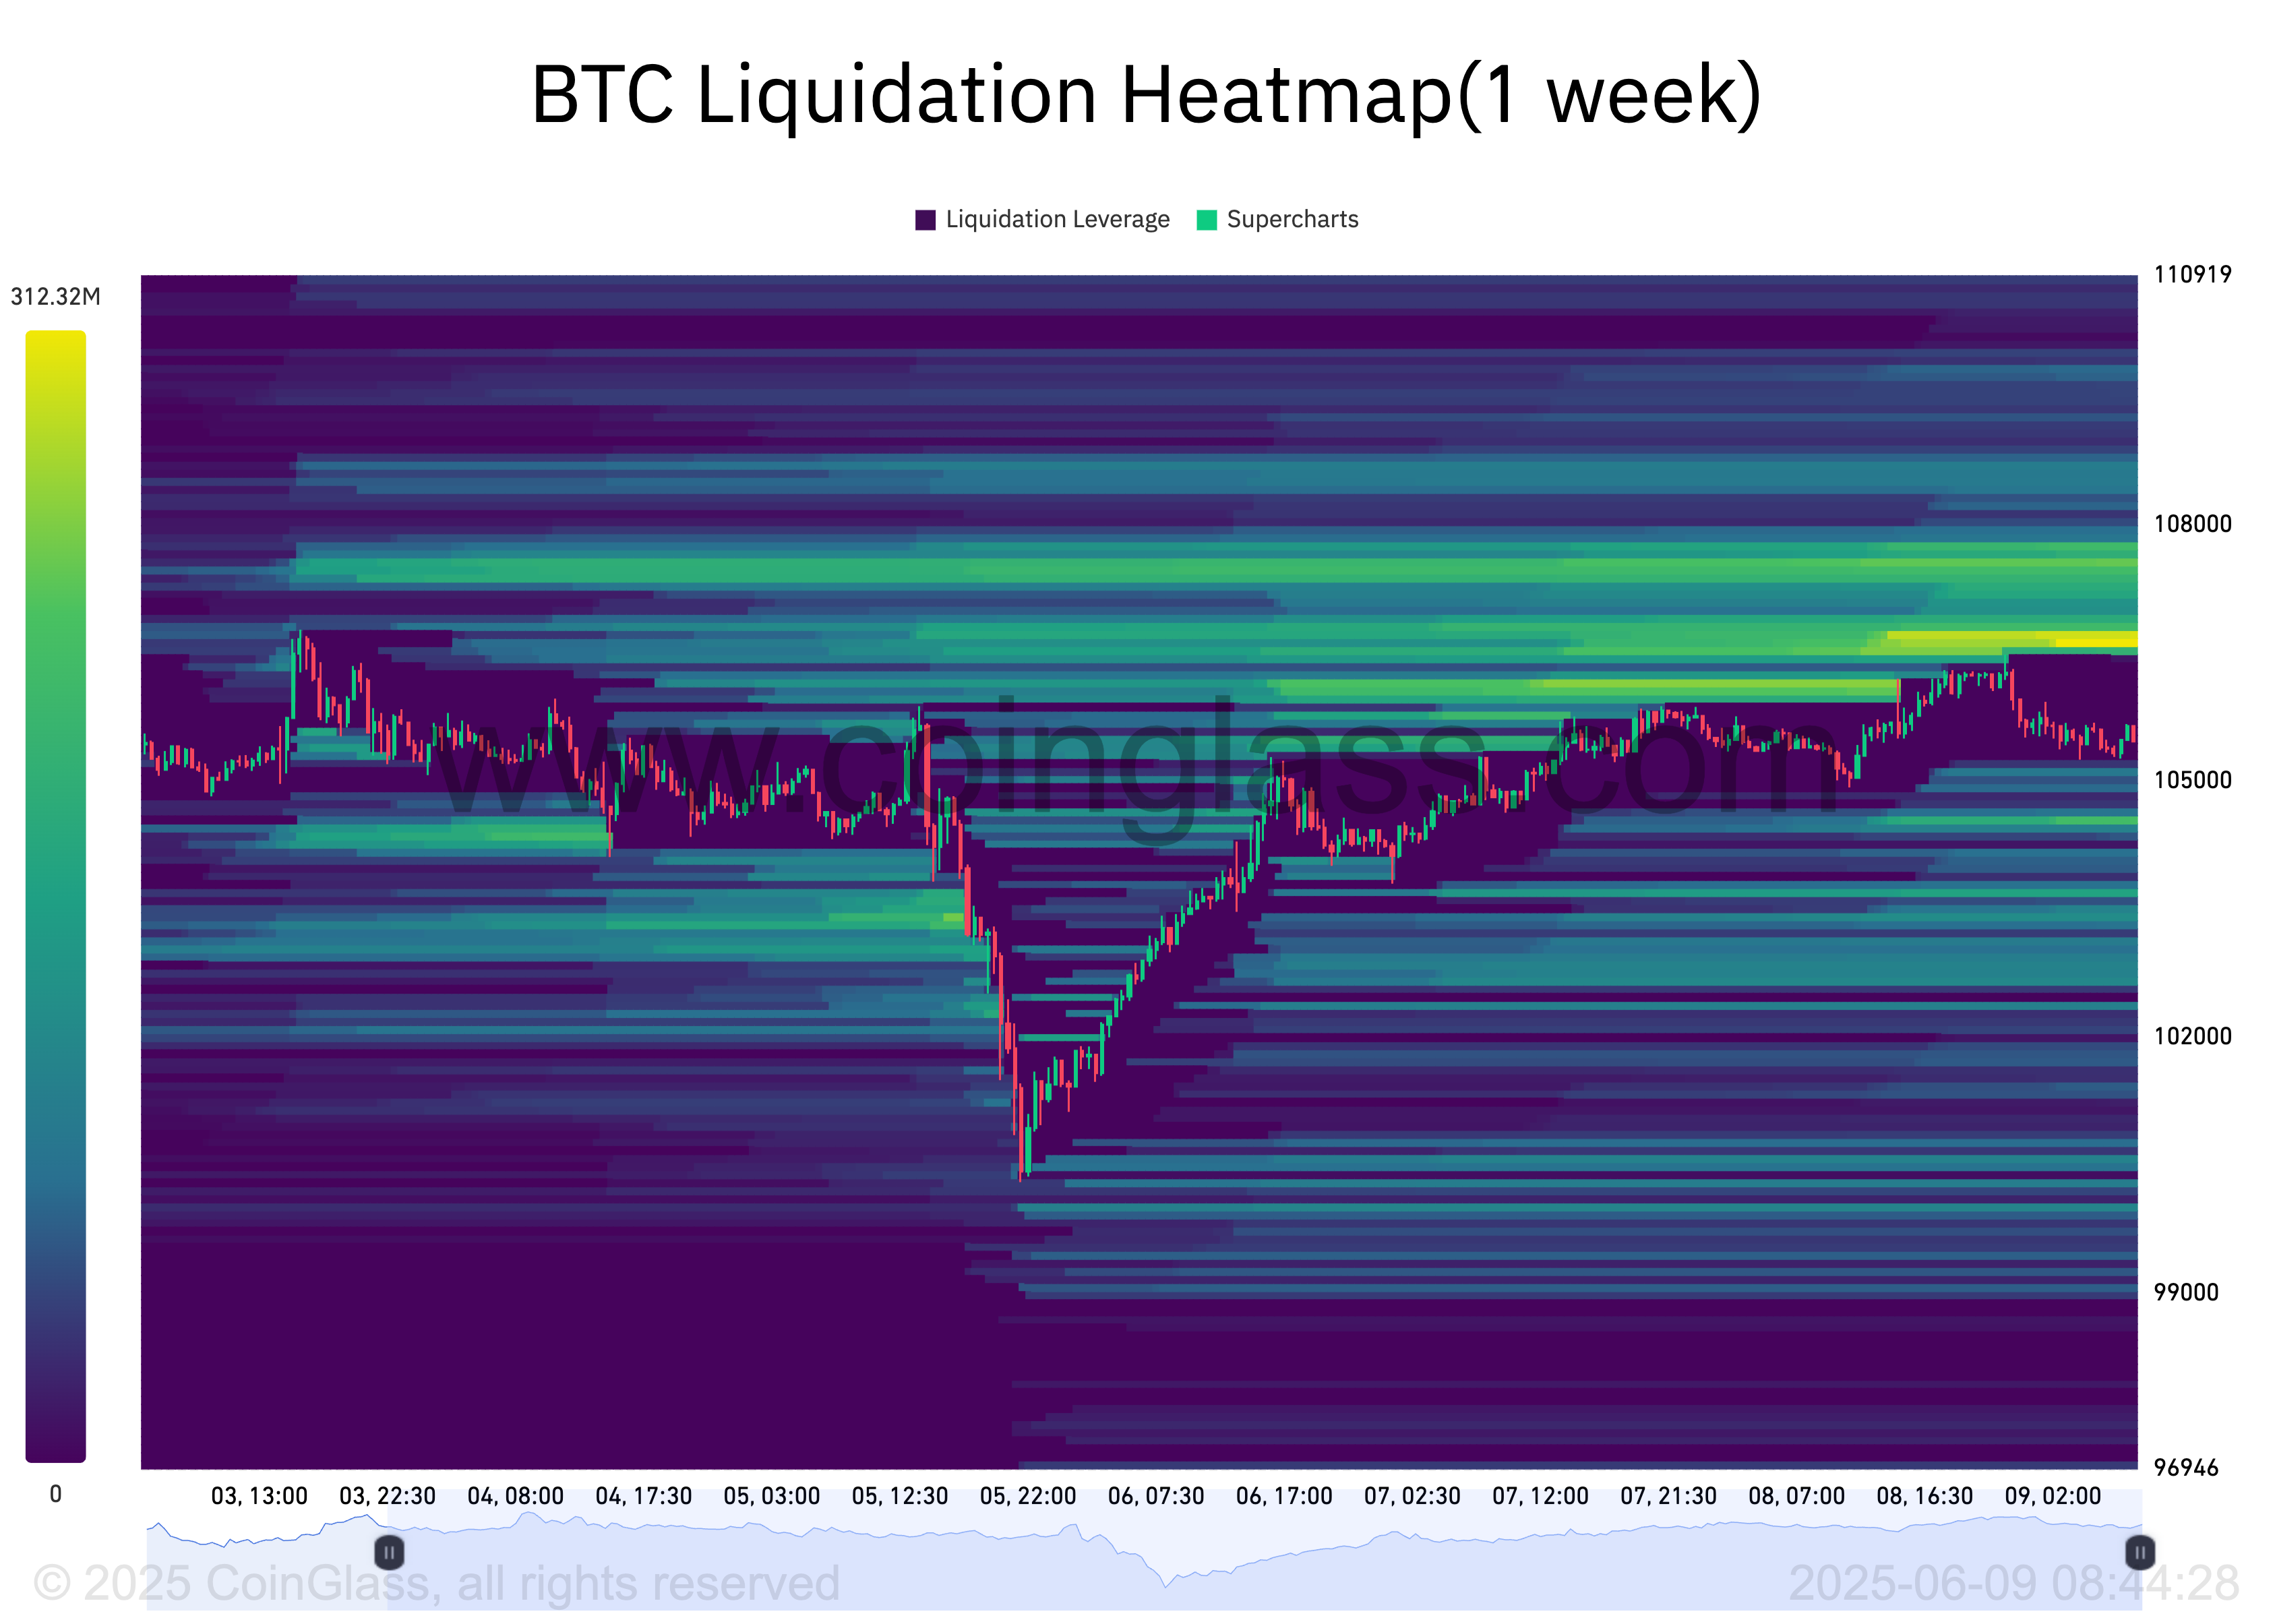
Liquidation heatmaps identify price levels where a large concentration of Leveraged positions is likely to be liquidated. These maps highlight areas of high liquidity, often color-coded to show intensity, with brighter zones (yellow) representing larger liquidation potential.
These liquidity areas are usually magnets for price action, as the market moves toward them to trigger liquidations and open fresh positions.
Therefore, for BTC, the concentration of a high volume of liquidity at the $106,736 price level indicates a strong trader interest in buying or closing short positions at that price. This opens the door for BTC to clear the $105,000 resistance and rally toward the $106,000 zone.
Further, the decline in BTC’s Network Realized Profit/Loss (NPL) supports this bullish outlook. At press time, it sits at 715 million, plummeting over 90% since June 4.
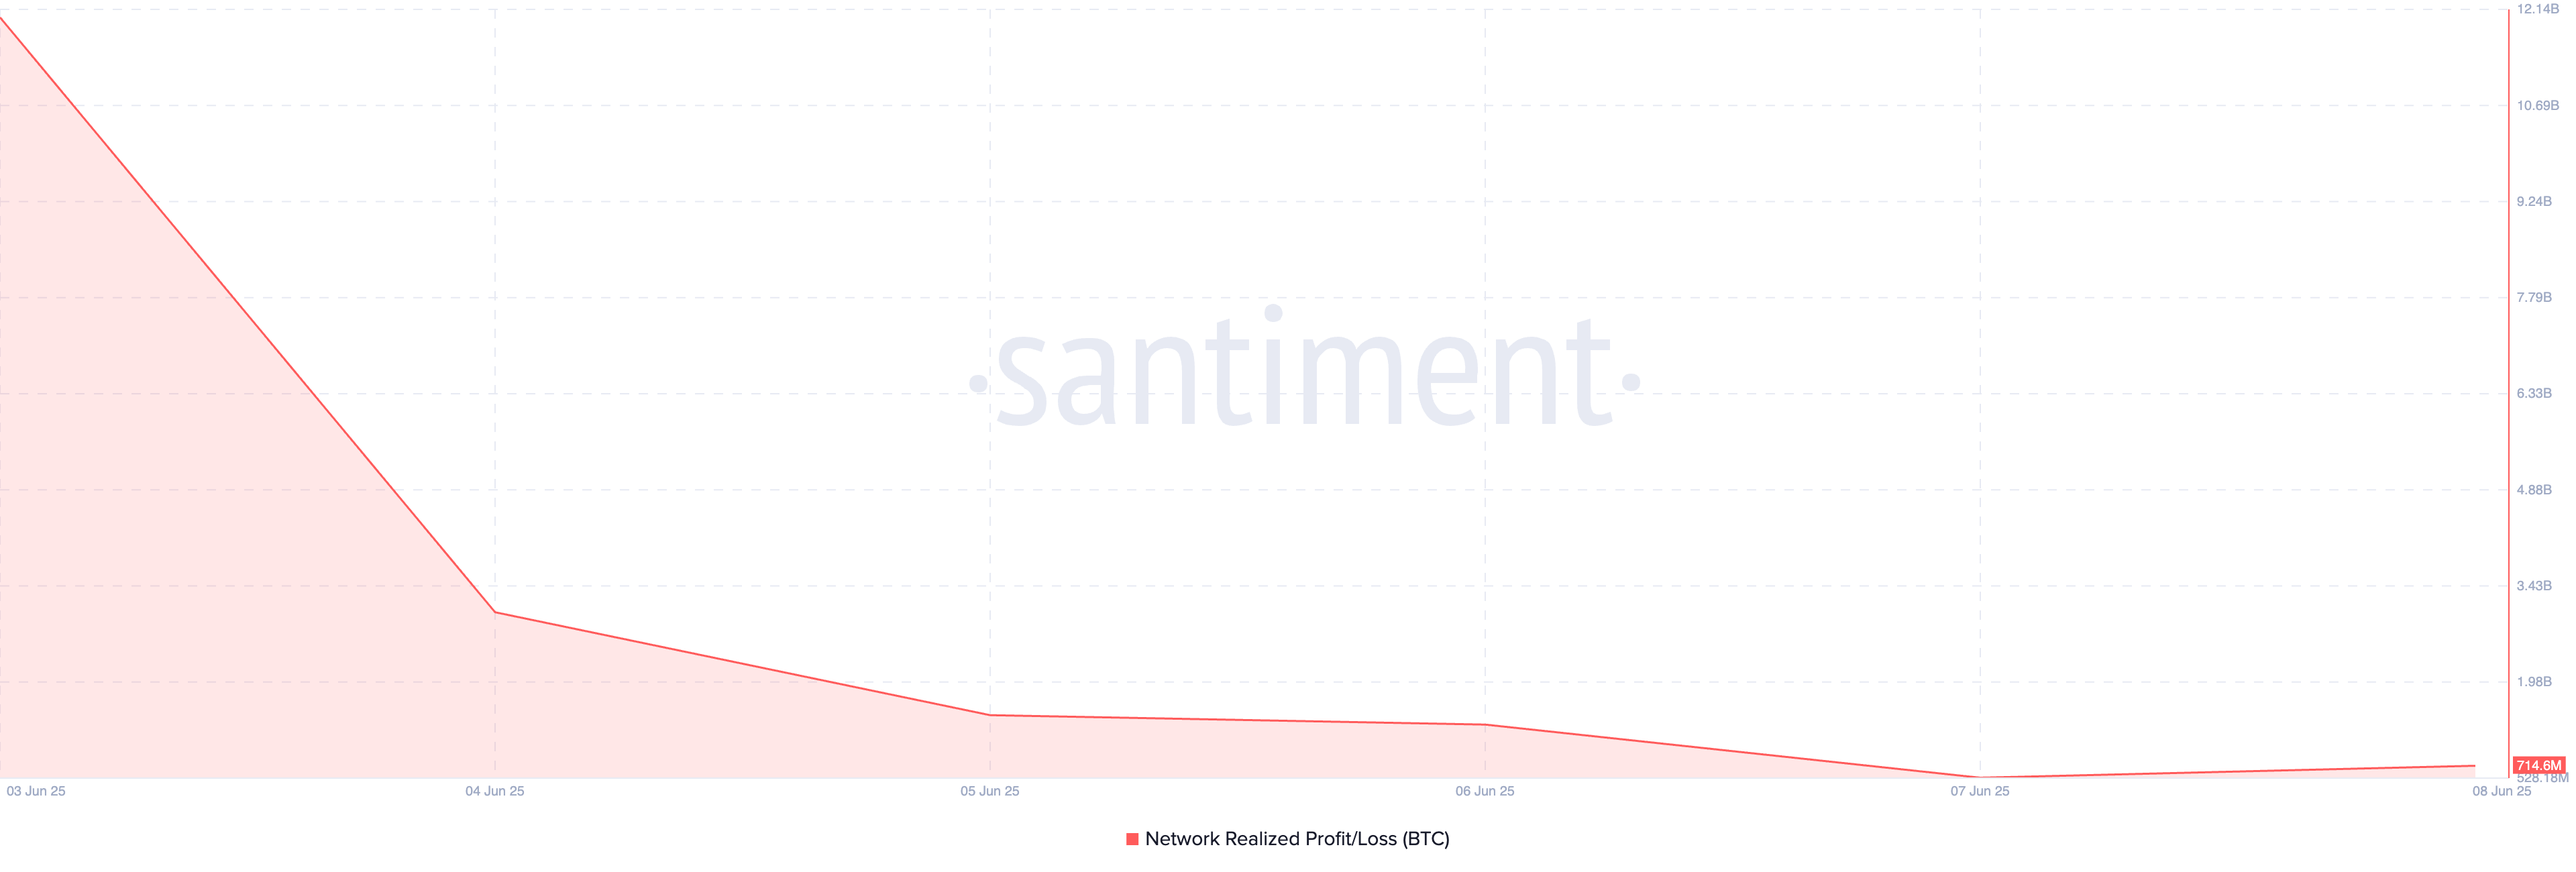
The NPL measures the total profit or loss investors realize when they move their coins. Historically, it discourages selling pressure when it declines like this, as traders are less willing to sell off their holdings at a loss.
This behavior promotes longer holding periods, tightens supply, and could potentially push BTC’s price higher in the short term.
Bitcoin’s Fate Hangs Between $106,000 Breakout and $103,000 Pullback
At press time, BTC trades at $105,630, resting below the resistance formed at $106,548. If new demand enters the market, it could trigger a break above this price level and a rally toward the $106,736 price region where the liquidity cluster exists.
A breach of this level could propel BTC’s price to $109,310.

However, if selloffs strengthen, BTC could remain range-bound or face a decline to $103,938.
