Toncoin (TON) Short-Term Outlook: Bulls Charge or Bears Pounce?

Toncoin (TON) traders are buckling up for volatility as the asset flirts with key resistance levels. Will the Telegram-linked token defy gravity—or face a reality check?
Technical indicators scream ’overbought’ while exchange inflows hint at profit-taking. Yet TON’s ecosystem growth—think TON Space wallets and Telegram’s 800M-user distribution—keeps bulls whispering ’this time it’s different.’
Watch for make-or-break moves at the $7.50 psychological barrier. Breakthrough? ATHs beckon. Rejection? Cue the ’we told you so’ from crypto skeptics counting their fiat dividends.
Toncoin RSI Signals Possible Reversal
Toncoin (TON) saw sharp volatility after mixed signals about a Telegram-xAI partnership. Telegram founder Pavel Durov announced a one-year Grok AI integration, sending TON up over 20%.
But the rally faded quickly. Elon Musk denied any formal deal, saying, “No deal has been signed,” causing TON to drop within 30 minutes. Durov later clarified it was only agreed to “in principle.”
The conflicting messages shook investor confidence and created market uncertainty.
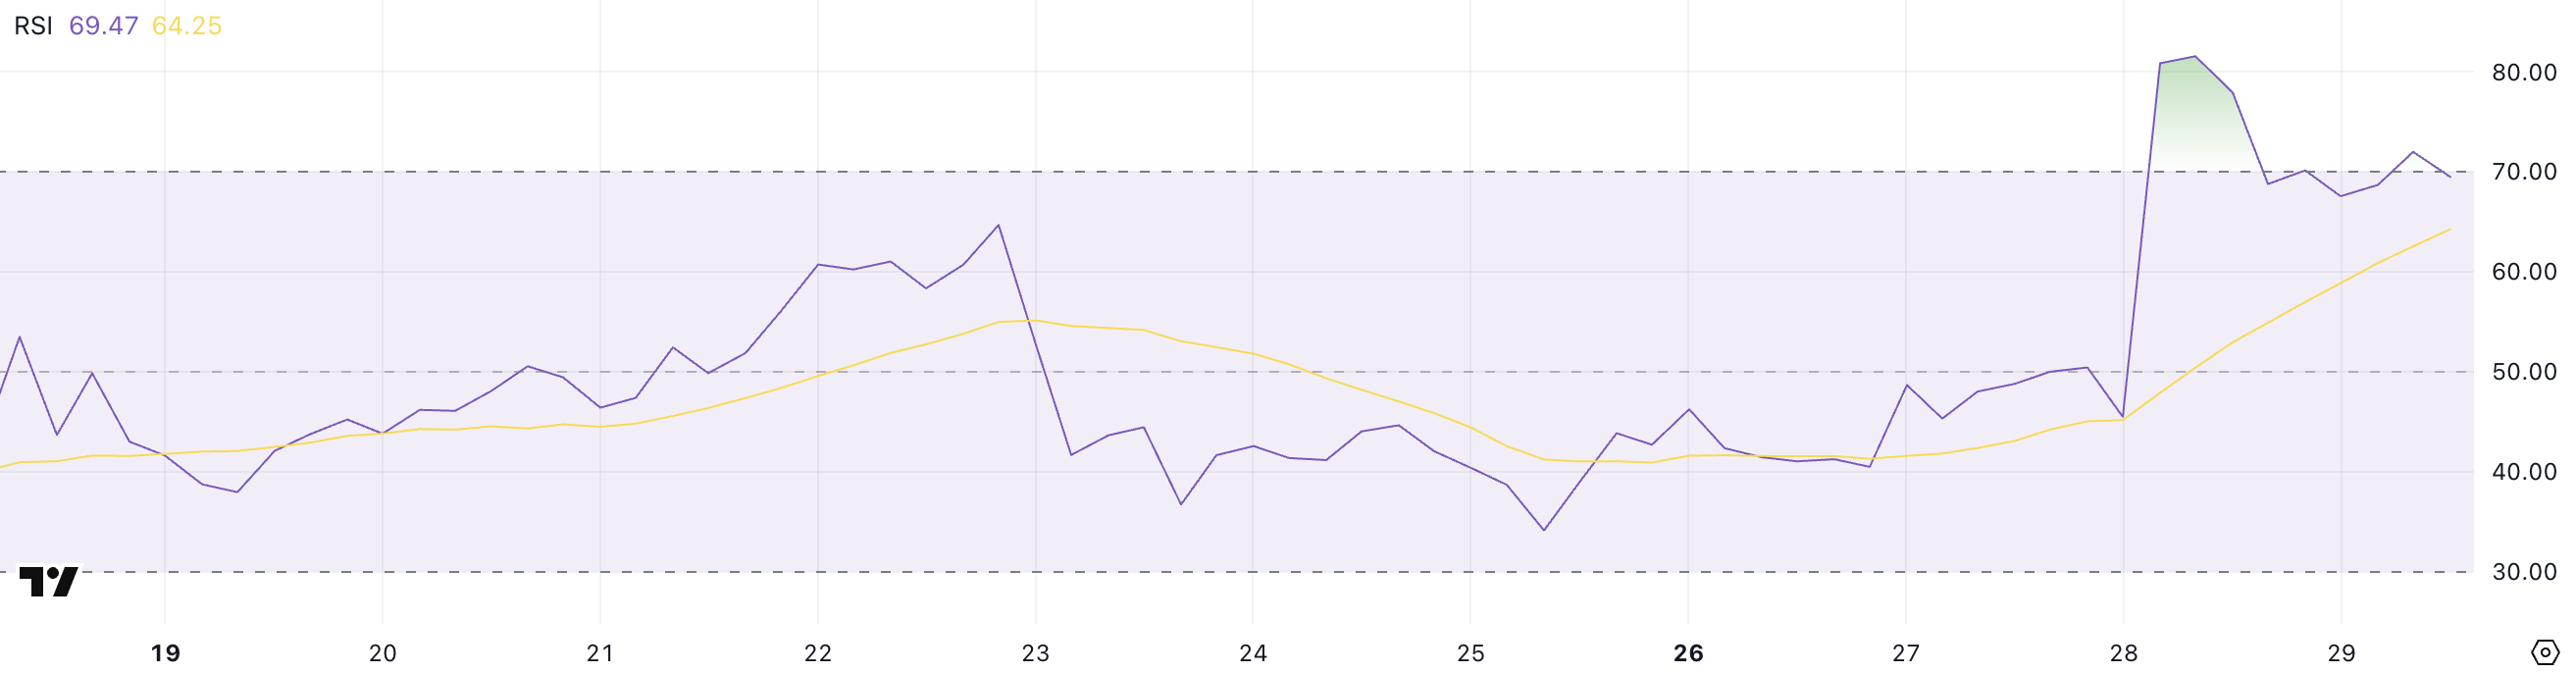
Technically, Toncoin’s Relative Strength Index (RSI) currently sits at 69.47, down from yesterday’s intraday peak of 81.55.
The RSI is a momentum oscillator that ranges from 0 to 100 and helps identify overbought or oversold conditions—readings above 70 typically indicate overbought territory. At the same time, values below 30 suggest the asset may be oversold.
TON’s rapid jump from 45.47 to above 80 within a day highlighted extreme buying pressure following the initial announcement.
With the RSI hovering just below the overbought threshold, the indicator suggests bullish momentum is cooling. Without strong fundamental support, Toncoin could face further price consolidation or a potential short-term pullback.
TON Chart Shows Weakening Momentum Despite Bullish Setup
Toncoin is trading above the Ichimoku Cloud. The price sits between the blue Tenkan-sen (conversion line) and the green Chikou Span (lagging span), showing short-term bullish momentum.
The Tenkan-sen is slightly above the red Kijun-sen (base line), which supports a continued upward bias. However, the gap between them is narrowing, suggesting the trend is weakening and could reverse if buyers don’t step in soon.

The cloud ahead (Kumo) is thin and bullish. The Senkou Span A (green leading span) is above the Senkou Span B (red leading span).
However, the future cloud’s flat nature and low altitude relative to recent candles suggest that momentum could stall unless another catalyst emerges.
The Chikou Span remains above the price action from 26 periods ago, confirming the current bullish stance, but if it dips below, a trend reversal warning WOULD emerge. For now, Ichimoku signals a cautiously bullish but weakening trend for TON.
Toncoin Forms Golden Cross—Will Bulls Push Toward $4?
Toncoin recently formed a golden cross—a bullish technical pattern that occurs when a short-term moving average crosses above a long-term one—signaling the potential start of a sustained uptrend.
This crossover often attracts momentum traders and is generally seen as a confirmation of growing upward pressure.
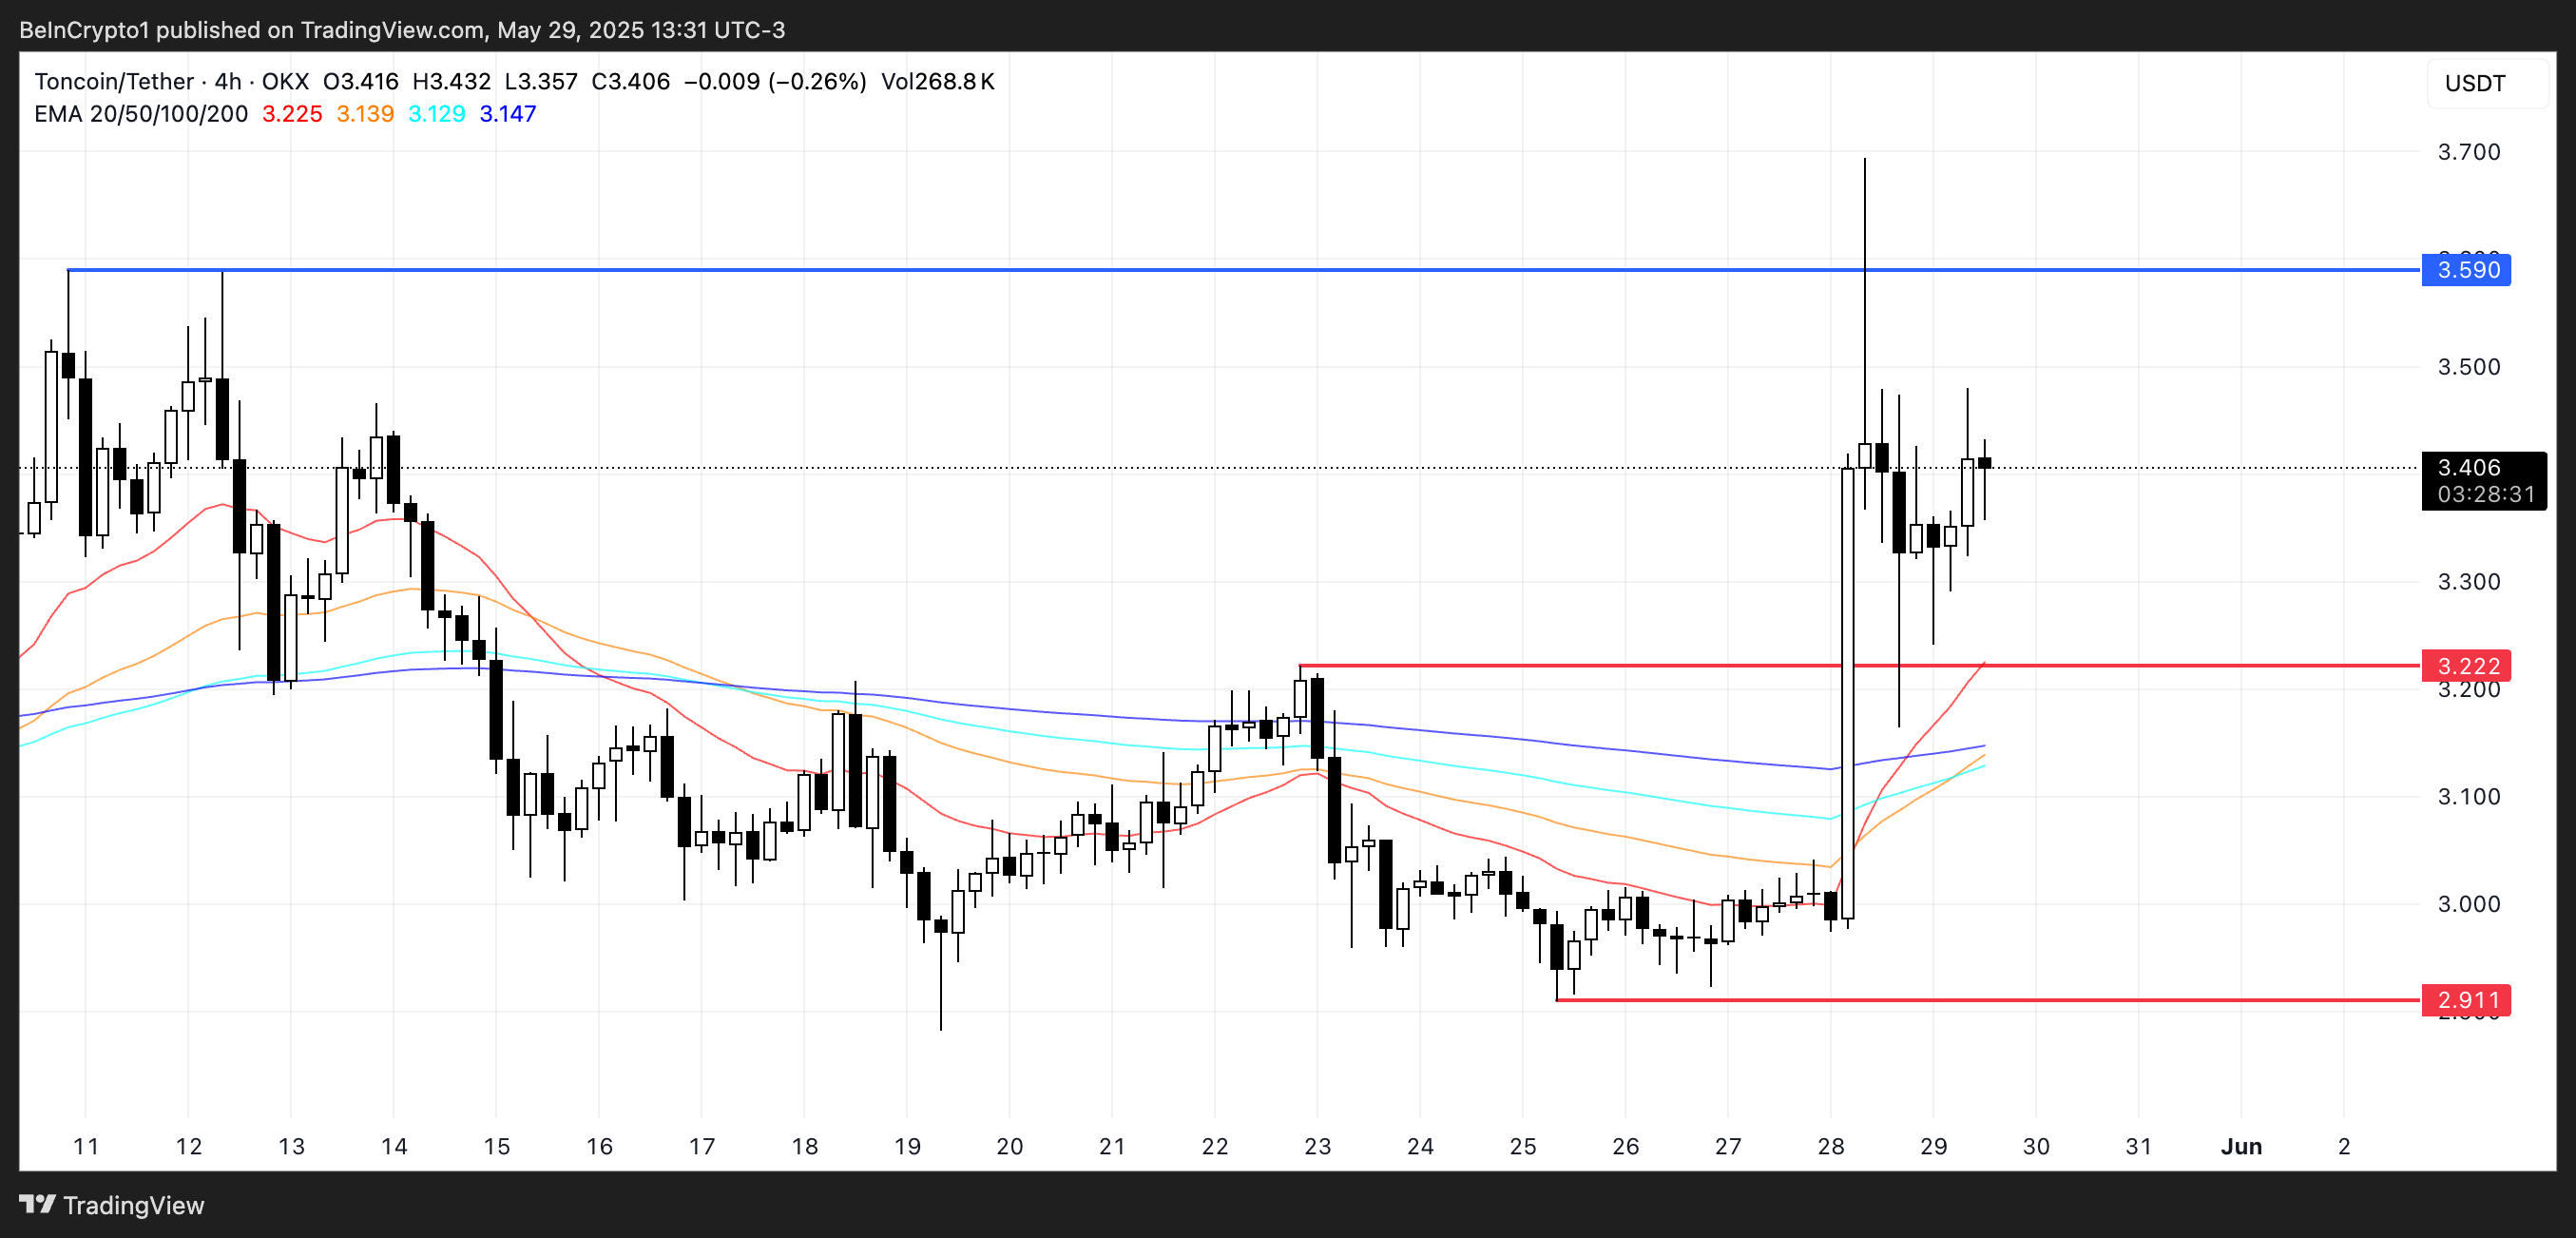
If this bullish setup holds, TON could continue to climb and eventually test resistance around the $3.59 level, a zone that could act as a breakout trigger if accompanied by strong volume.
However, if the bullish momentum fades and the trend reverses, TON may find itself retesting the support at $3.22. A break below this level could lead to a deeper correction, with the next key support lying NEAR $2.91.

Log in to Reply
Log in to comment your thoughtsComments
Related Articles
|Square
Get the BTCC app to start your crypto journey
Get started today Scan to join our 100M+ users