Hyperliquid Flirts With ATH – Can HYPE Sustain the Rally?

Hyperliquid’s native token HYPE is knocking on the door of its all-time high—again. The perpetuals-focused protocol keeps gaining traction while TradFi institutions still can’t agree whether crypto is ’an asset class’ or ’a scam.’
What’s fueling the surge?
Speculation around Hyperliquid’s zero-gas-fee model and its growing dominance in on-chain derivatives trading. The protocol now processes over $1B daily volume—enough to make even the most skeptical quant raise an eyebrow.
But here’s the real question: Will HYPE break through resistance, or is this just another ’buy the rumor, sell the news’ setup? The charts suggest momentum, but in crypto, gravity always wins—eventually.
HYPE RSI Hits 82, Signaling Overbought Conditions After Sudden Surge
HYPE’s Relative Strength Index (RSI) has surged to 82.19, up sharply from 49.98 just one day ago—a strong sign of rapid momentum buildup.
The RSI is a momentum oscillator that measures the speed and change of price movements, ranging from 0 to 100.
Readings below 30 typically suggest an asset is oversold, while readings above 70 indicate it is overbought and may be due for a pullback or consolidation.
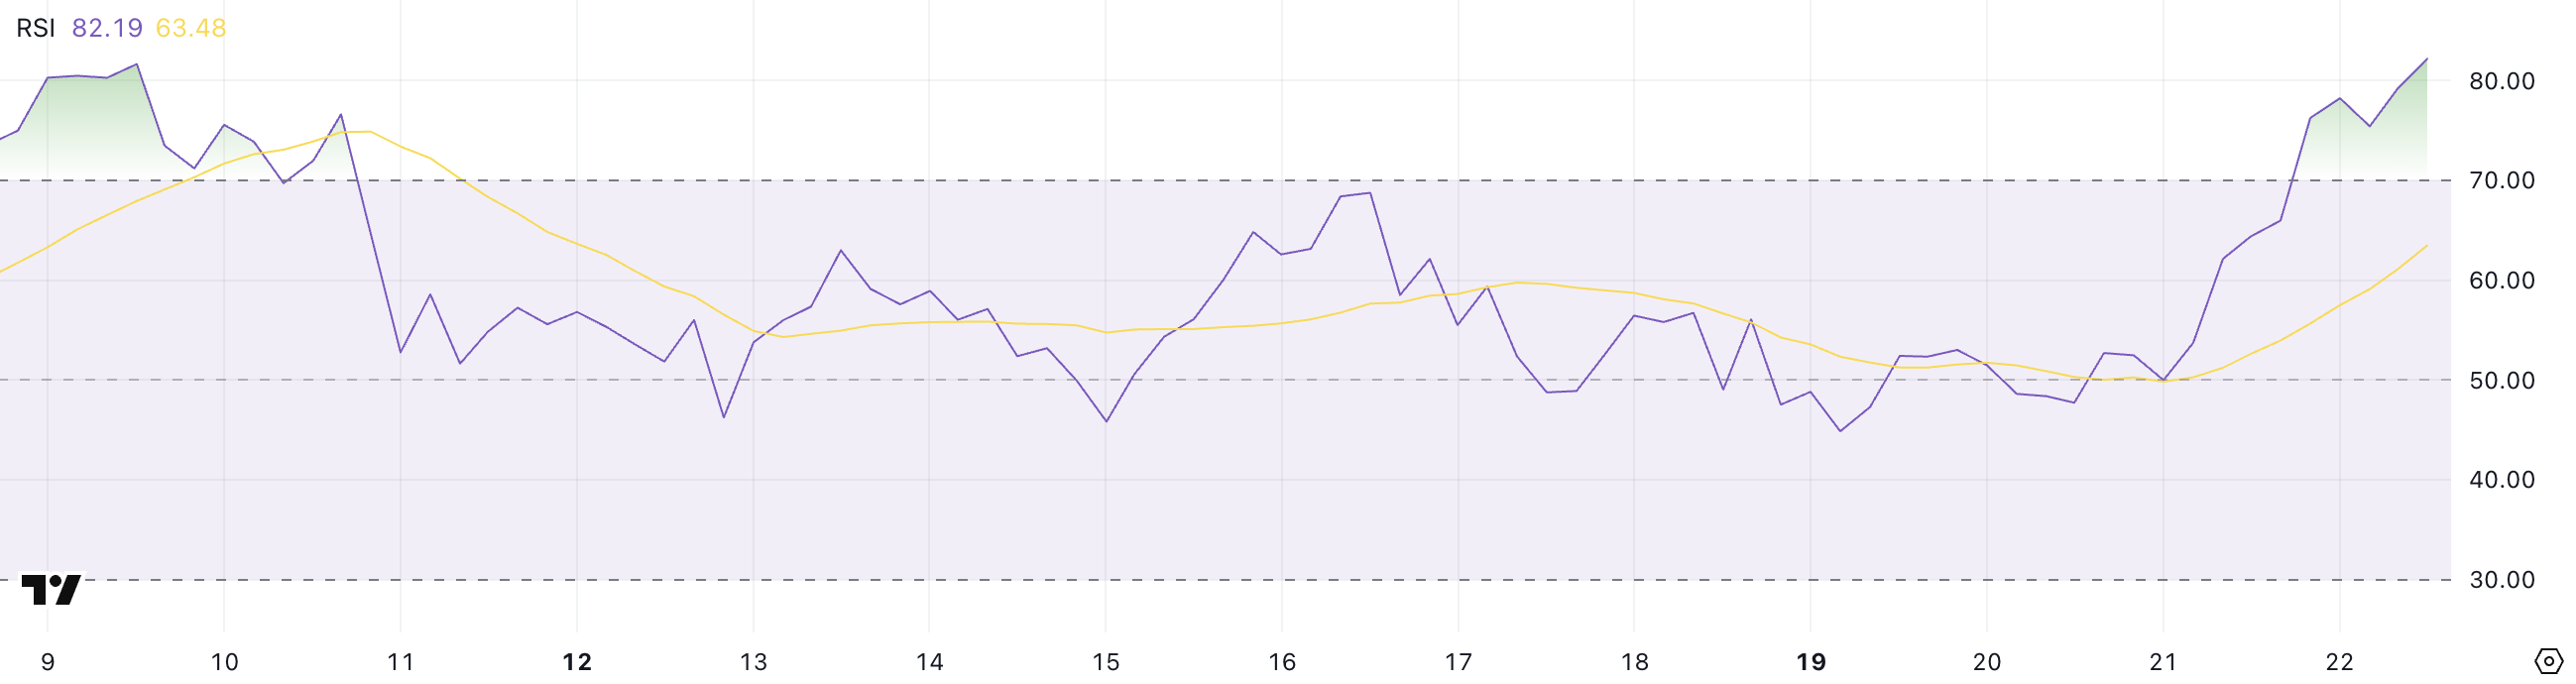
With HYPE’s RSI now well above the 70 threshold, the token is currently in overbought territory.
This level often signals that bullish momentum has stretched too far too quickly, increasing the likelihood of short-term corrections or sideways movement.
However, strong RSI readings can also persist in parabolic moves, especially if volume and market sentiment remain elevated. Traders will be watching closely for signs of weakening momentum or bearish divergence that could mark a potential reversal.
HYPE BBTrend Turns Negative, Signaling Sharp Momentum Reversal
HYPE’s BBTrend has dropped sharply to -7.19, down from 1.57 just a day ago, ending a three-day streak in positive territory. The BBTrend (Bollinger Band Trend) measures the strength and direction of price moves relative to the Bollinger Bands.
Positive values indicate upward momentum, while negative values suggest increasing downside pressure.
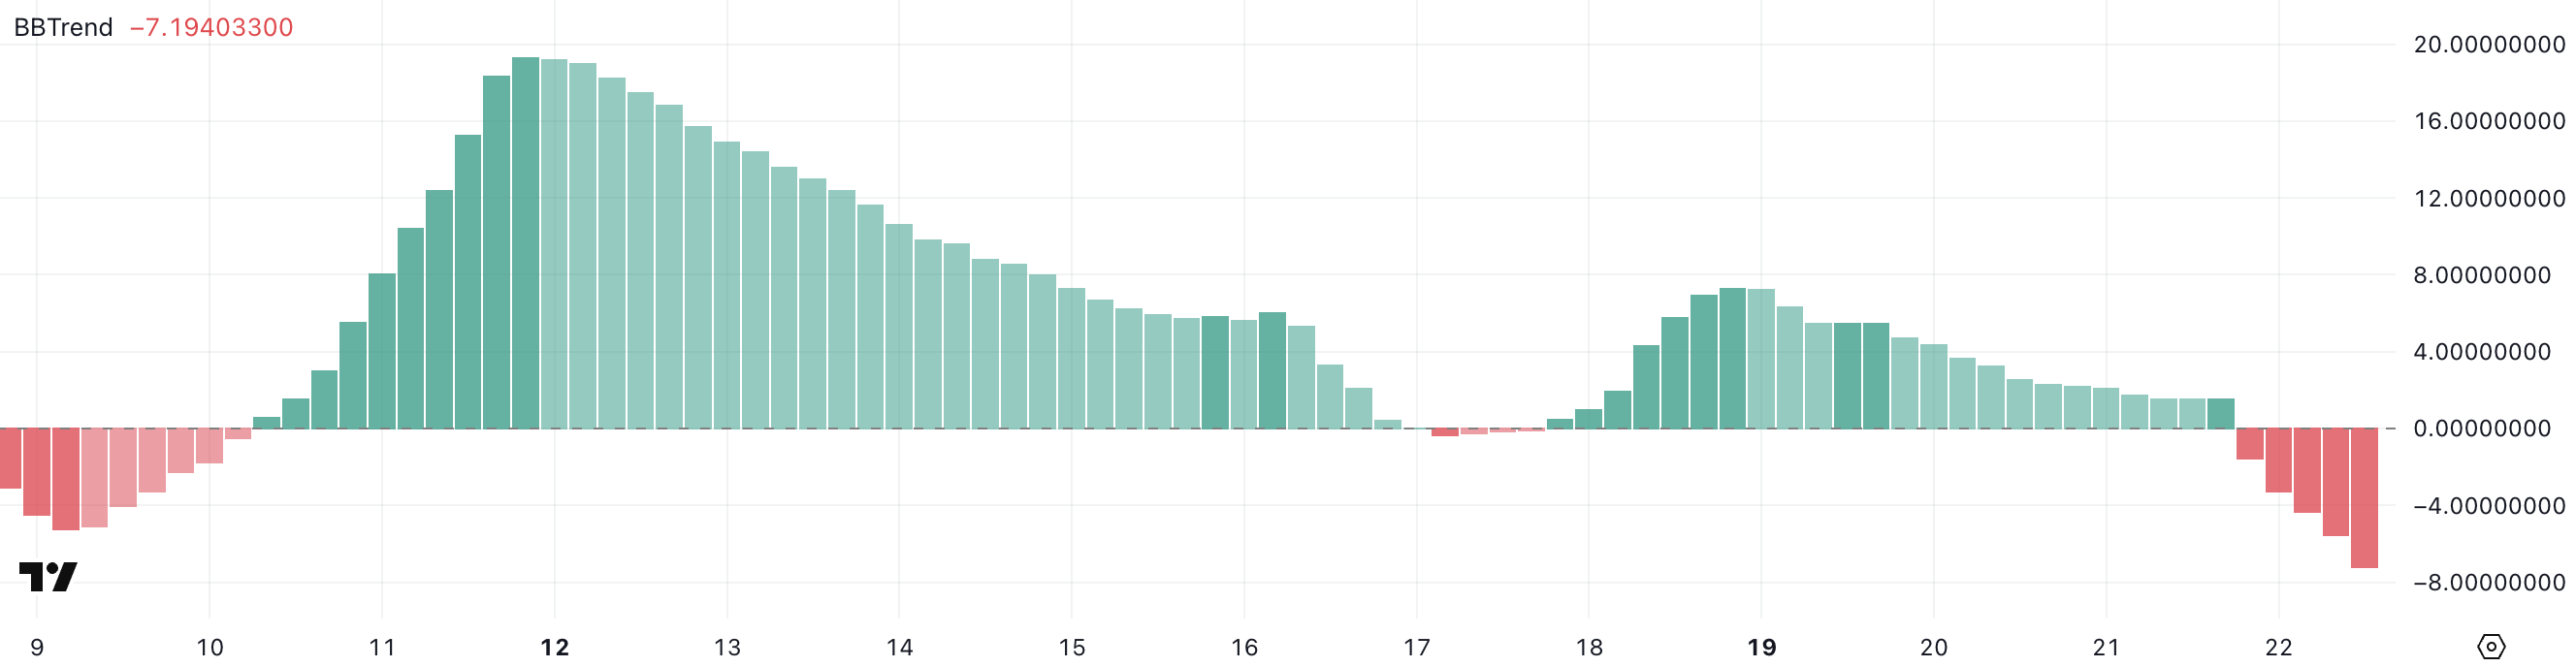
A BBTrend reading of -7.19 signals a sudden shift toward bearish momentum. This steep drop may reflect rising volatility to the downside and could lead to further selling if the trend persists.
For Hyperliquid, this reversal suggests caution—especially if it coincides with fading volume or key support levels being tested.
Hyperliquid Breaks $30, Just 5% From ATH—but BBTrend Flags Caution
HYPE is now just 5% below its all-time high, breaking above $30 today for the first time since December 2024.
The EMA structure remains strongly bullish, with short-term moving averages positioned above long-term ones—typically a signal of sustained upward momentum.
If the current trend holds, HYPE could break past $34 and potentially reach $35 in the NEAR term.
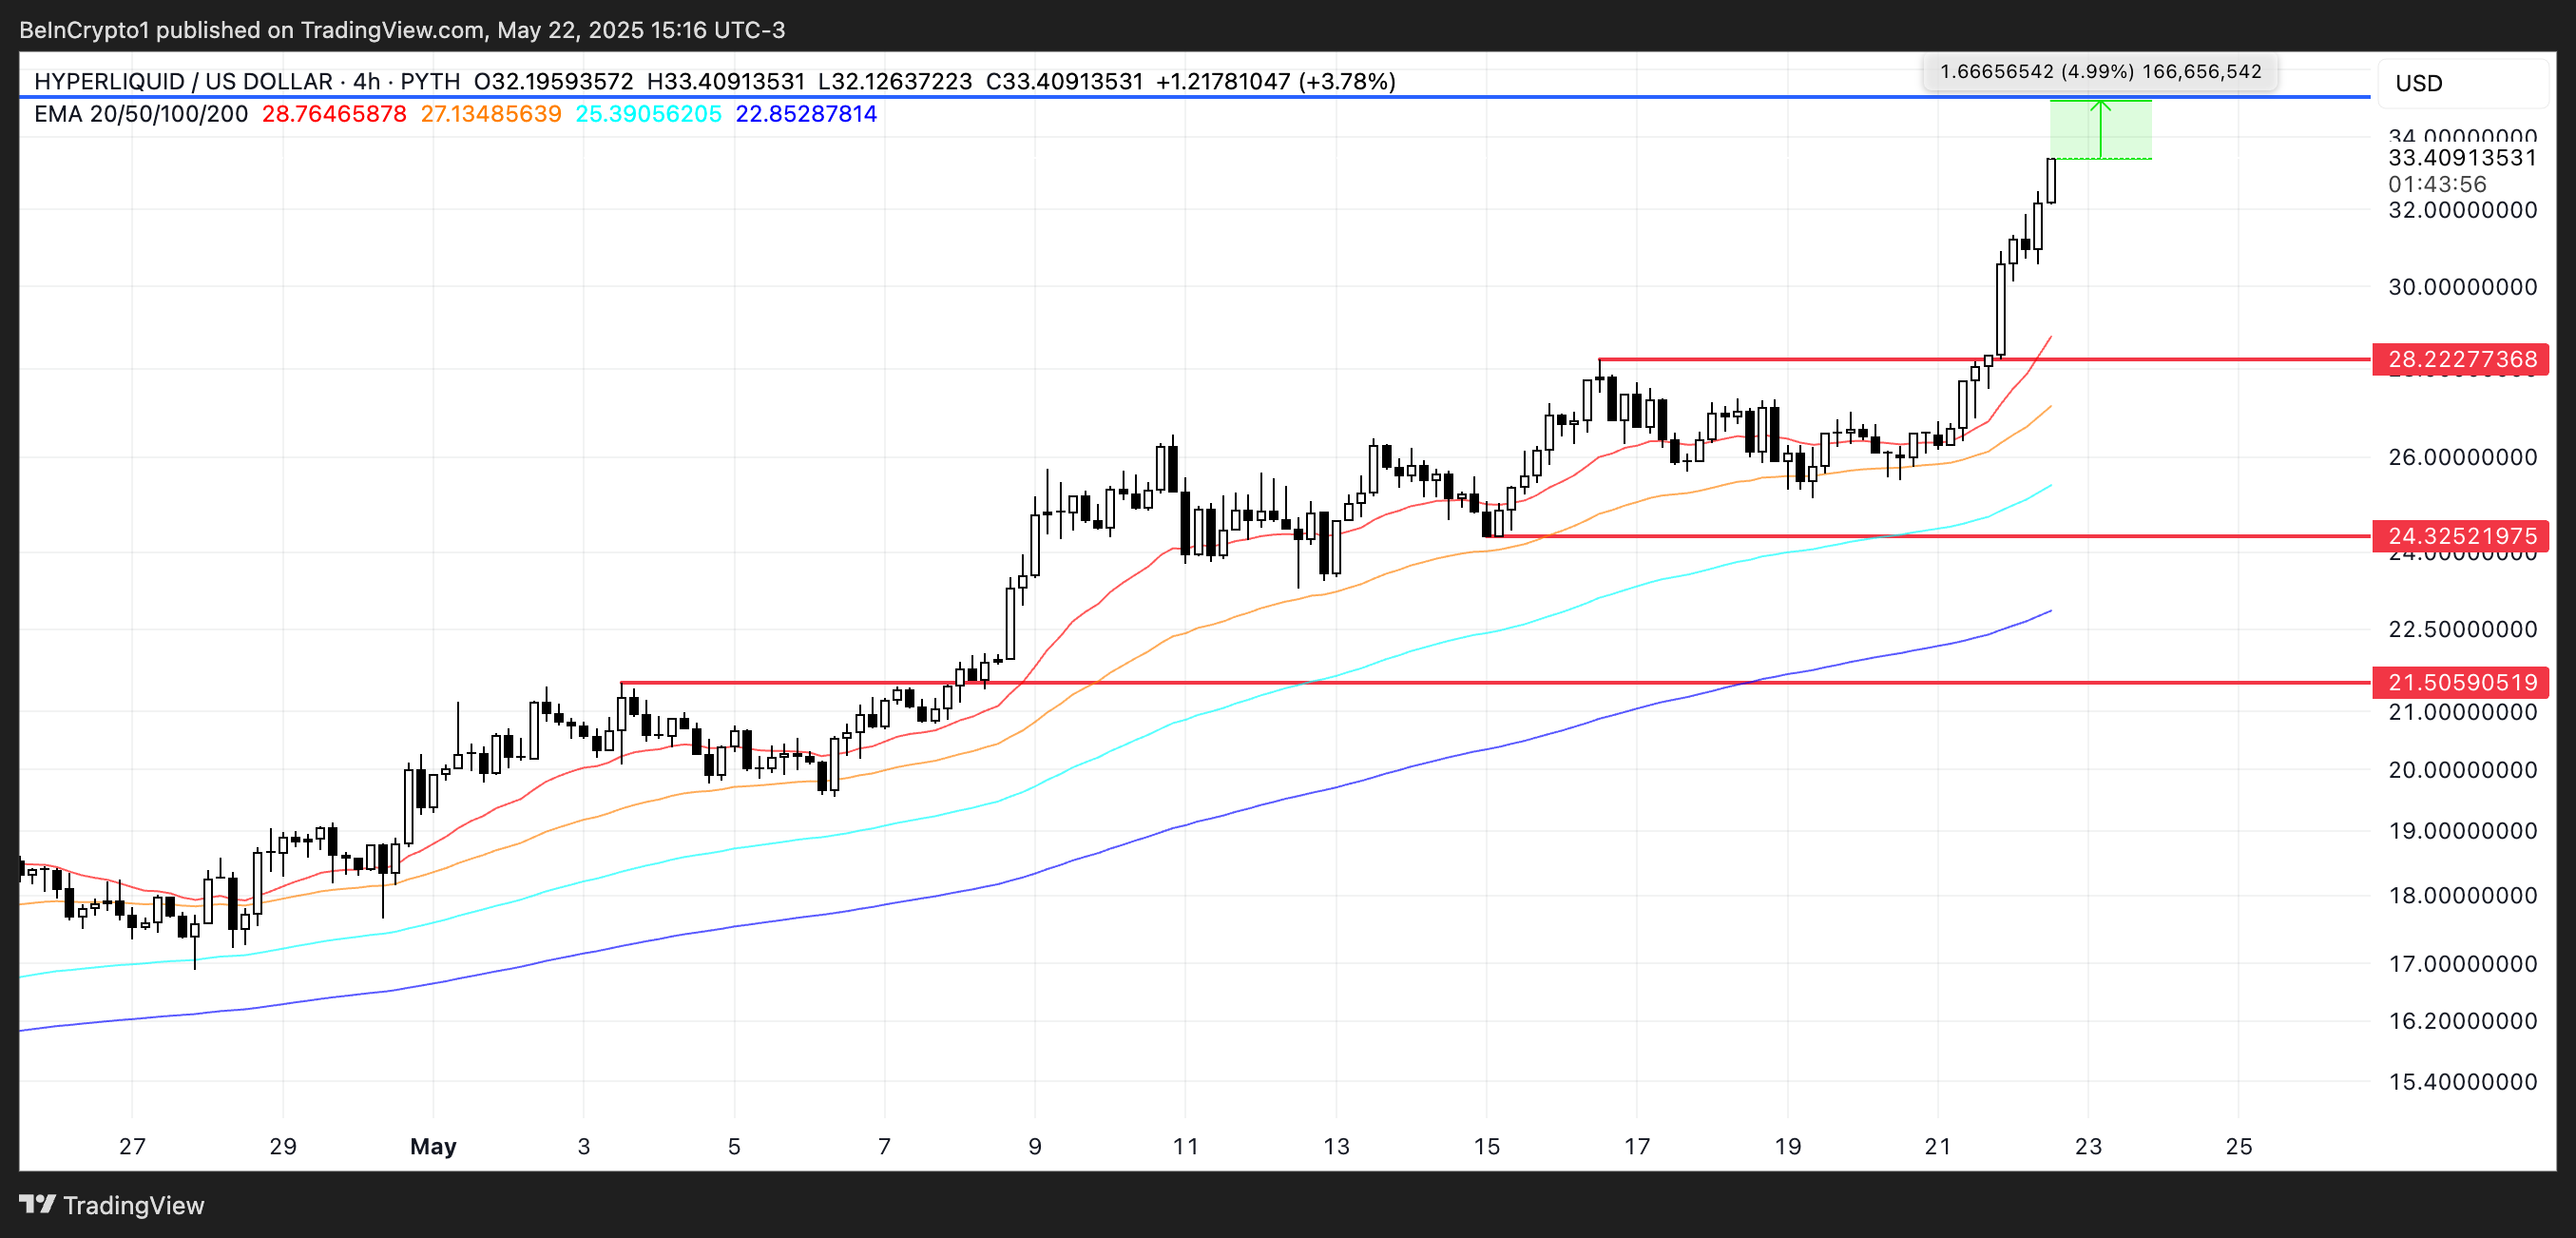
However, the recent drop in BBTrend suggests the uptrend may be weakening.
If momentum shifts, Hyperliquid could test support at $28.2.
A break below that level could send the price down to $24.32, with further downside risk to $21.5 if bearish pressure intensifies.
