HBAR Defies Downtrend as Whale Activity Hints at Imminent Rally

After weeks of bleeding out, Hedera’s native token stages a Lazarus move—just as institutional wallets start loading up. Could this be the start of a macro reversal or another ’buy the rumor’ trap?
Whale watchers spot unusual accumulation patterns while retail traders pile into leveraged longs. The last time this happened, HBAR ripped 300% in three weeks. Cue the ’this time it’s different’ chorus.
Technical indicators flash the first green since April’s brutal sell-off. The 200-day MA just got reclaimed—a feat that had crypto bros popping champagne like they forgot about Q2’s ’guaranteed’ ETF inflows that never materialized.
HBAR Gears Up for Rebound as Bulls Take Charge
HBAR is showing early signs of recovery as technical indicators point to investors increasing their buying activity. For example, in recent sessions, the altcoin’s Balance of Power (BoP), which measures the strength of buyers versus sellers, has shifted in favor of the bulls. At press time, HBAR’s BoP is positive and in an uptrend at 0.21.
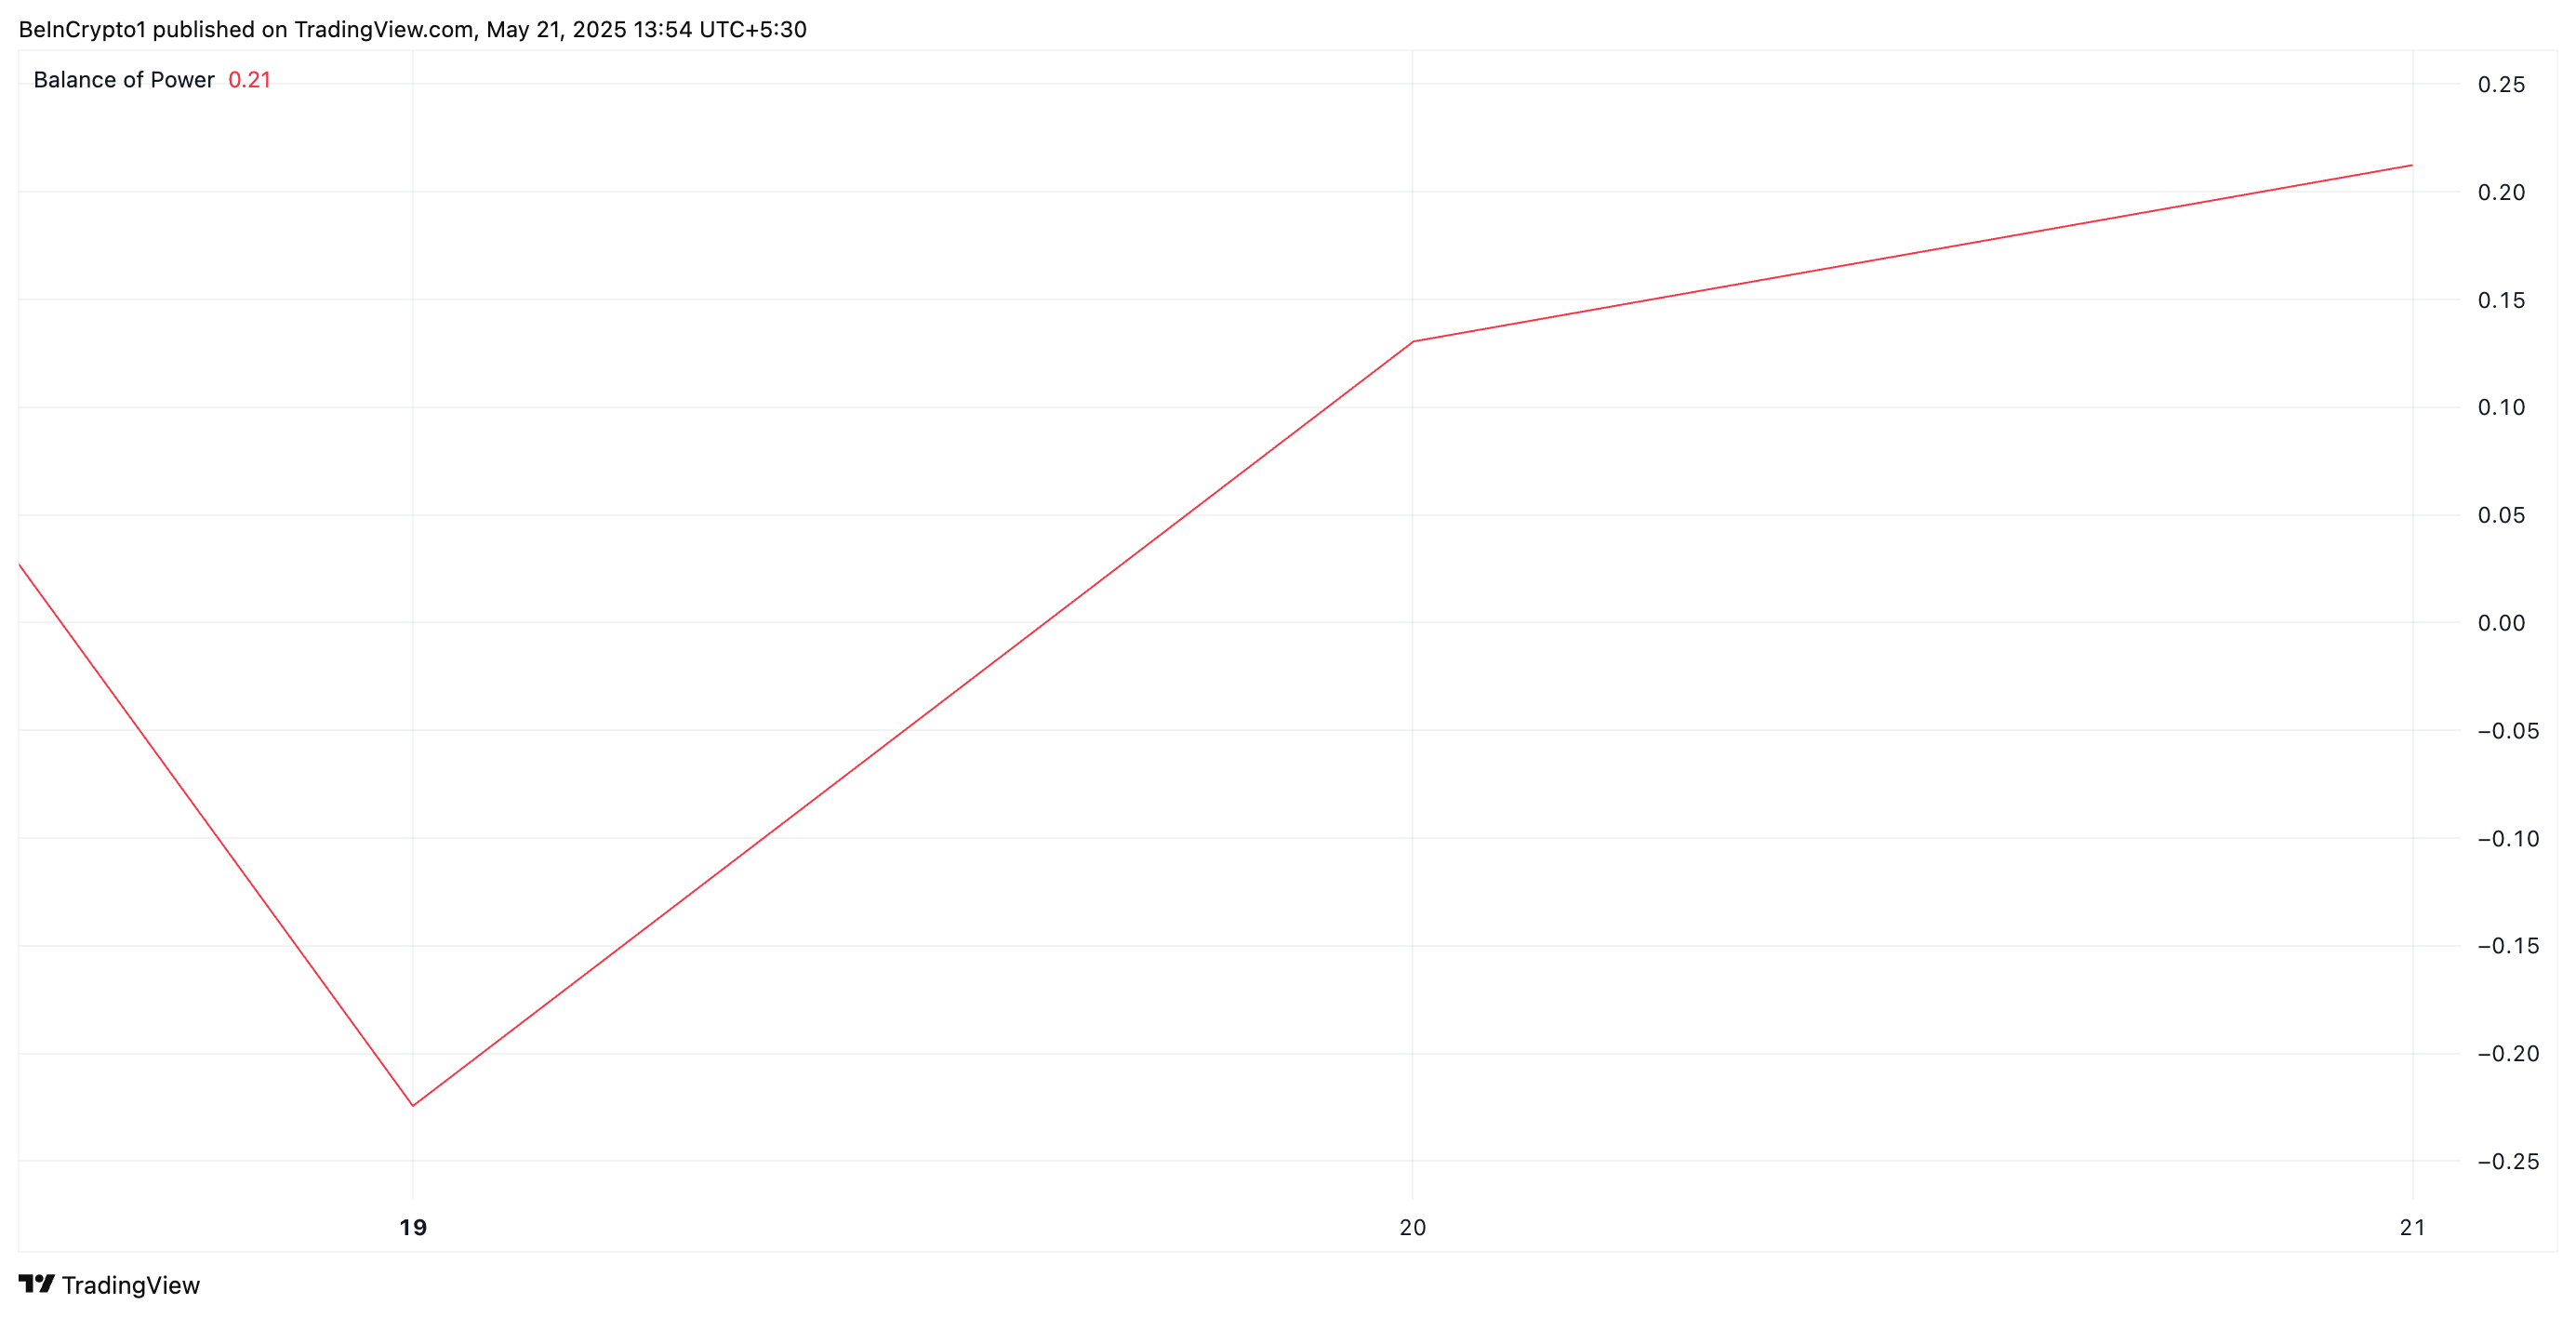
This indicates that HBAR buyers dominate the market and show stronger control over price action than sellers. It hints at the potential for a sustained upward move in the asset’s price.
Further, HBAR’s rising On-Balance Volume (OBV) confirms the growing buying pressure and positive momentum in the spot markets. As of this writing, the indicator is at 38.66 billion.
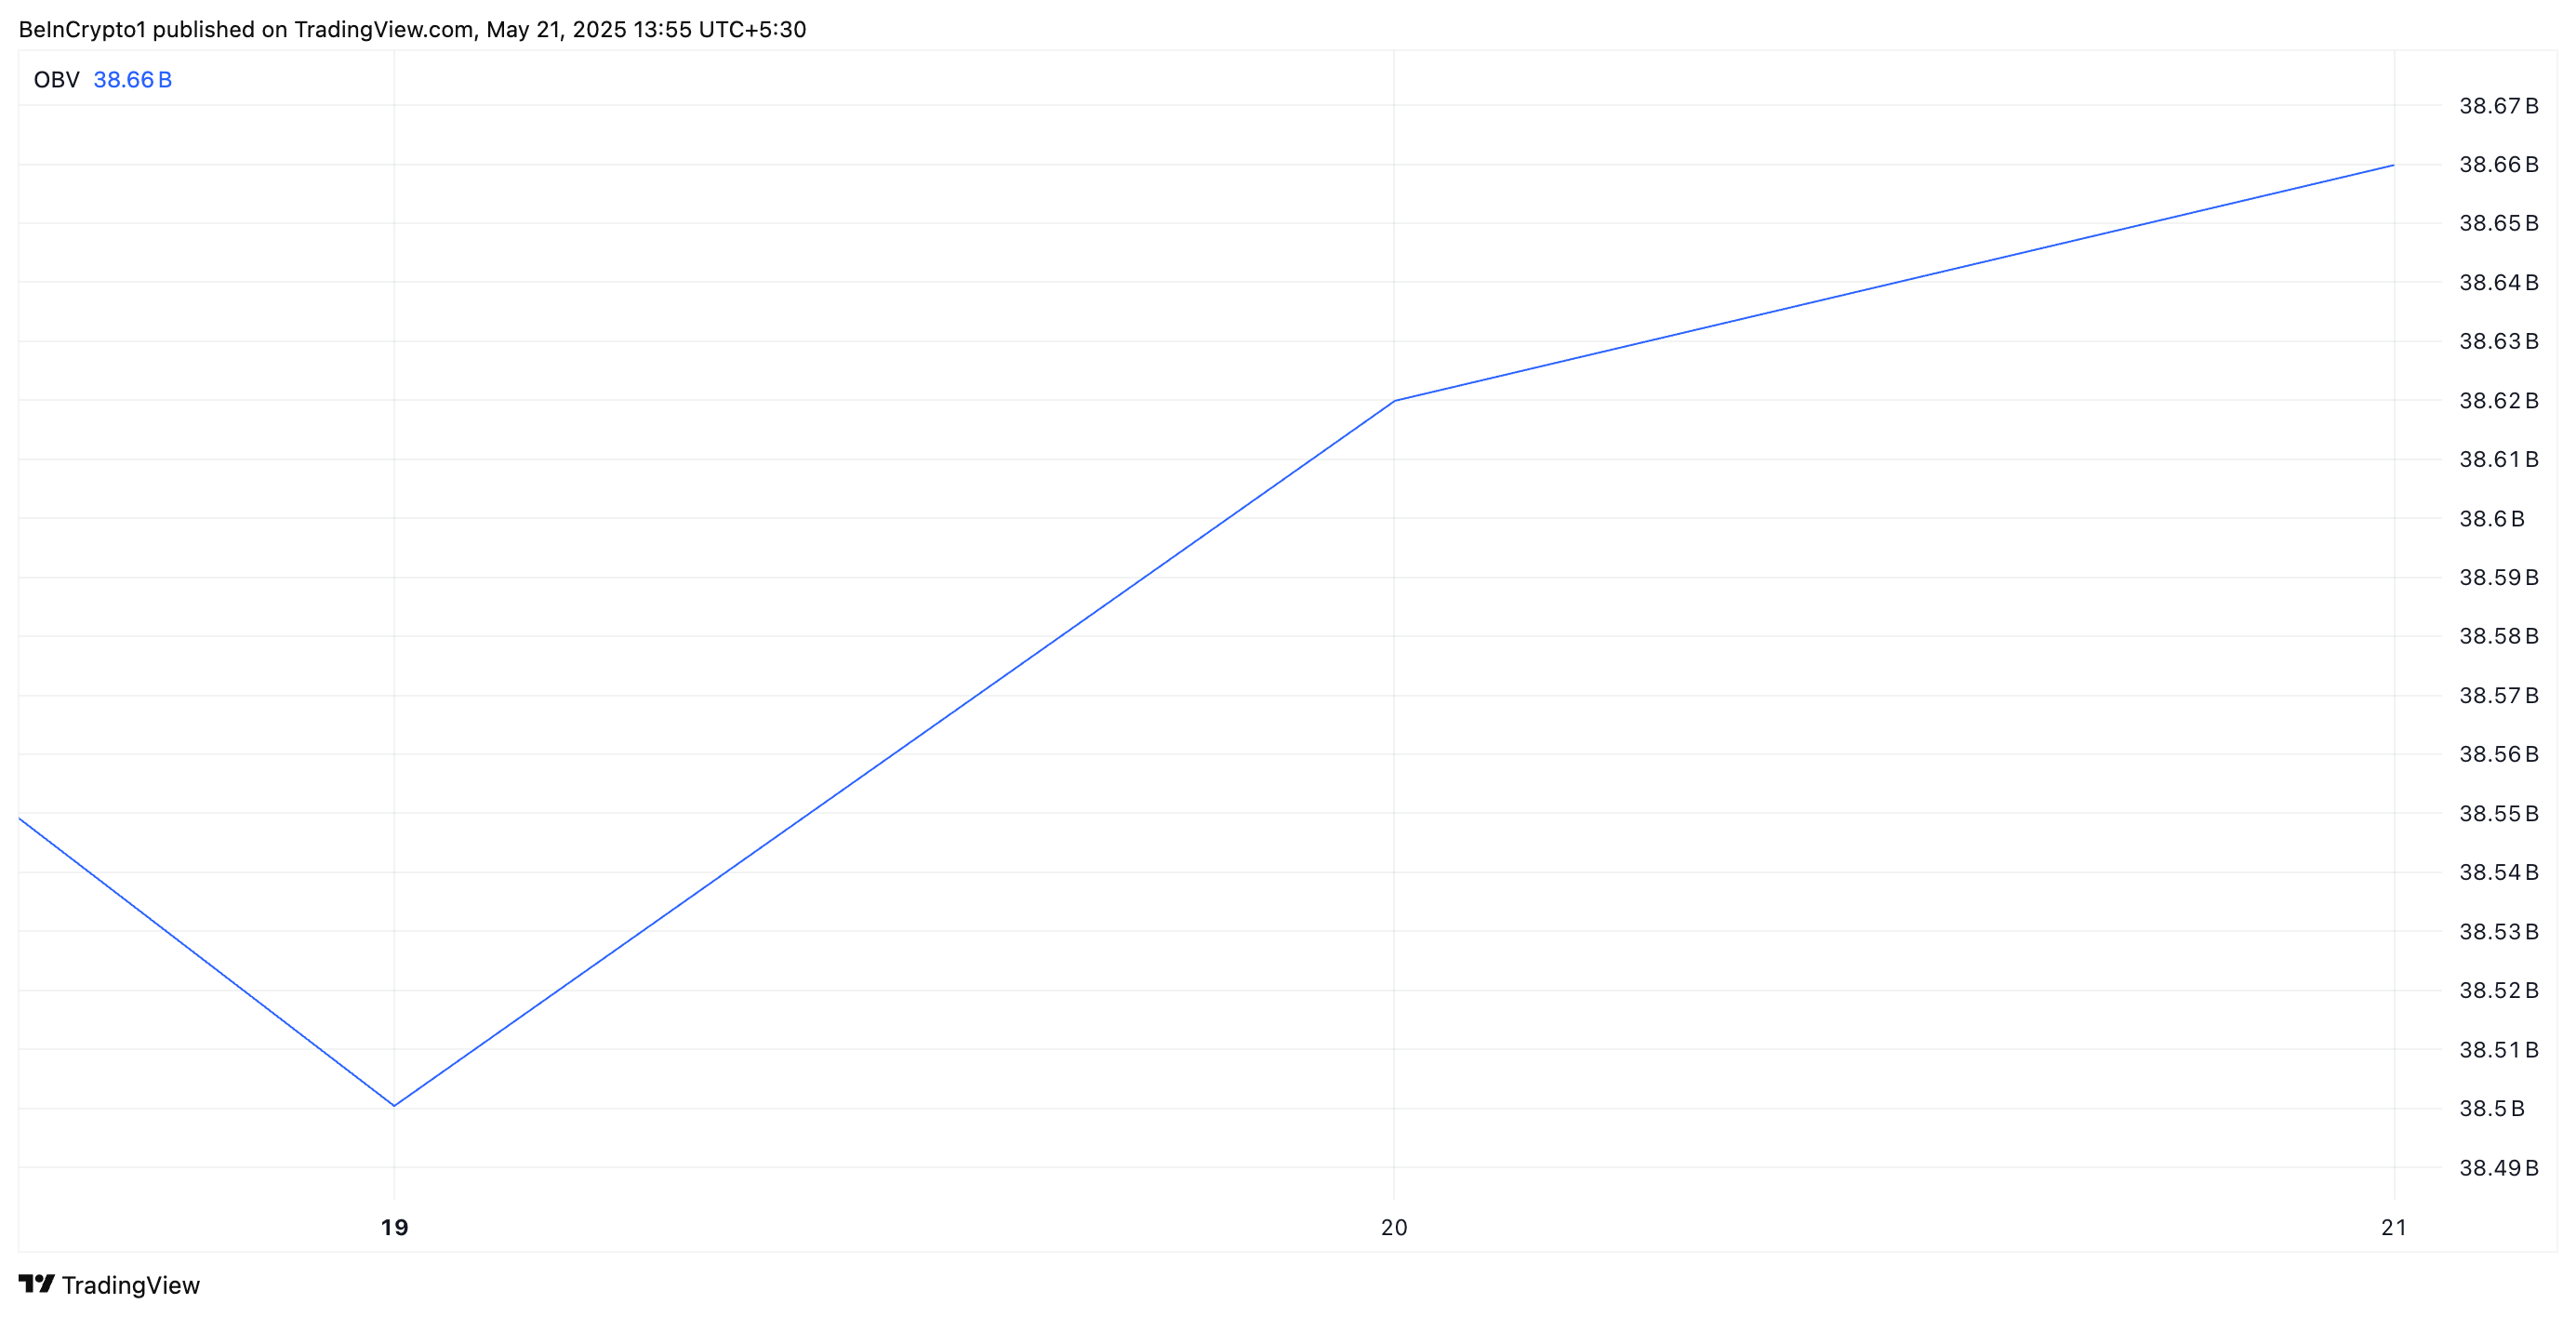
The OBV measures buying and selling pressure by tracking cumulative trading volume based on whether prices close higher or lower. When OBV climbs this way, it indicates that volume is flowing into the asset on up days, suggesting increasing demand and potential for a price rise.
Technical Indicator Signals Buyers Are Regaining Control
The steady rise in HBAR’s Relative Strength Index (RSI) reinforces the growing bullish momentum. Currently sitting at 52.53 and climbing, the indicator signals increasing buying pressure and a potential continuation of the upward trend.
The RSI indicator measures an asset’s overbought and oversold market conditions. It ranges between 0 and 100, with values above 70 suggesting that the asset is overbought and due for a price decline. Conversely, values under 30 indicate that the asset is oversold and may witness a rebound.
HBAR’s RSI reading indicates that the bulls are gradually regaining market dominance, which WOULD drive up its value in the near term. If this continues, HBAR could break above the $0.20 price mark to trade at $0.23.
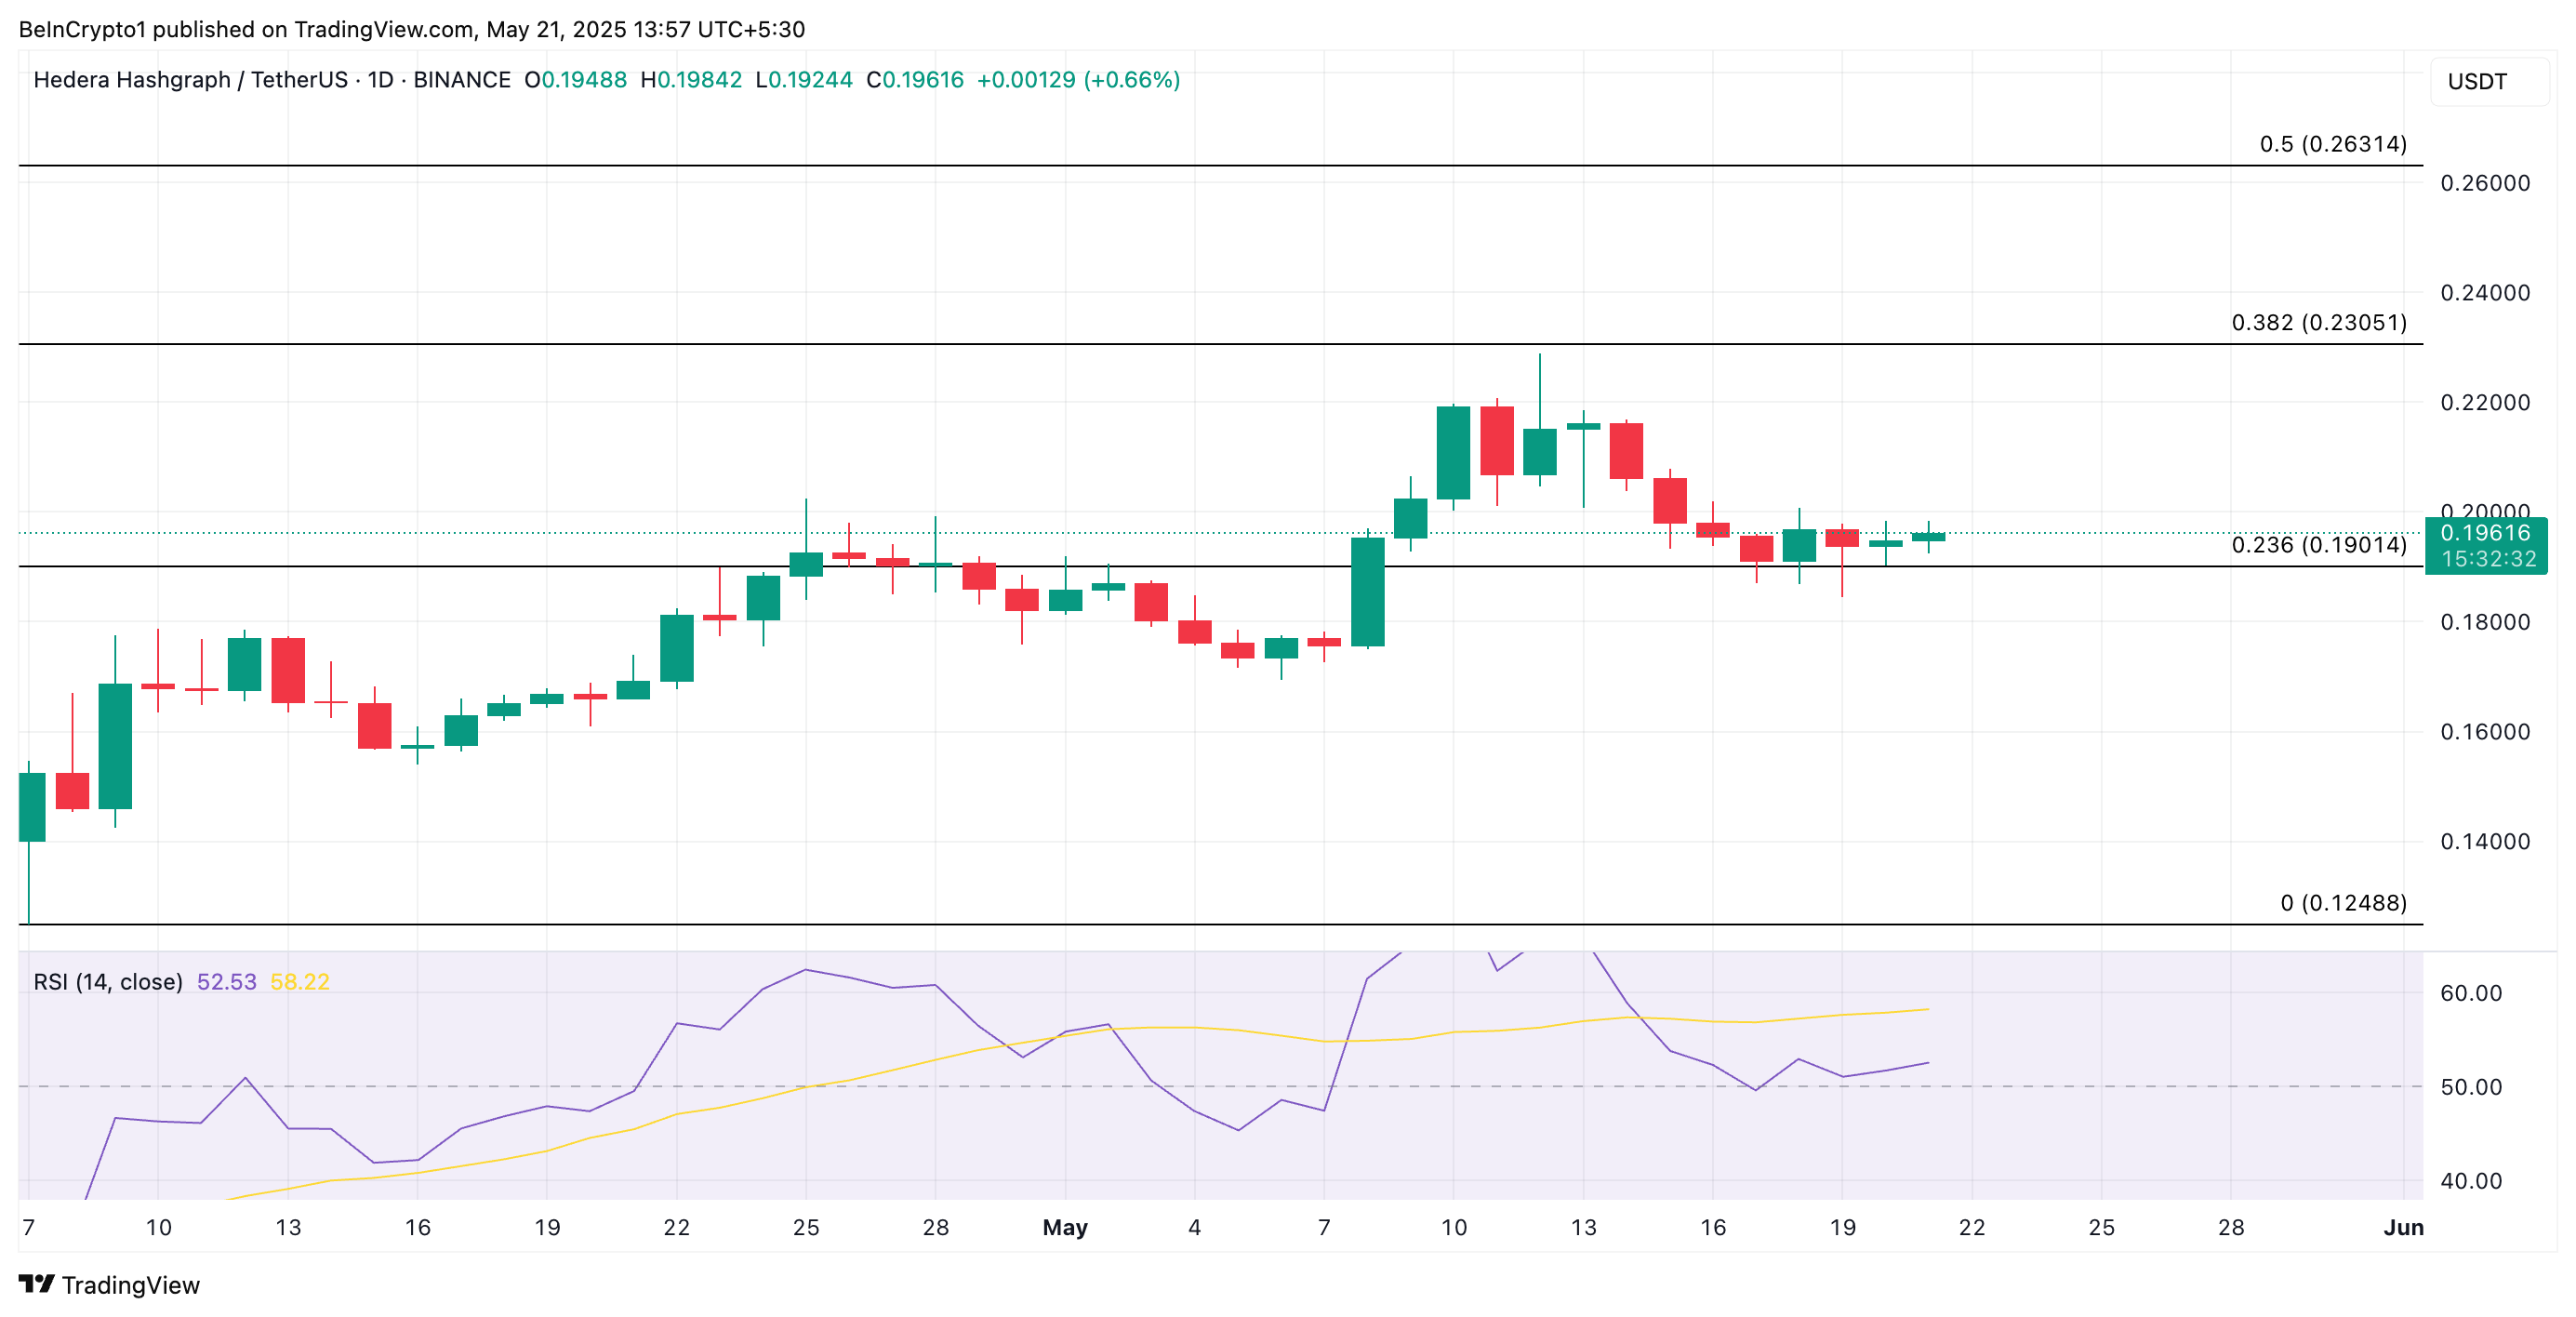
However, if selling activity intensifies, HBAR could resume its decline and break below $0.19. If bearish pressure strengthens, the altcoin could fall toward $0.12.

Log in to Reply
Log in to comment your thoughtsComments
Related Articles
|Square
Get the BTCC app to start your crypto journey
Get started today Scan to join our 100M+ users