XRP Teeters on Edge of Death Cross as Price Tumbles 8% in Seven Days

XRP’s chart flashes warning signals as a dreaded death cross looms—the kind of technical horror show that makes crypto traders reach for the antacids. Another week, another 8% nosedive. So much for ’digital gold.’
When the 50-day MA crosses below the 200-day, even the most bullish bagholders start sweating. Welcome to crypto’s version of a midlife crisis—where hopium meets hard reality.
Funny how these ’institutional adoption’ narratives vanish faster than a Bitcoin maximalist’s patience with altcoins. Maybe the SEC wasn’t the only thing holding XRP back after all.
XRP Futures Spark Manipulation Fears as RSI Signals Weakening Momentum
Analysts warn that the launch of XRP futures on the CME could enable price manipulation. Tactics like naked shorting and rehypothecation are a major concern.
Similar futures launches for Bitcoin and ethereum led to sharp price drops. Critics fear XRP could follow the same path, especially around expiration dates when whales often push prices down.
Despite this, some see XRP futures as a step toward institutional adoption and a possible spot ETF.

XRP’s Relative Strength Index (RSI) is currently at 42.34, up from 35.18 two days ago but down from 52.32 yesterday.
The RSI is a momentum oscillator that ranges from 0 to 100 and is used to evaluate whether an asset is overbought or oversold; readings above 70 suggest overbought conditions, while readings below 30 indicate oversold territory.
At 42.34, XRP is neither overbought nor oversold, but the recent dip from 52.32 may suggest weakening momentum or early signs of bearish pressure. If the RSI continues to fall, it could indicate further downside risk in the short term.
XRP Faces Resistance as Ichimoku Signals Align Bearish
The Ichimoku Cloud chart reveals a bearish shift in momentum. The price is currently trading below the blue Tenkan-sen (conversion line) and the red Kijun-sen (base line), indicating short-term and medium-term weakness.
Additionally, the Kumo (cloud) ahead has turned red and widened slightly, reflecting growing resistance and potential downward pressure in the NEAR future.

The Chikou Span (green lagging line) is also positioned below the price and cloud, which confirms the bearish outlook from a lagging perspective.
With the price struggling to stay above the cloud and unable to break through key resistance levels, the setup suggests that XRP is still in a corrective phase.
Unless it can reclaim the Tenkan-sen and move decisively into the cloud, downside risk remains elevated.
XRP Traders Eye Death Cross Formation as Support Gets Closer
XRP’s EMA lines are beginning to converge, and a potential death cross—where the short-term EMA crosses below the long-term EMA—could soon confirm a bearish trend.
If this formation occurs, xrp price may test the support level at $2.30.
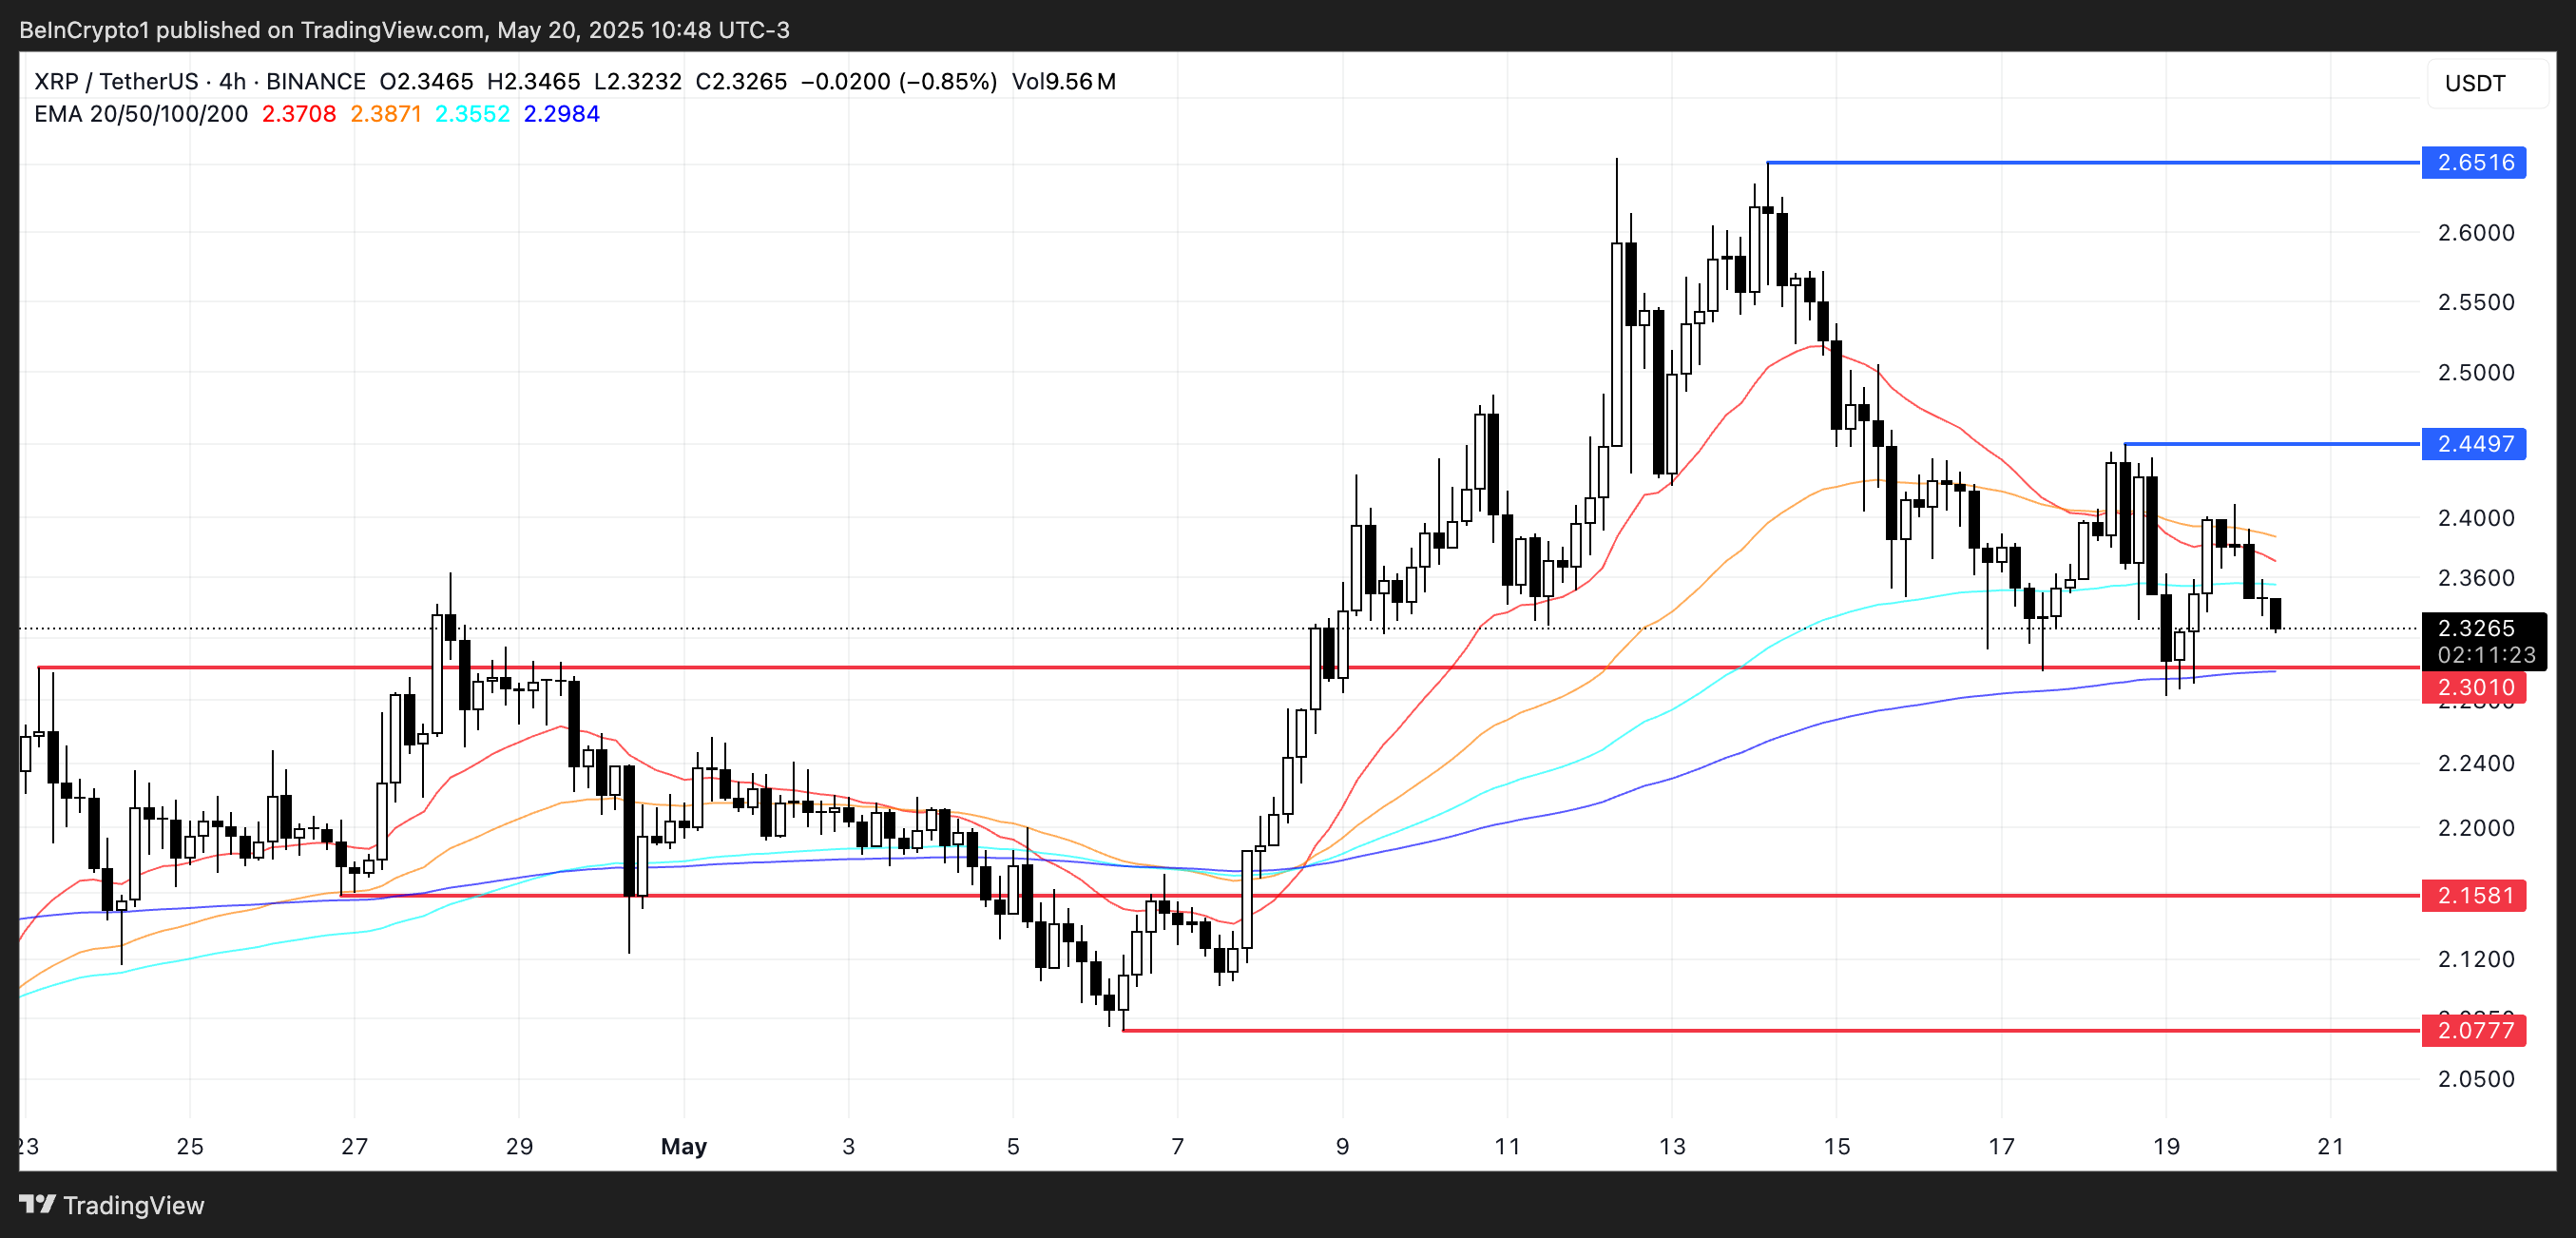
A breakdown below that could open the door to further declines toward $2.158, and in the case of strong downward momentum, possibly as low as $2.07.
However, if it can reverse course and regain bullish momentum, the first key resistance to watch is $2.449.
A clean break above this level WOULD improve the technical outlook and could trigger a rally toward $2.65—an upside of approximately 14%.

Log in to Reply
Log in to comment your thoughtsComments
Related Articles
|Square
Get the BTCC app to start your crypto journey
Get started today Scan to join our 100M+ users