Bitcoin Devours Market Attention as Altcoins Gasp for Air

BTC’s dominance hits yearly highs while ’diversified’ portfolios bleed—turns out Wall Street’s ’hedge’ was just gambling with extra steps.
Market Analysis: The king crypto’s 30-day rally leaves ETH, SOL, and other ’Ethereum killers’ eating dust. Trading volumes suggest institutional money’s flooding into BTC futures like it’s 2021 all over again.
Behind the Numbers: Altcoin liquidity is evaporating faster than a meme coin founder’s credibility. Even stablecoin pairs show thinning order books—bad news for traders who thought ’Web3’ meant more than just JPEG speculation.
Closing Thought: When the SEC finally greenlights a spot ETF, expect Bitcoin to moon while ’utility tokens’ get reclassified as securities—and bagholders learn the hard way that ’decentralization’ was never in the fine print.
Bitcoin Season is in Full Swing
According to data from Blockchain Center, the cryptocurrency market remains deep in “Bitcoin Season,” a period when BTC significantly outperforms the broader altcoin market.
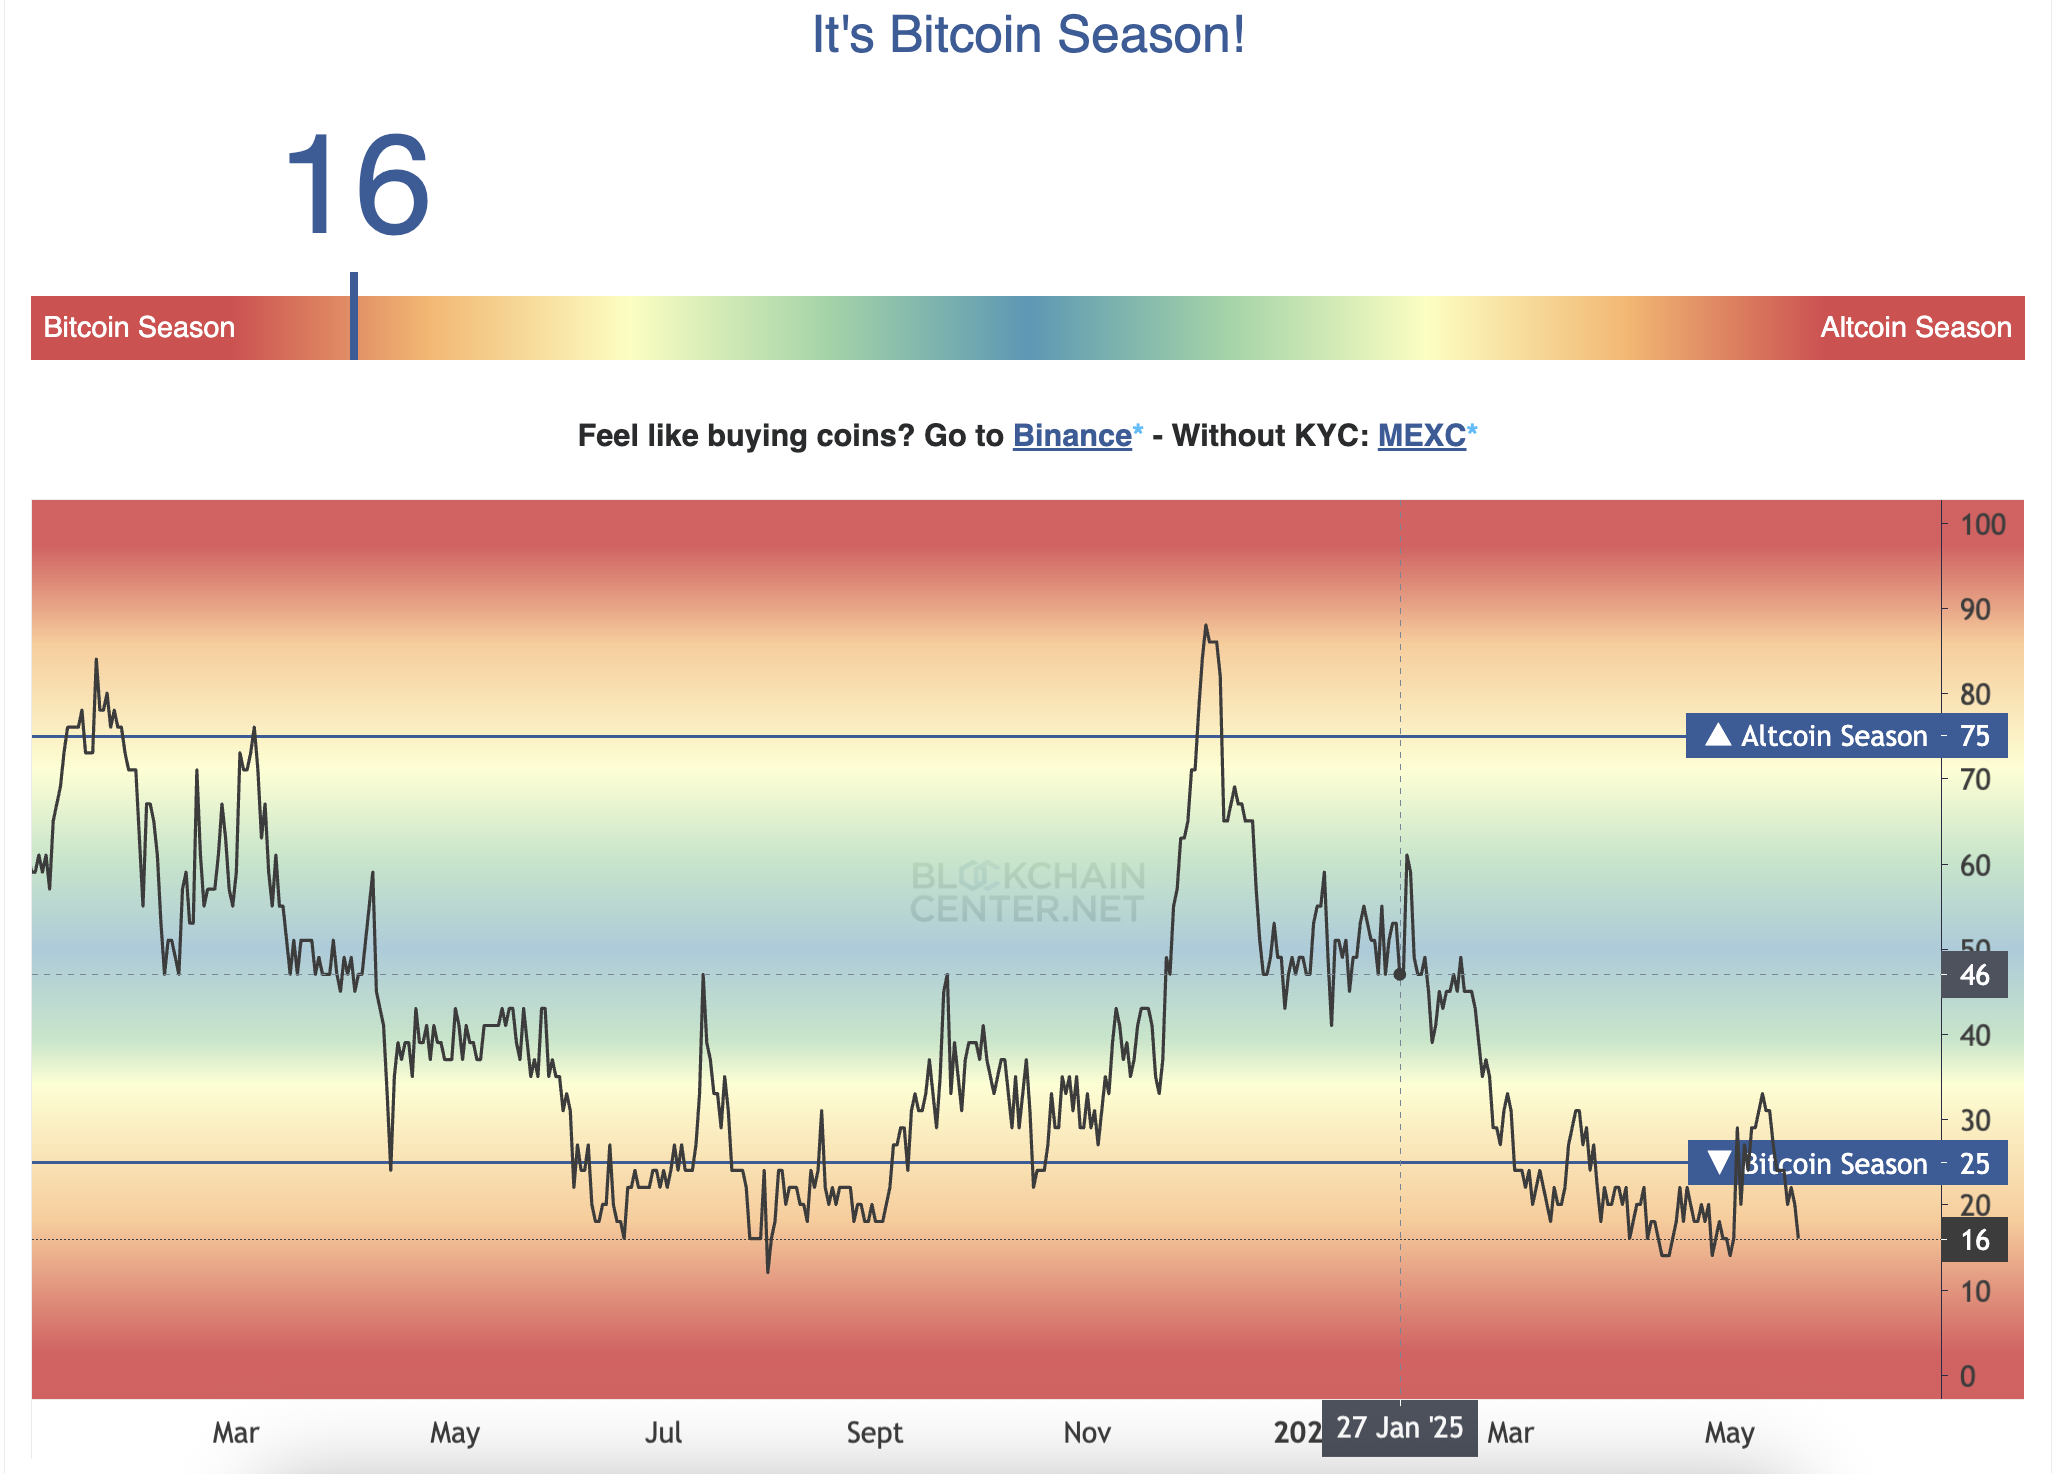
As of this writing, only 16 (32%) of the top 50 altcoins have outperformed BTC over the past 90 days, far below the 75% threshold required to qualify as “Altcoin Season.”
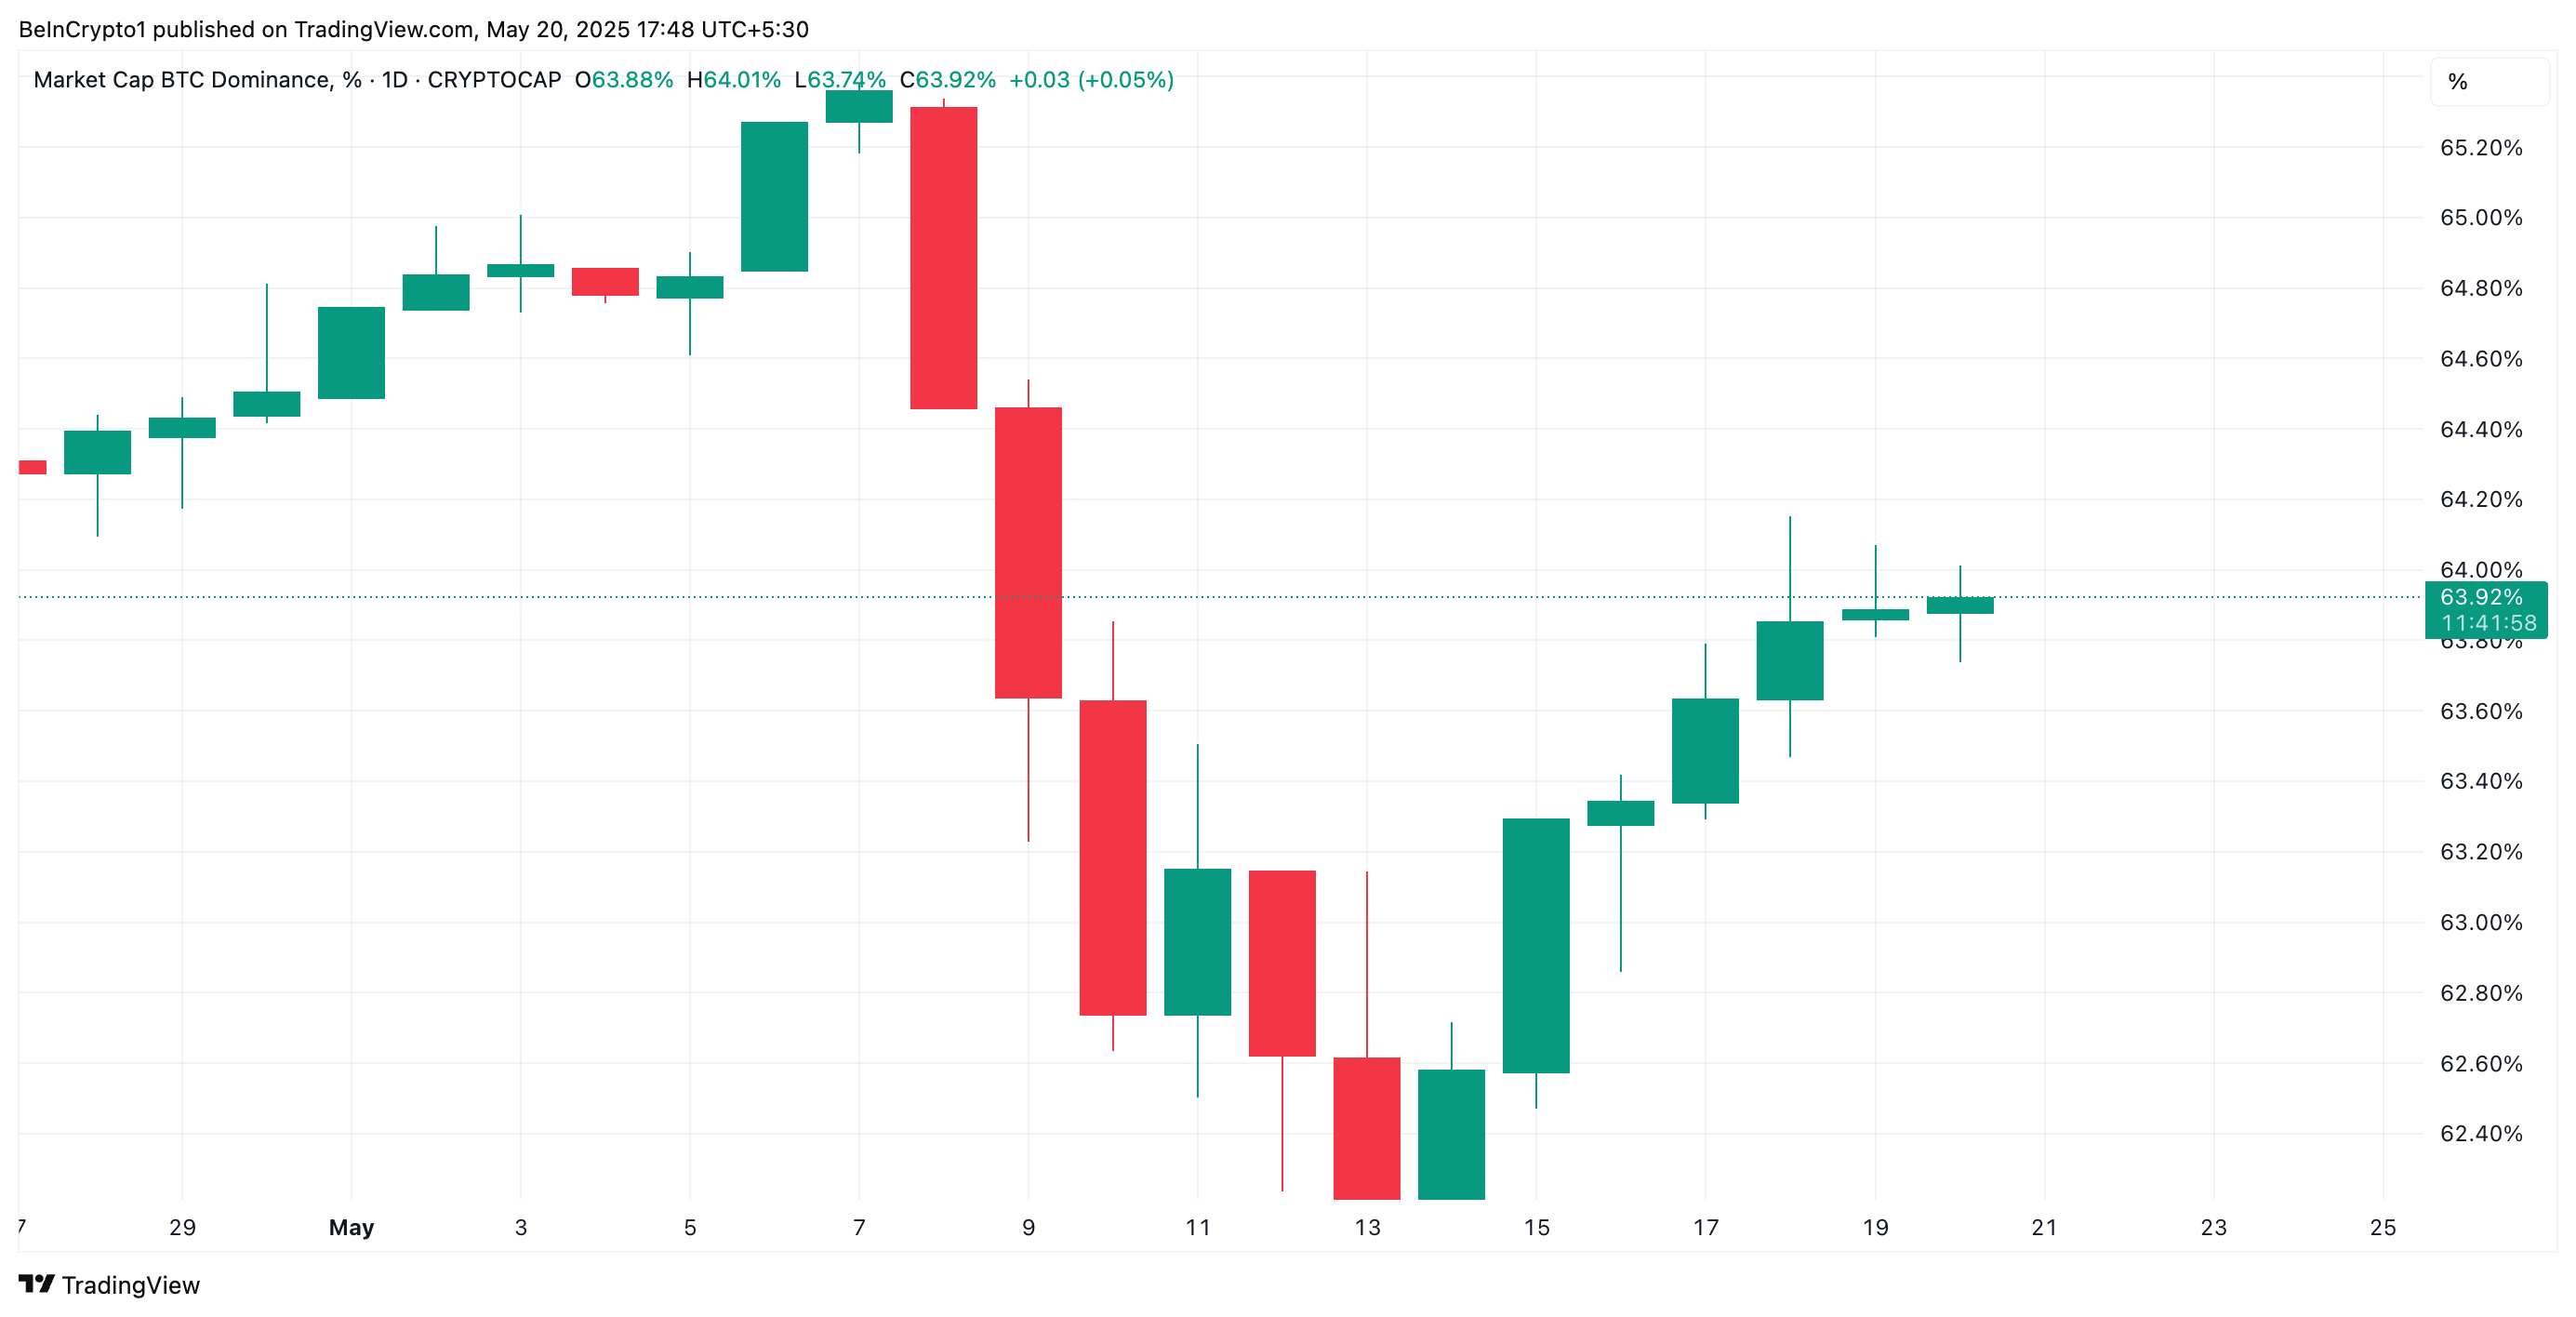
Furthermore, Bitcoin’s rising dominance supports this position. Since plunging to a two-month low of 61.89% on May 16, BTC.D, a metric that tracks BTC’s share of total crypto market capitalization, has climbed steadily.
As of this writing, the metric stands at 63.92%.
Interestingly, since May 14, TOTAL2, which measures the combined market cap of all cryptocurrencies excluding BTC, has trended downward. Currently standing at $1.18 trillion, it has plunged $83 billion over the past week.
This divergence suggests market participants are increasingly reallocating capital into BTC over altcoins.

The current trend signals that traders are doubling down on BTC’s resilience, especially as the king coin attempts to stabilize above the key $105,000 price mark.
BTC’s DMI Points to Strong Buying Pressure
On the daily chart, BTC’s Directional Movement Index (DMI) confirms the bullish pressure in the market. As of this writing, the coin’s positive directional index (+DI, blue) rests above its negative directional index (-DI, orange).
When an asset’s DMI is set up this way, it indicates that bullish momentum is stronger than bearish momentum. This signals a prevailing uptrend and buying pressure in the BTC market.
If this continues, its price could attempt to breach the resistance at $107,048, and rally toward its all-time high of $109,588.
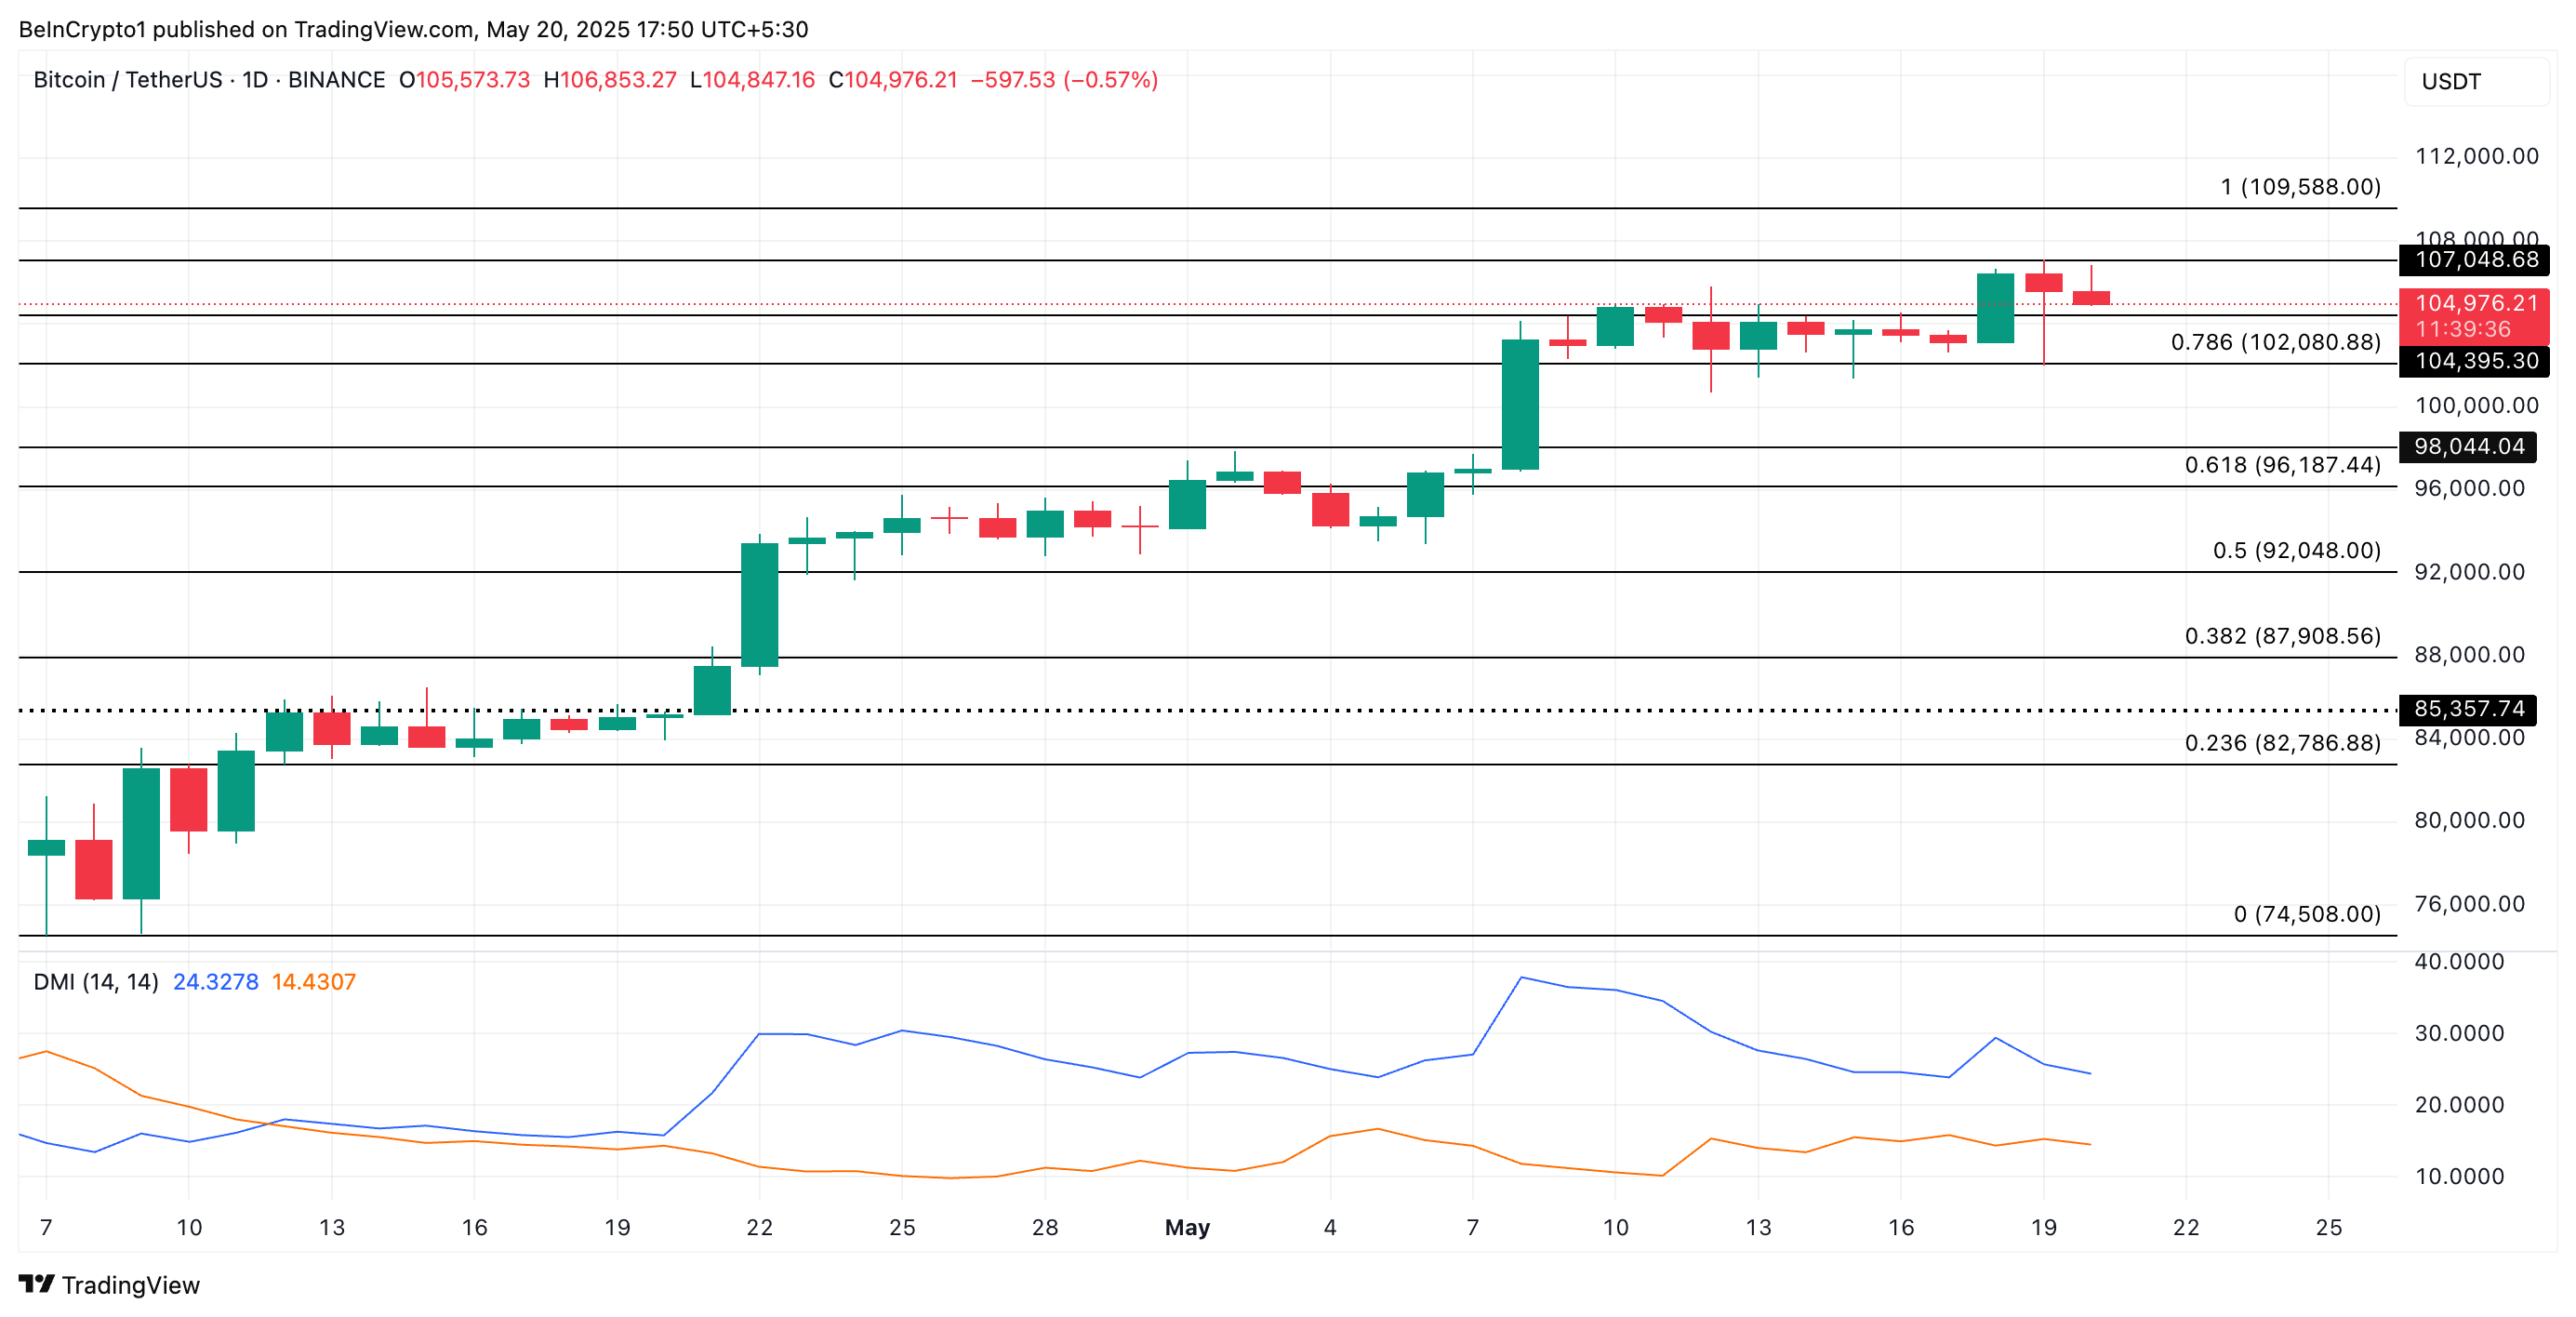
On the other hand, if sell-offs strengthen, BTC’s price could dip to $102,080.
