PI Crashes 50% in Seven Days – Here’s Why the Bleeding Isn’t Over

Another day, another crypto bloodbath. PI joins the dumpster fire with a brutal 50% nosedive this week—and charts suggest more pain ahead.
Technical indicators scream ’oversold,’ but in crypto-land, ’oversold’ just means ’cheaper entry for degens.’ The 200-day moving average? Sliced through like a hot wallet exploit. Support levels? More like suggestions.
Meanwhile, Bitcoin maximalists are (predictably) smug while altcoin bagholders perform the time-honored ritual of checking block explorers and praying for a miracle. Pro tip: When your ’utility token’ moves like a leveraged shitcoin, maybe reconsider your life choices.
Silver lining? At least the drop cleared out some leverage—not that traders ever learn their lesson. Next stop: either a dead cat bounce or the abyss. Place your bets.
PI Faces Heavy Selling Pressure
PI’s BBTrend remains in the red on the daily chart, confirming that bearish forces are firmly in control. Observed on a one-day chart, the indicator is currently at -19.36.
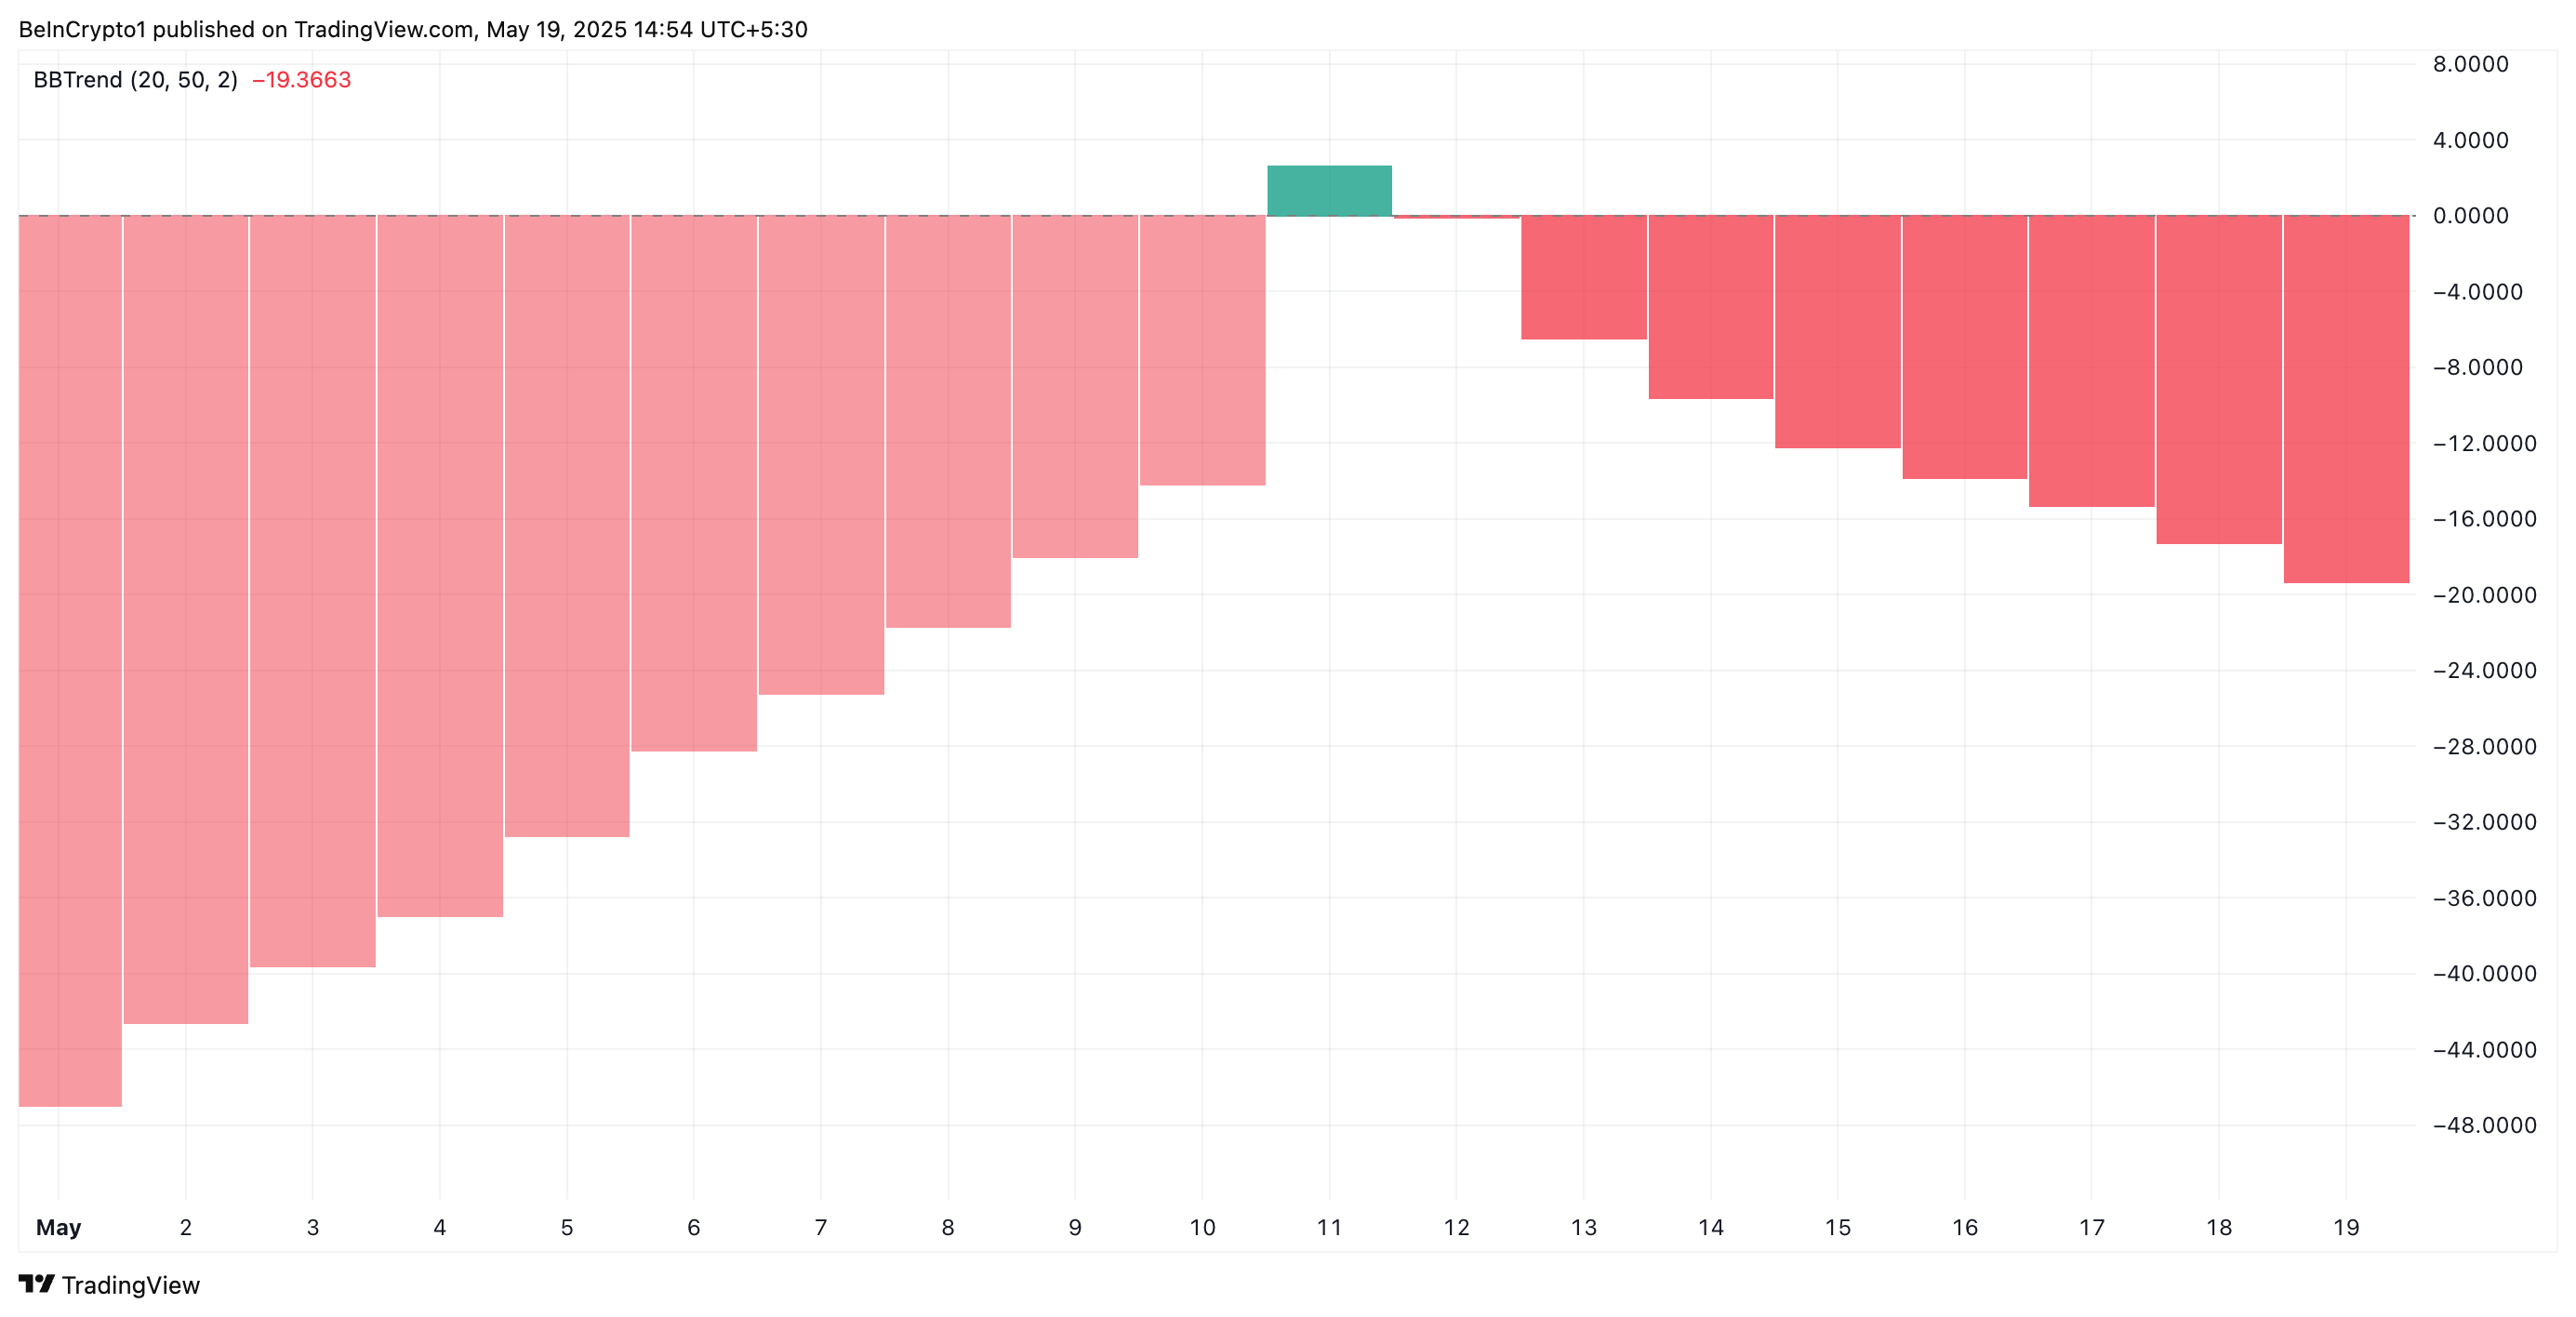
The BBTrend measures the strength and direction of a trend based on the expansion and contraction of Bollinger Bands. When BBTrend values are positive, it signals a strong uptrend, while negative values indicate increasing bearish momentum.
PI’s negative BBTrend suggests that its price consistently closes NEAR the lower Bollinger Band, reflecting sustained selling pressure and hinting at the potential for further downside.
Furthermore, the token’s Elder-Ray Index supports this bearish outlook. At press time, the indicator returns a negative value of -0.12.
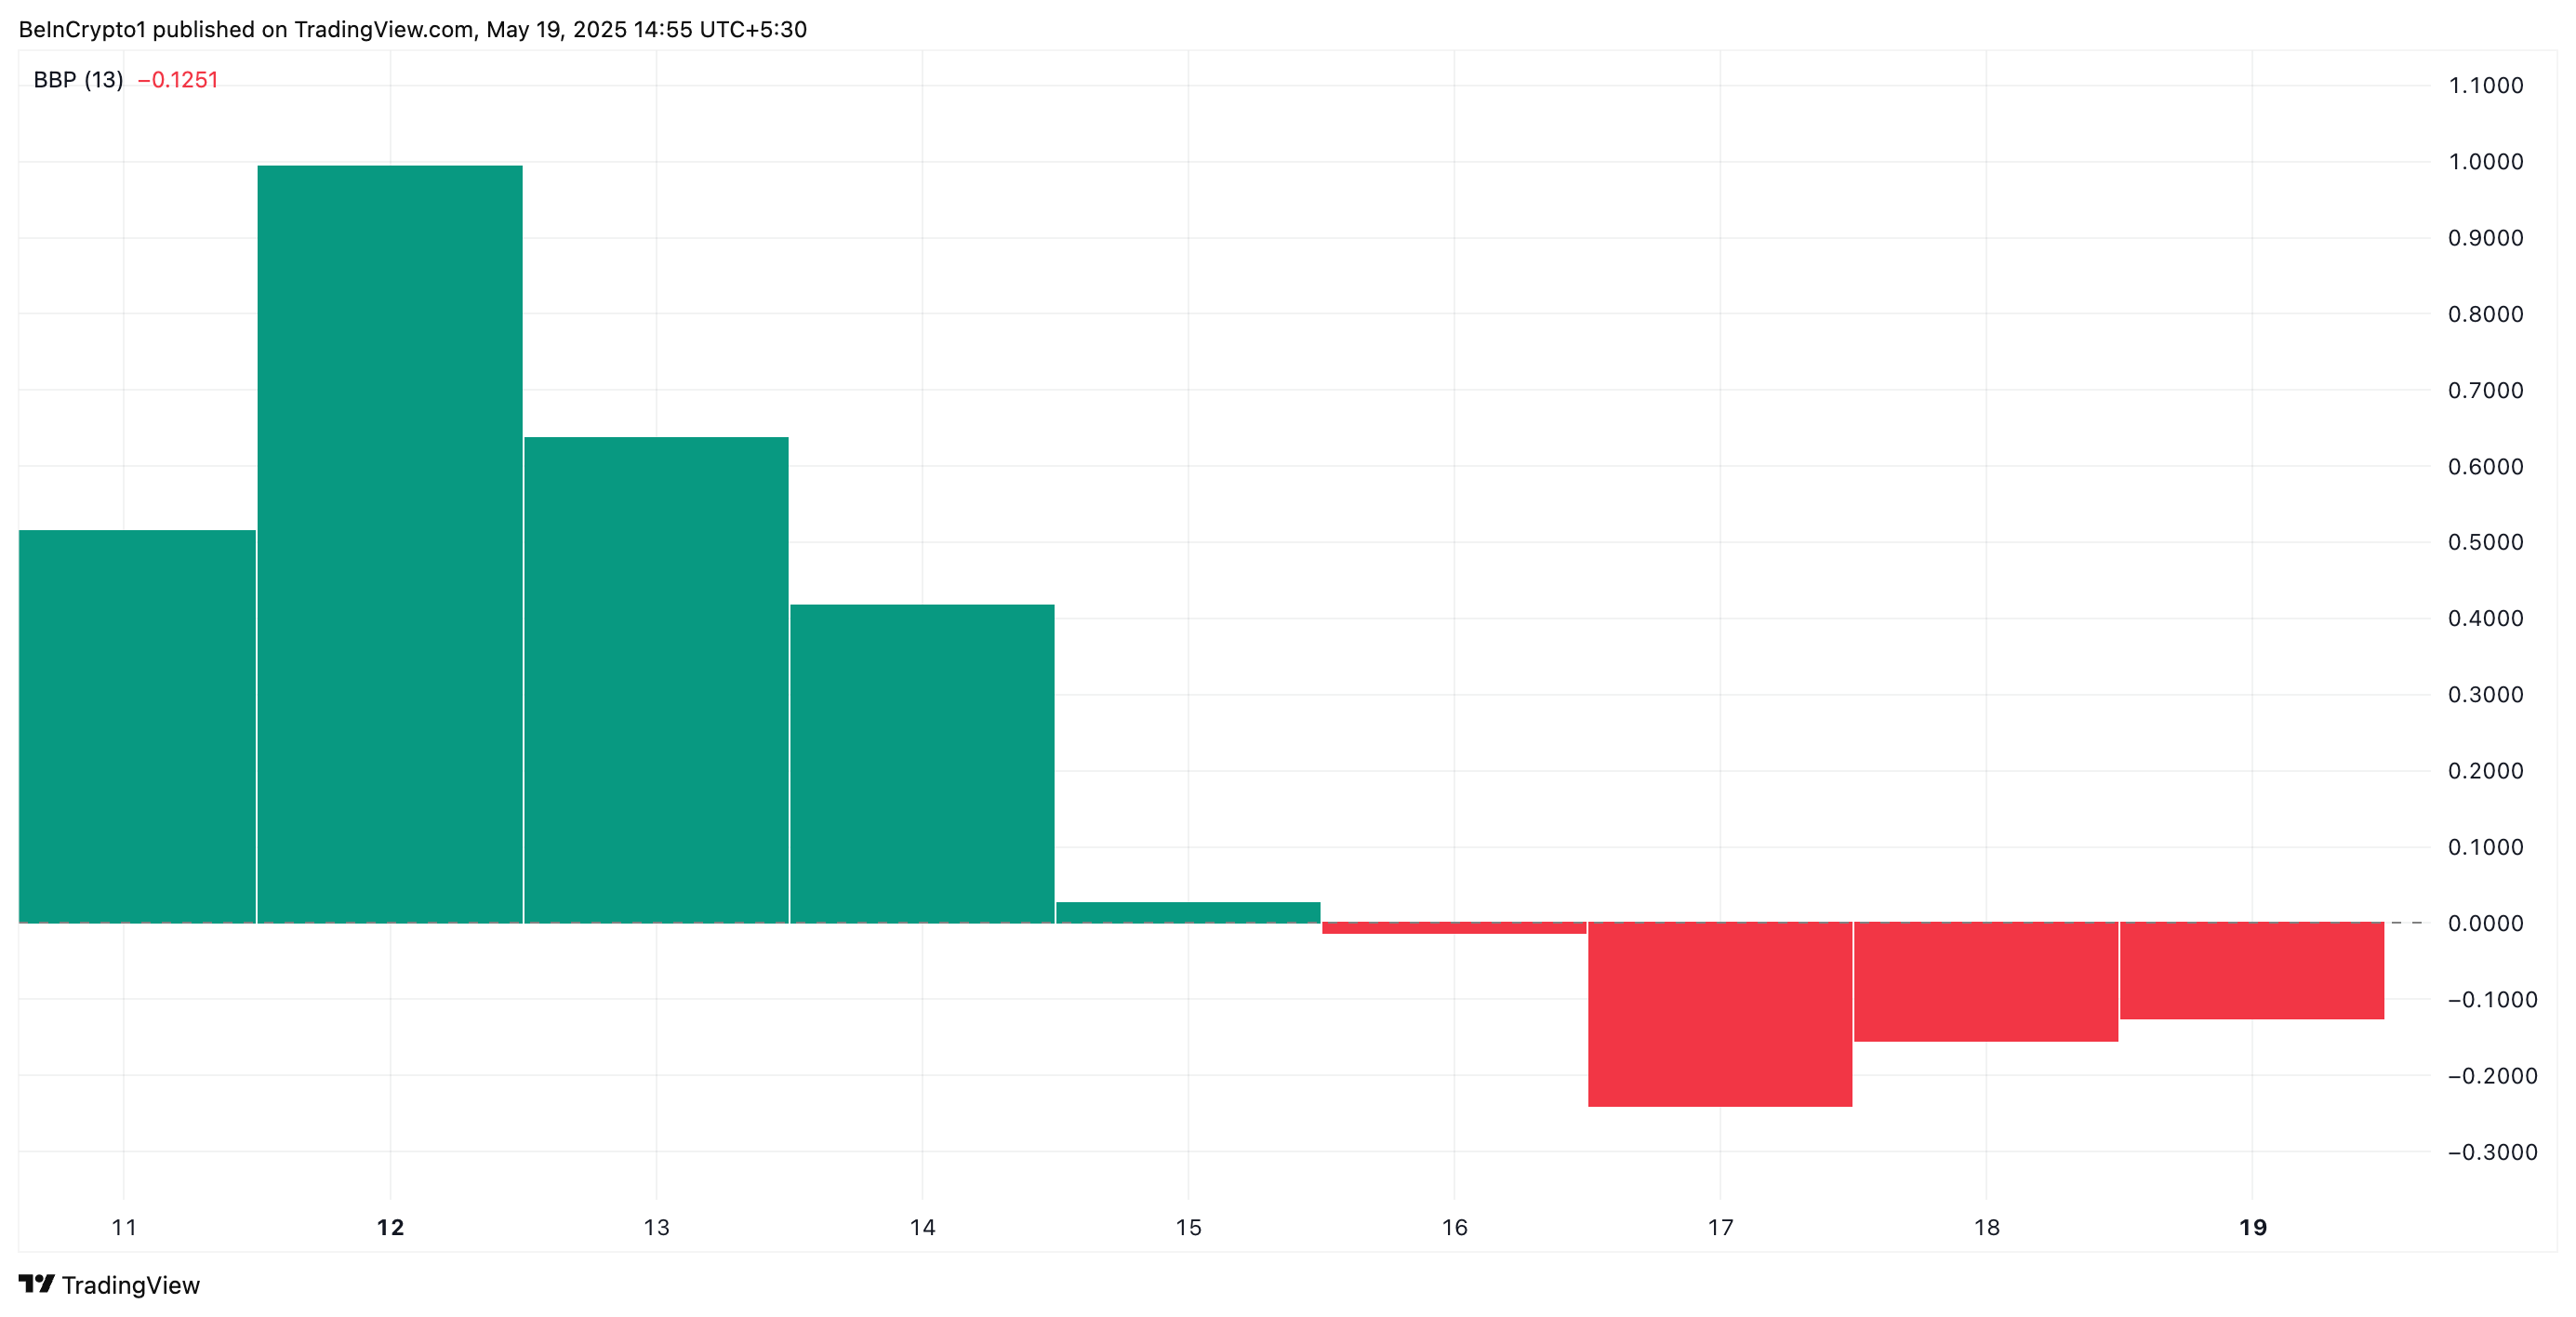
The Elder RAY Index measures the strength of buying and selling pressure in the market, using two key components: Bull Power and Bear Power.
When the index is negative, sellers dominate the market. This signals a bearish trend and hints at a continued downward momentum for PI.
Resistance at 20-Day EMA Caps Recovery Hopes
The Pi token trades below its 20-day exponential moving average (EMA), which forms dynamic resistance above it. The 20-day EMA measures an asset’s average price over the past 20 trading days, giving more weight to recent prices.
When an asset trades below its 20-day EMA, recent price action is weaker than the short-term trend. This is a bearish signal indicating a lack of buying momentum.
If the trend continues, PI could fall to $0.55.
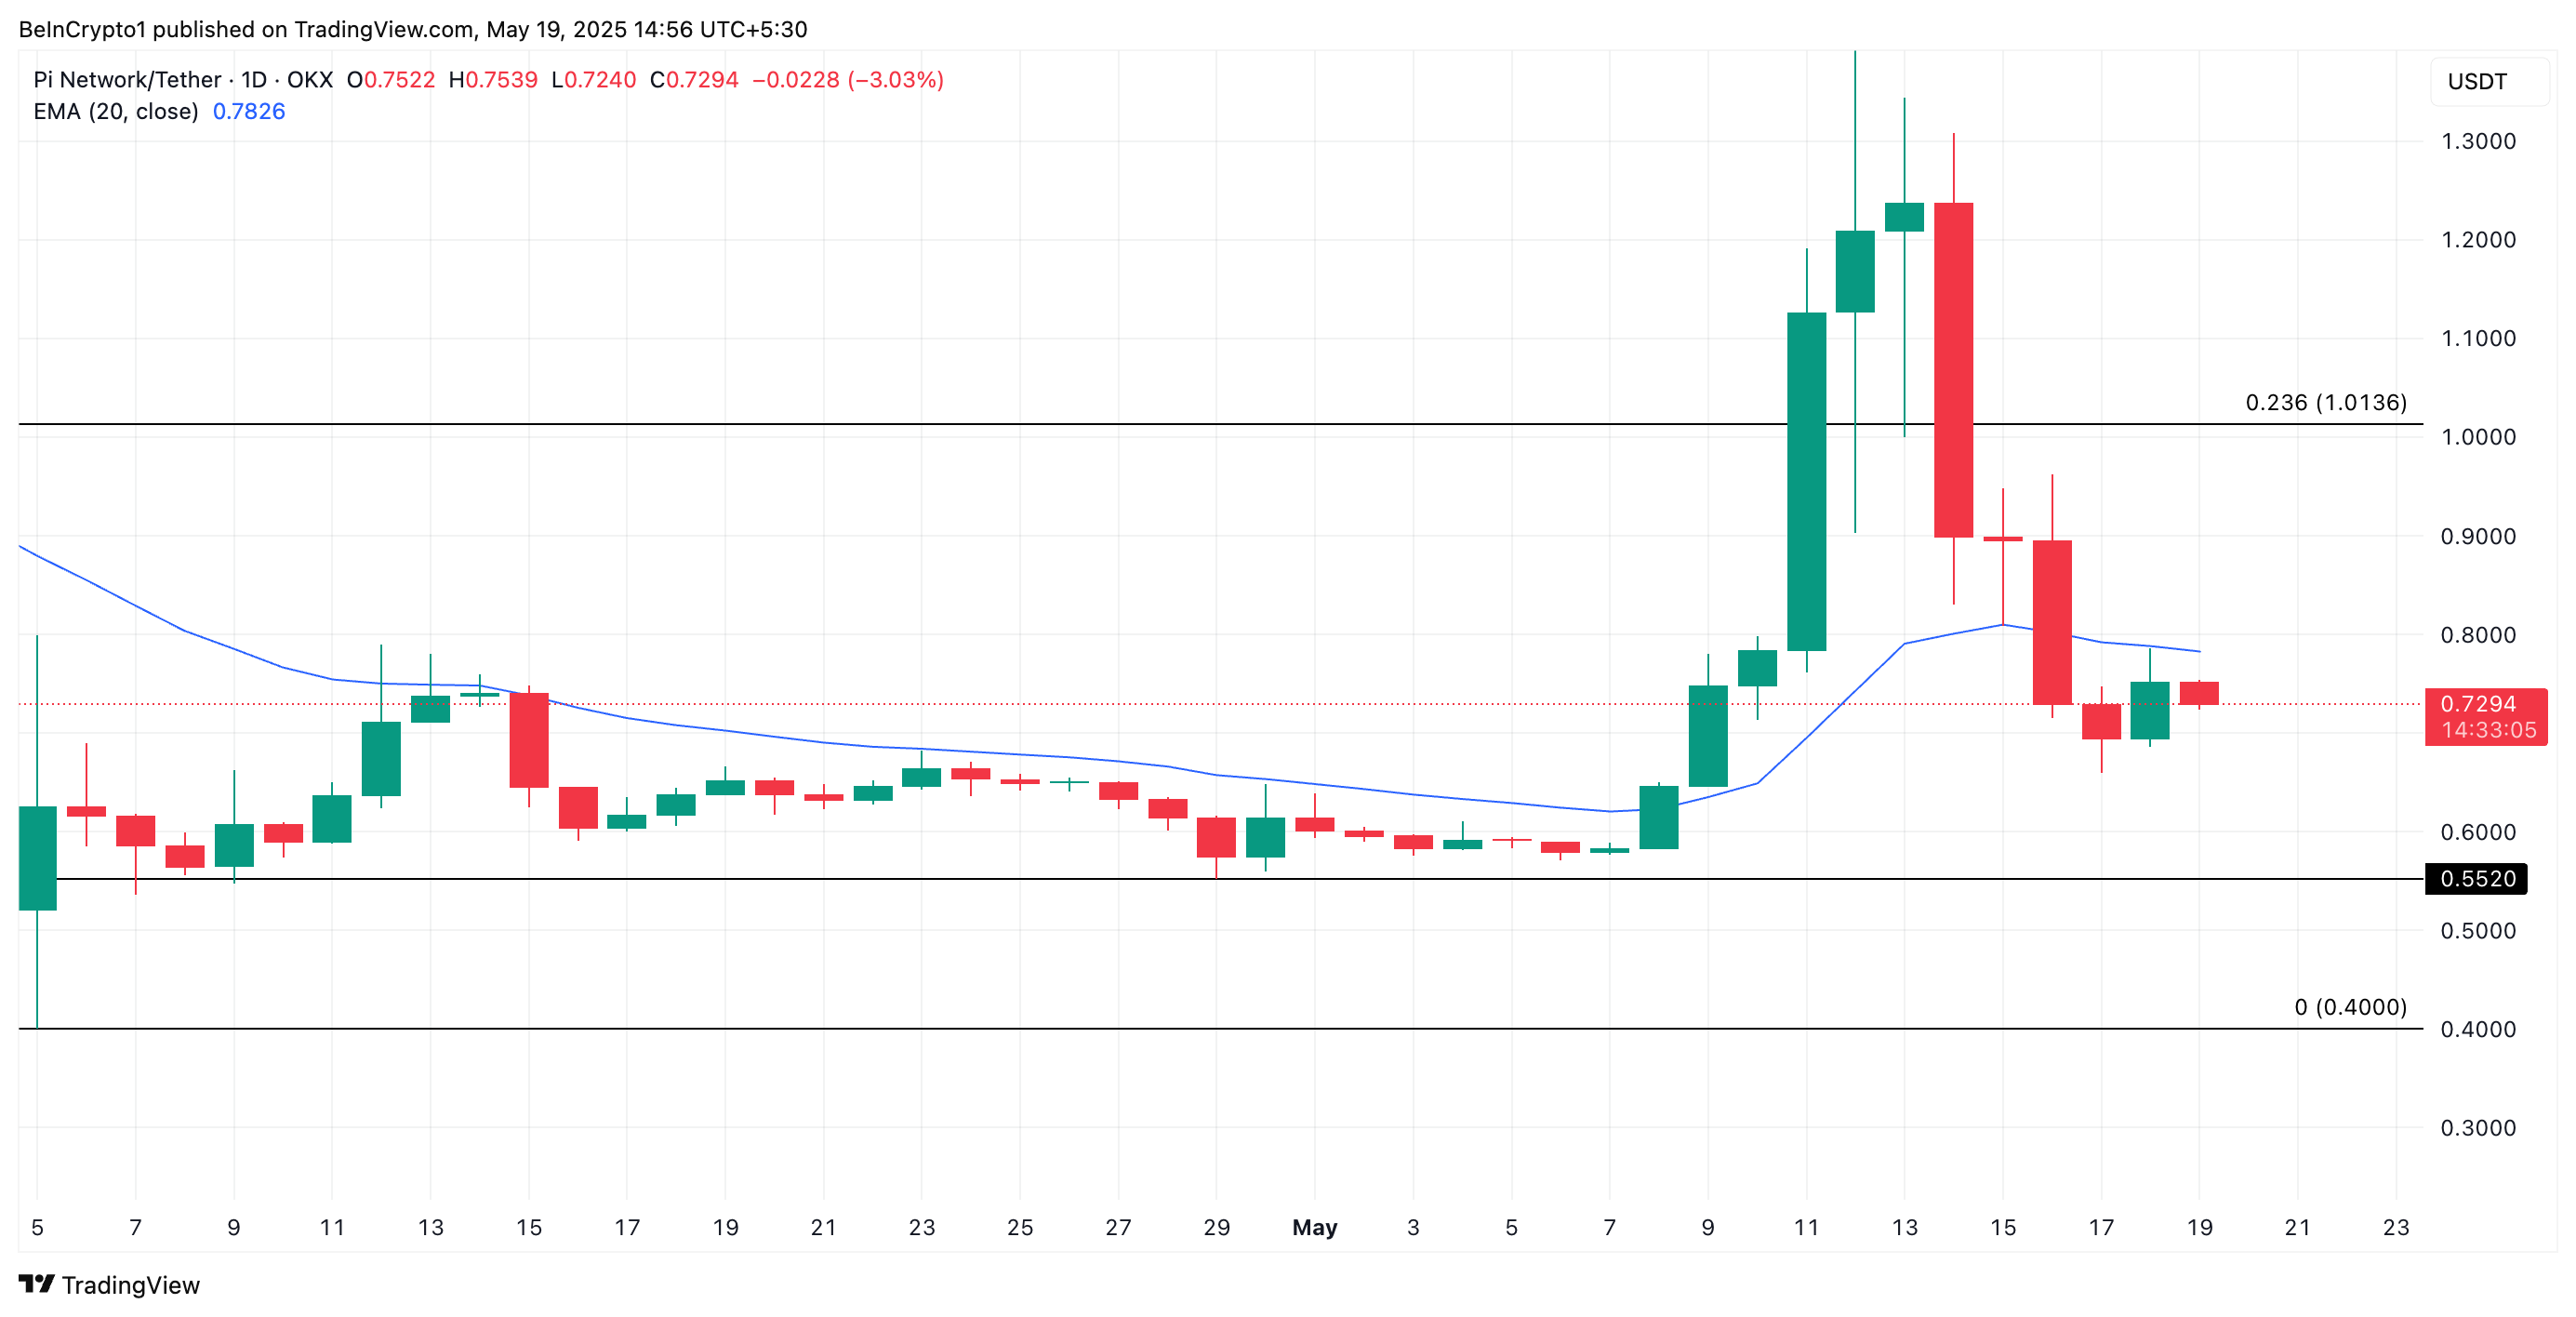
On the other hand, if buying pressure spikes, the PI token could rebound and climb to $1.01.
