Bitcoin’s 2025 Price Crossroads: Three Scenarios That Could Propel BTC to $175K

Bull case: Institutional FOMO meets halving scarcity, pushing BTC to new ATHs. Wall Street finally ’gets it’—just as retail gets priced out.
Base case: Steady adoption and ETF inflows create a $100K floor. The SEC grudgingly approves more products while complaining about volatility.
Bear case: Macro headwinds and regulatory crackdowns cap gains. (Bonus jab: TradFi banks launch ’Blockchain 2.0’—it’s just a SQL database with worse UX.)
One thing’s certain: Bitcoin won’t care about your price prediction models.
Positive Forecasts from Experts and Market Signals
Bitcoin (BTC) is showing promising prospects as numerous positive signals from the market and expert predictions emerge in early May 2025. In an analysis by AxelAdlerJr, as of today, on-chain momentum is in the “starting” phase of a bull run.
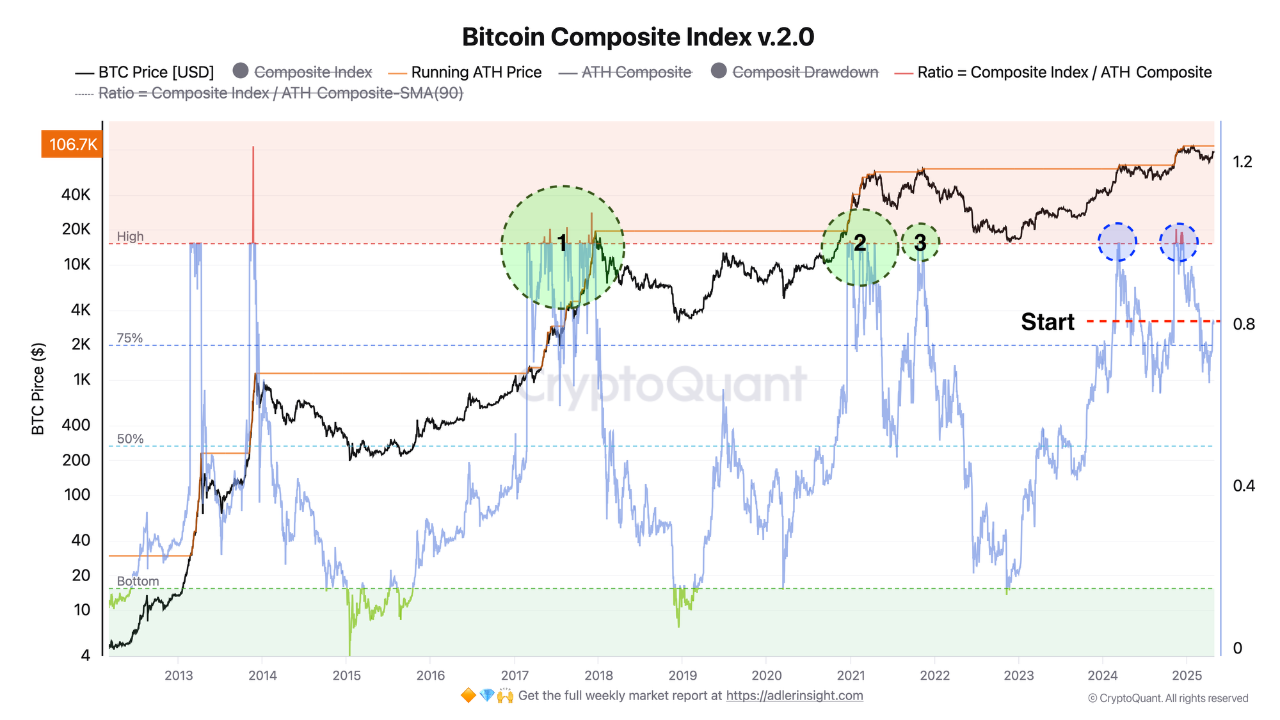
The Bitcoin Composite Index currently stands at ≈ 0.8 (80%). Based on this indicator, AxelAdlerJr outlined three possible scenarios.
In the most optimistic scenario, BTC’s price could reach $150,000 to $175,000, following the cyclical logic of 2017 and 2021. This would occur if the Bitcoin Composite Index surpasses 1.0 and remains above that level.
If the ratio stays within the 0.8–1.0 range, the market would likely consolidate in a broad corridor between $90,000 and $110,000, indicating that participants are maintaining positions without increasing exposure.
Alternatively, if the ratio drops to 0.75 or below, short-term holders may start taking profits, potentially leading to a price correction to $70,000–$85,000. However, AxelAdlerJr notes that this scenario is less likely than the other two.
The return of YoY True MVRV to positive territory means that the average purchase price of all coins acquired over the past year is now below the current market price. The pressure from panic sellers is decreasing – many are now in profit and don’t need to lock in losses. Holder… pic.twitter.com/6AgvVVTn9h
— Axel

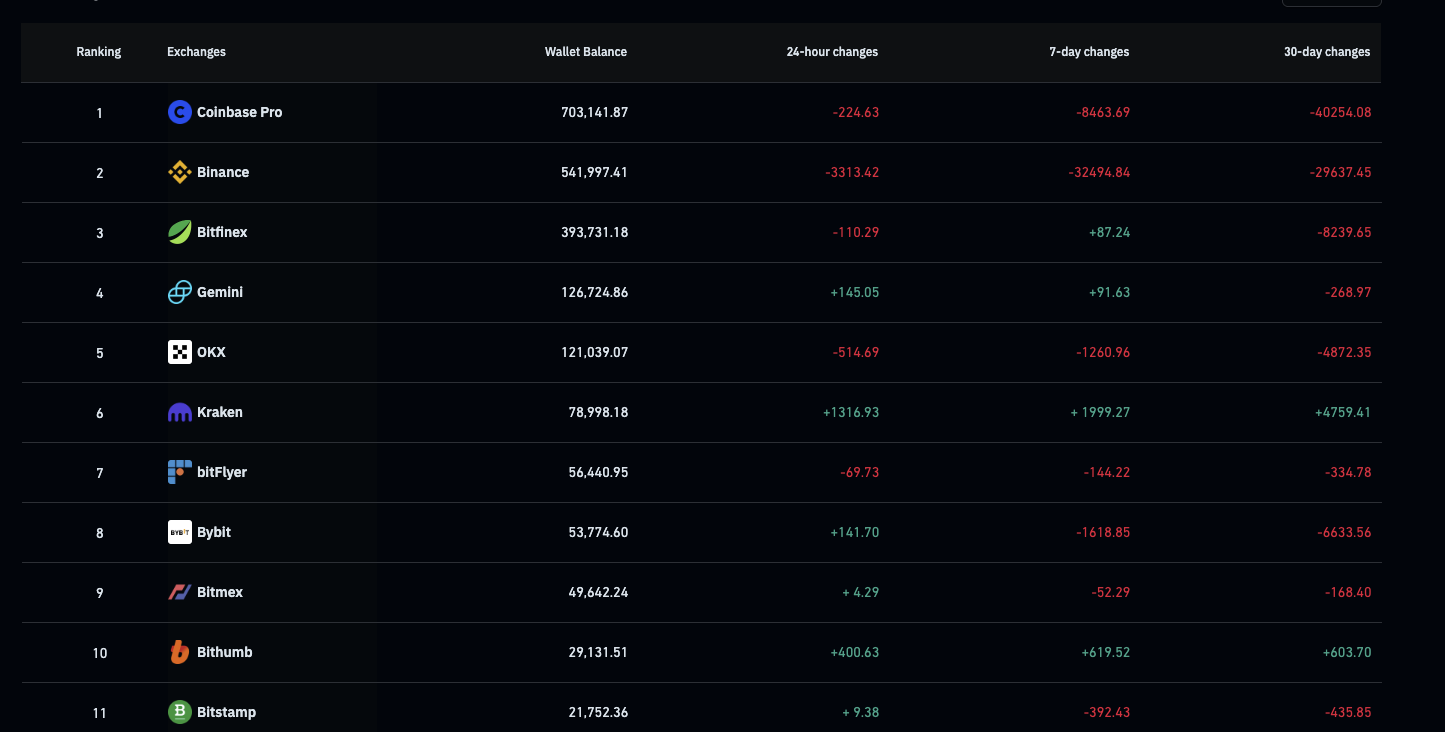
On-chain signals further bolster the bullish outlook. According to Coinglass, over the past 7 days, approximately 42,525.89 Bitcoins were withdrawn from centralized exchanges (CEX), reducing the supply on exchanges to a 7-year low of about 2.48 million BTC.
The trend of Bitcoin withdrawals from exchanges is often seen as a positive sign, as it indicates investor accumulation and reduced selling pressure, paving the way for price growth.
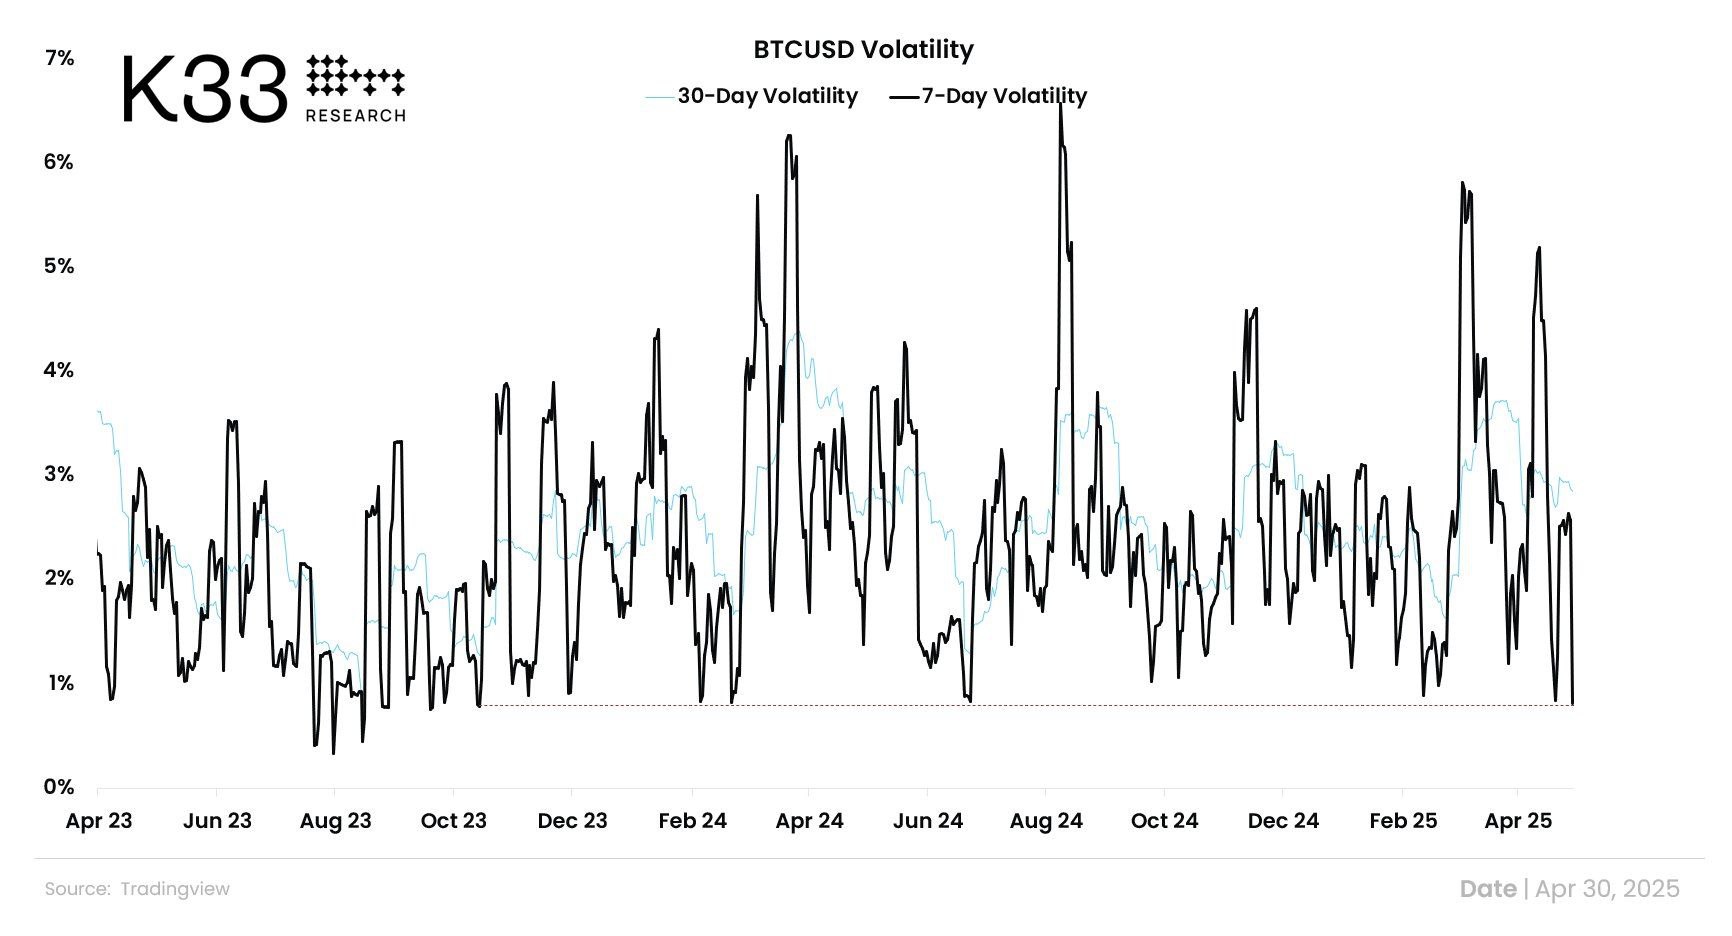
Bitcoin’s 7-day volatility has also hit its lowest level in 563 days. Low volatility typically signals a period of accumulation before a price breakout, as observed during past major rallies, such as in 2020 before Bitcoin peaked at $69,000.
Technical Analysis and Key Price Levels
Technical analysis also supports Bitcoin’s bullish scenario. According to a post on X by Ali, Bitcoin’s key support levels are at $93,198 and $83,444, indicating strong consolidation above these thresholds.
If Bitcoin sustains above $93,198, the likelihood of continuing its upward trend to reach the $150,000 target becomes highly feasible.
“The most critical support levels for #Bitcoin $BTC are $93,198 and $83,444. Key zones to watch if momentum shifts,” Ali shared.
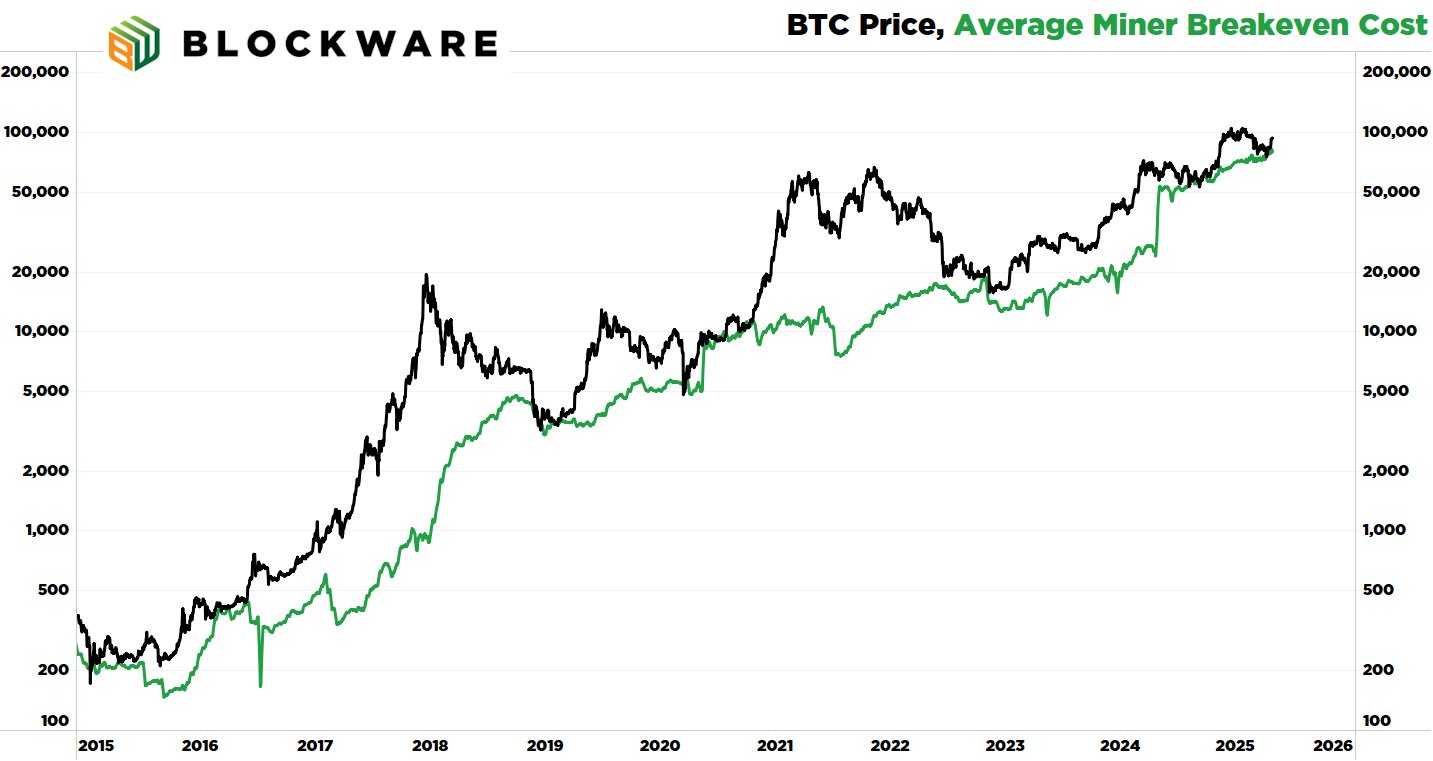
Moreover, Breedlove22, a well-known analyst, shared on X about three indicators signaling Optimism for Bitcoin. The first is the Average Miner Cost of Production. According to Breedlove22, this metric is at a bottom, suggesting a significant bull market may be on the horizon.
The second indicator is the supply held by long-term holders, which measures Bitcoin unmoved on-chain for at least 155 days. Breedlove22 noted that over the past 30 days, long-term holders have acquired an additional ~150,000 BTC.
“Bitcoin is running out of sellers in the $80,000 to $100,000 range,” Breedlove22 stated.
Lastly, and most importantly, is USD liquidity, which effectively represents the “demand” side of the equation. More dollars in the system mean more potential bidders.
“And it’s not just USD liquidity that’s increasing – liquidity of all fiat currencies is on the rise, and Bitcoin is a global asset,” Breedlove22 added.
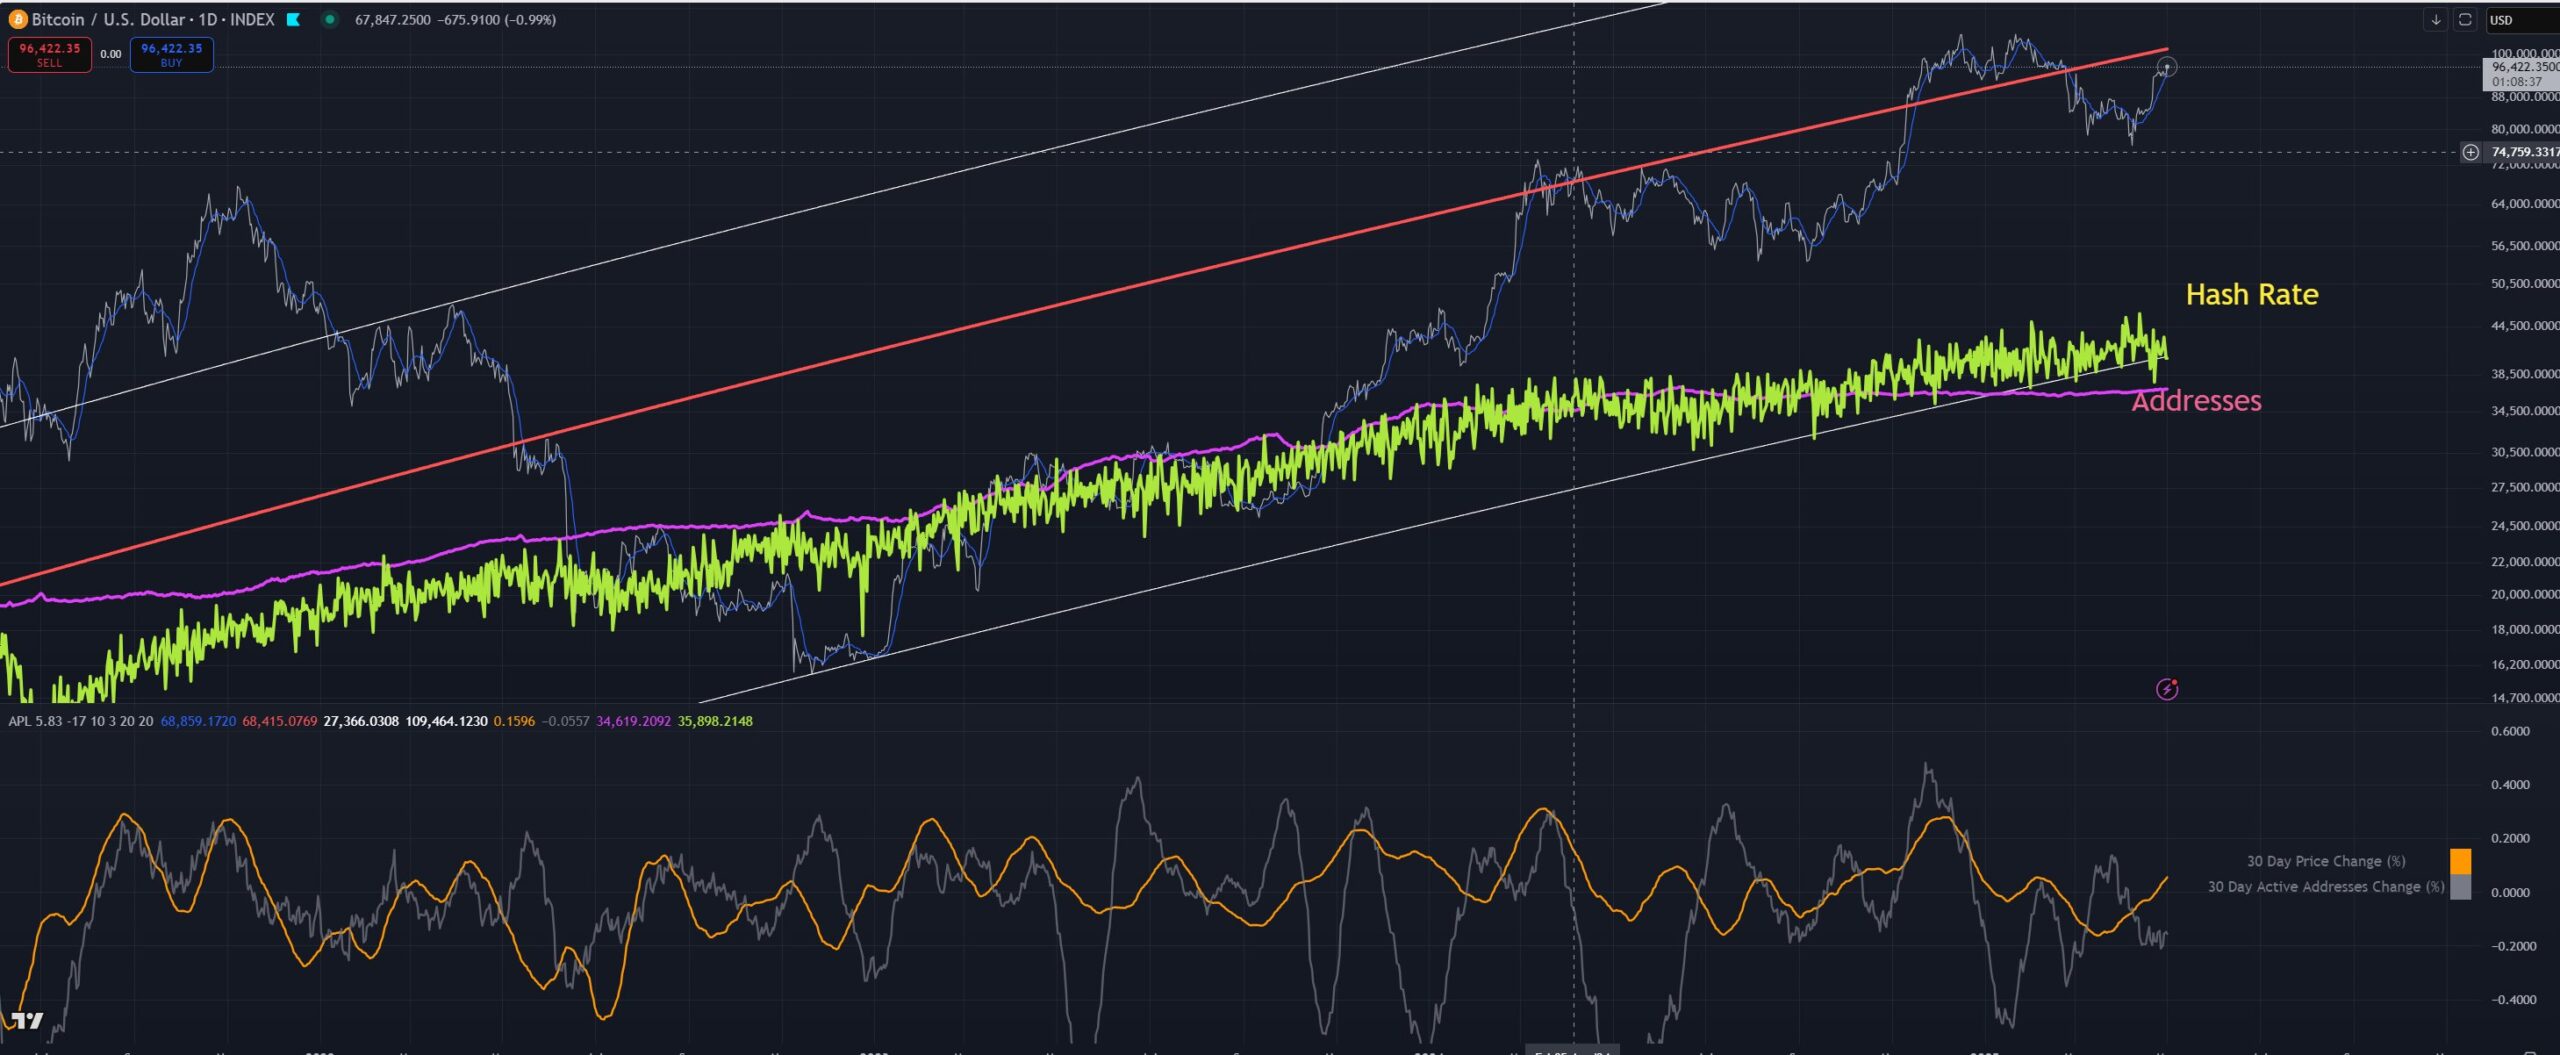
Echoing Breedlove22’s perspective, another X user shared that BTC’s valuation based on hash rate is at a support level, suggesting that a local bottom may have been reached.
In the optimistic scenario, Bitcoin is poised for a significant opportunity to reach $150,000 to $175,000. However, investors should also prepare for risks such as short-term price corrections.
With strong support levels at $93,198 and $83,444, Bitcoin has a solid foundation for continued growth, but caution remains essential.

Log in to Reply
Log in to comment your thoughtsComments
Related Articles
|Square
Get the BTCC app to start your crypto journey
Get started today Scan to join our 100M+ users