Hedera (HBAR) Smashes Death Cross With 20% Rally—Bull Trap or Breakout?

HBAR’s defiant surge shrugs off bearish technicals—but can it sustain momentum against crypto’s gravitational pull toward ’buy the rumor, sell the news’?
Key drivers: Institutional adoption whispers meet retail FOMO, while the network’s enterprise-grade claims get a stress test.
Watch the $0.15 level: Flip that to support, and suddenly the ’death cross’ looks like just another overhyped chart pattern Wall Street transplants love to fetishize.
HBAR Bulls Stay in Control After Death Cross
A death cross occurs when an asset’s short-term moving average—typically the 50-day—crosses below its long-term moving average, usually the 200-day.
This crossover means the asset’s recent price momentum is weakening, and a longer-term downtrend may take shape. The pattern often signals increased selling pressure as traders usually interpret it as a marker of a negative shift in market sentiment.
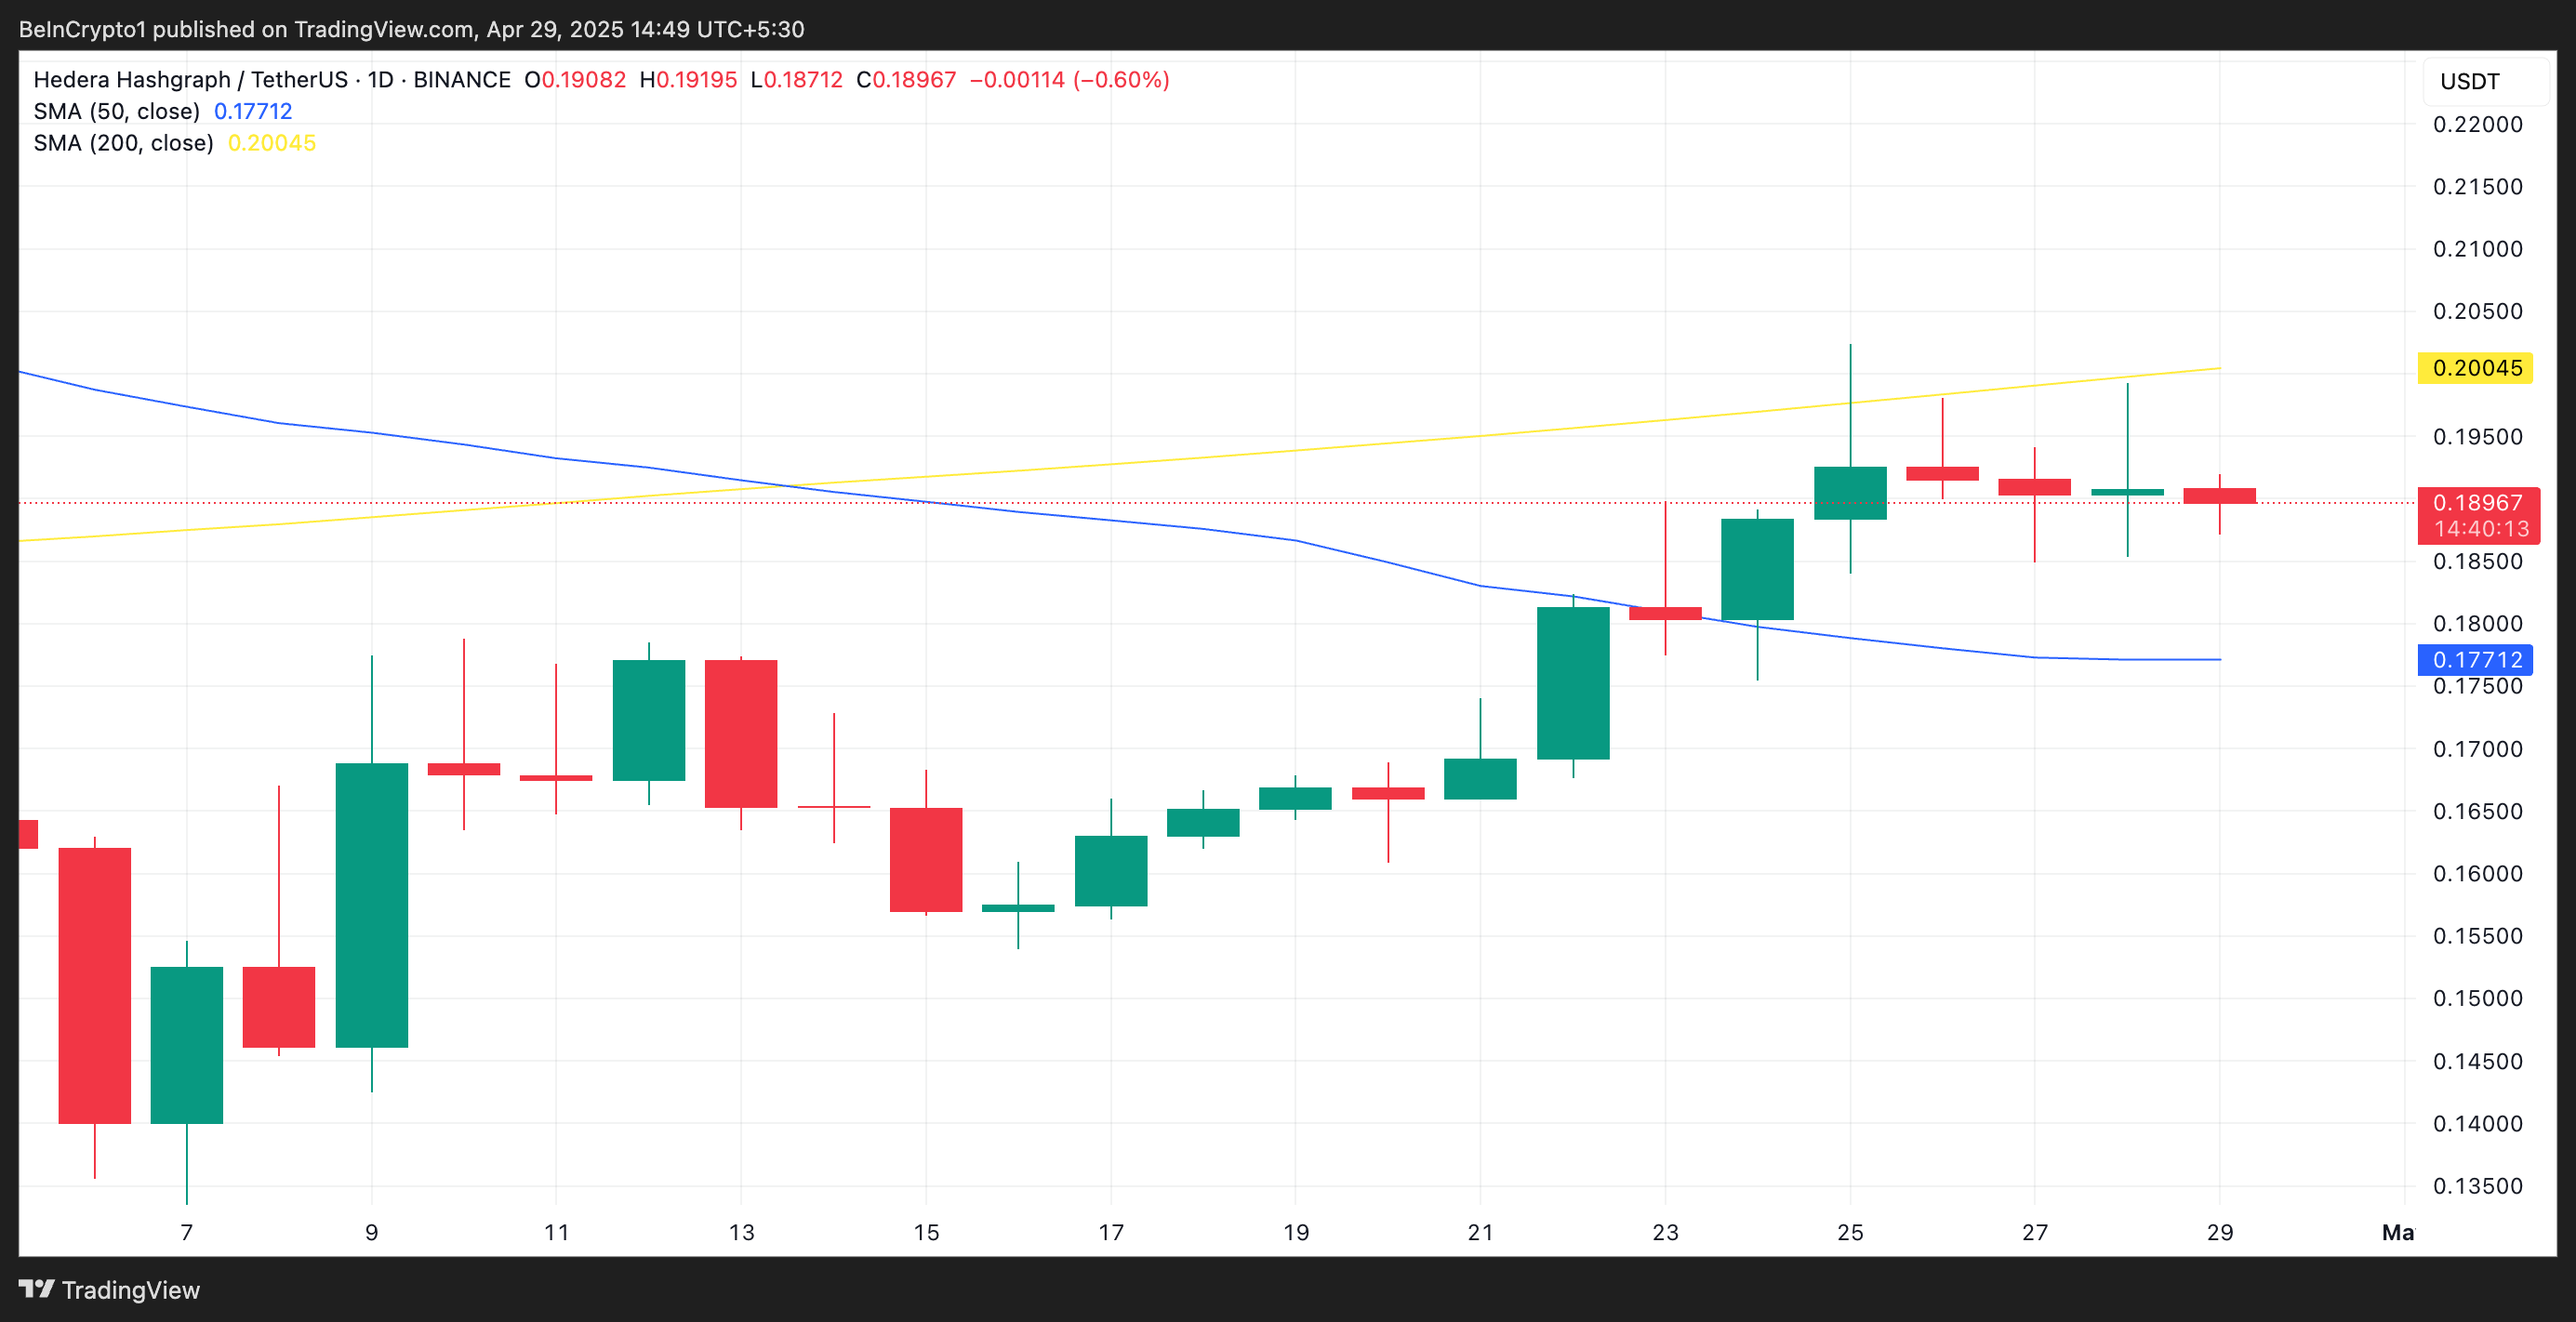
However, this is not always the case, especially in volatile or recovering markets where price action can defy traditional technical signals. For instance, HBAR’s value rocketed 20% in the past two weeks.
Although the bullish momentum has eased slightly over the last three trading sessions, the bulls remain firmly in control. Readings from HBAR’s Moving Average Convergence Divergence (MACD) indicator confirm this.
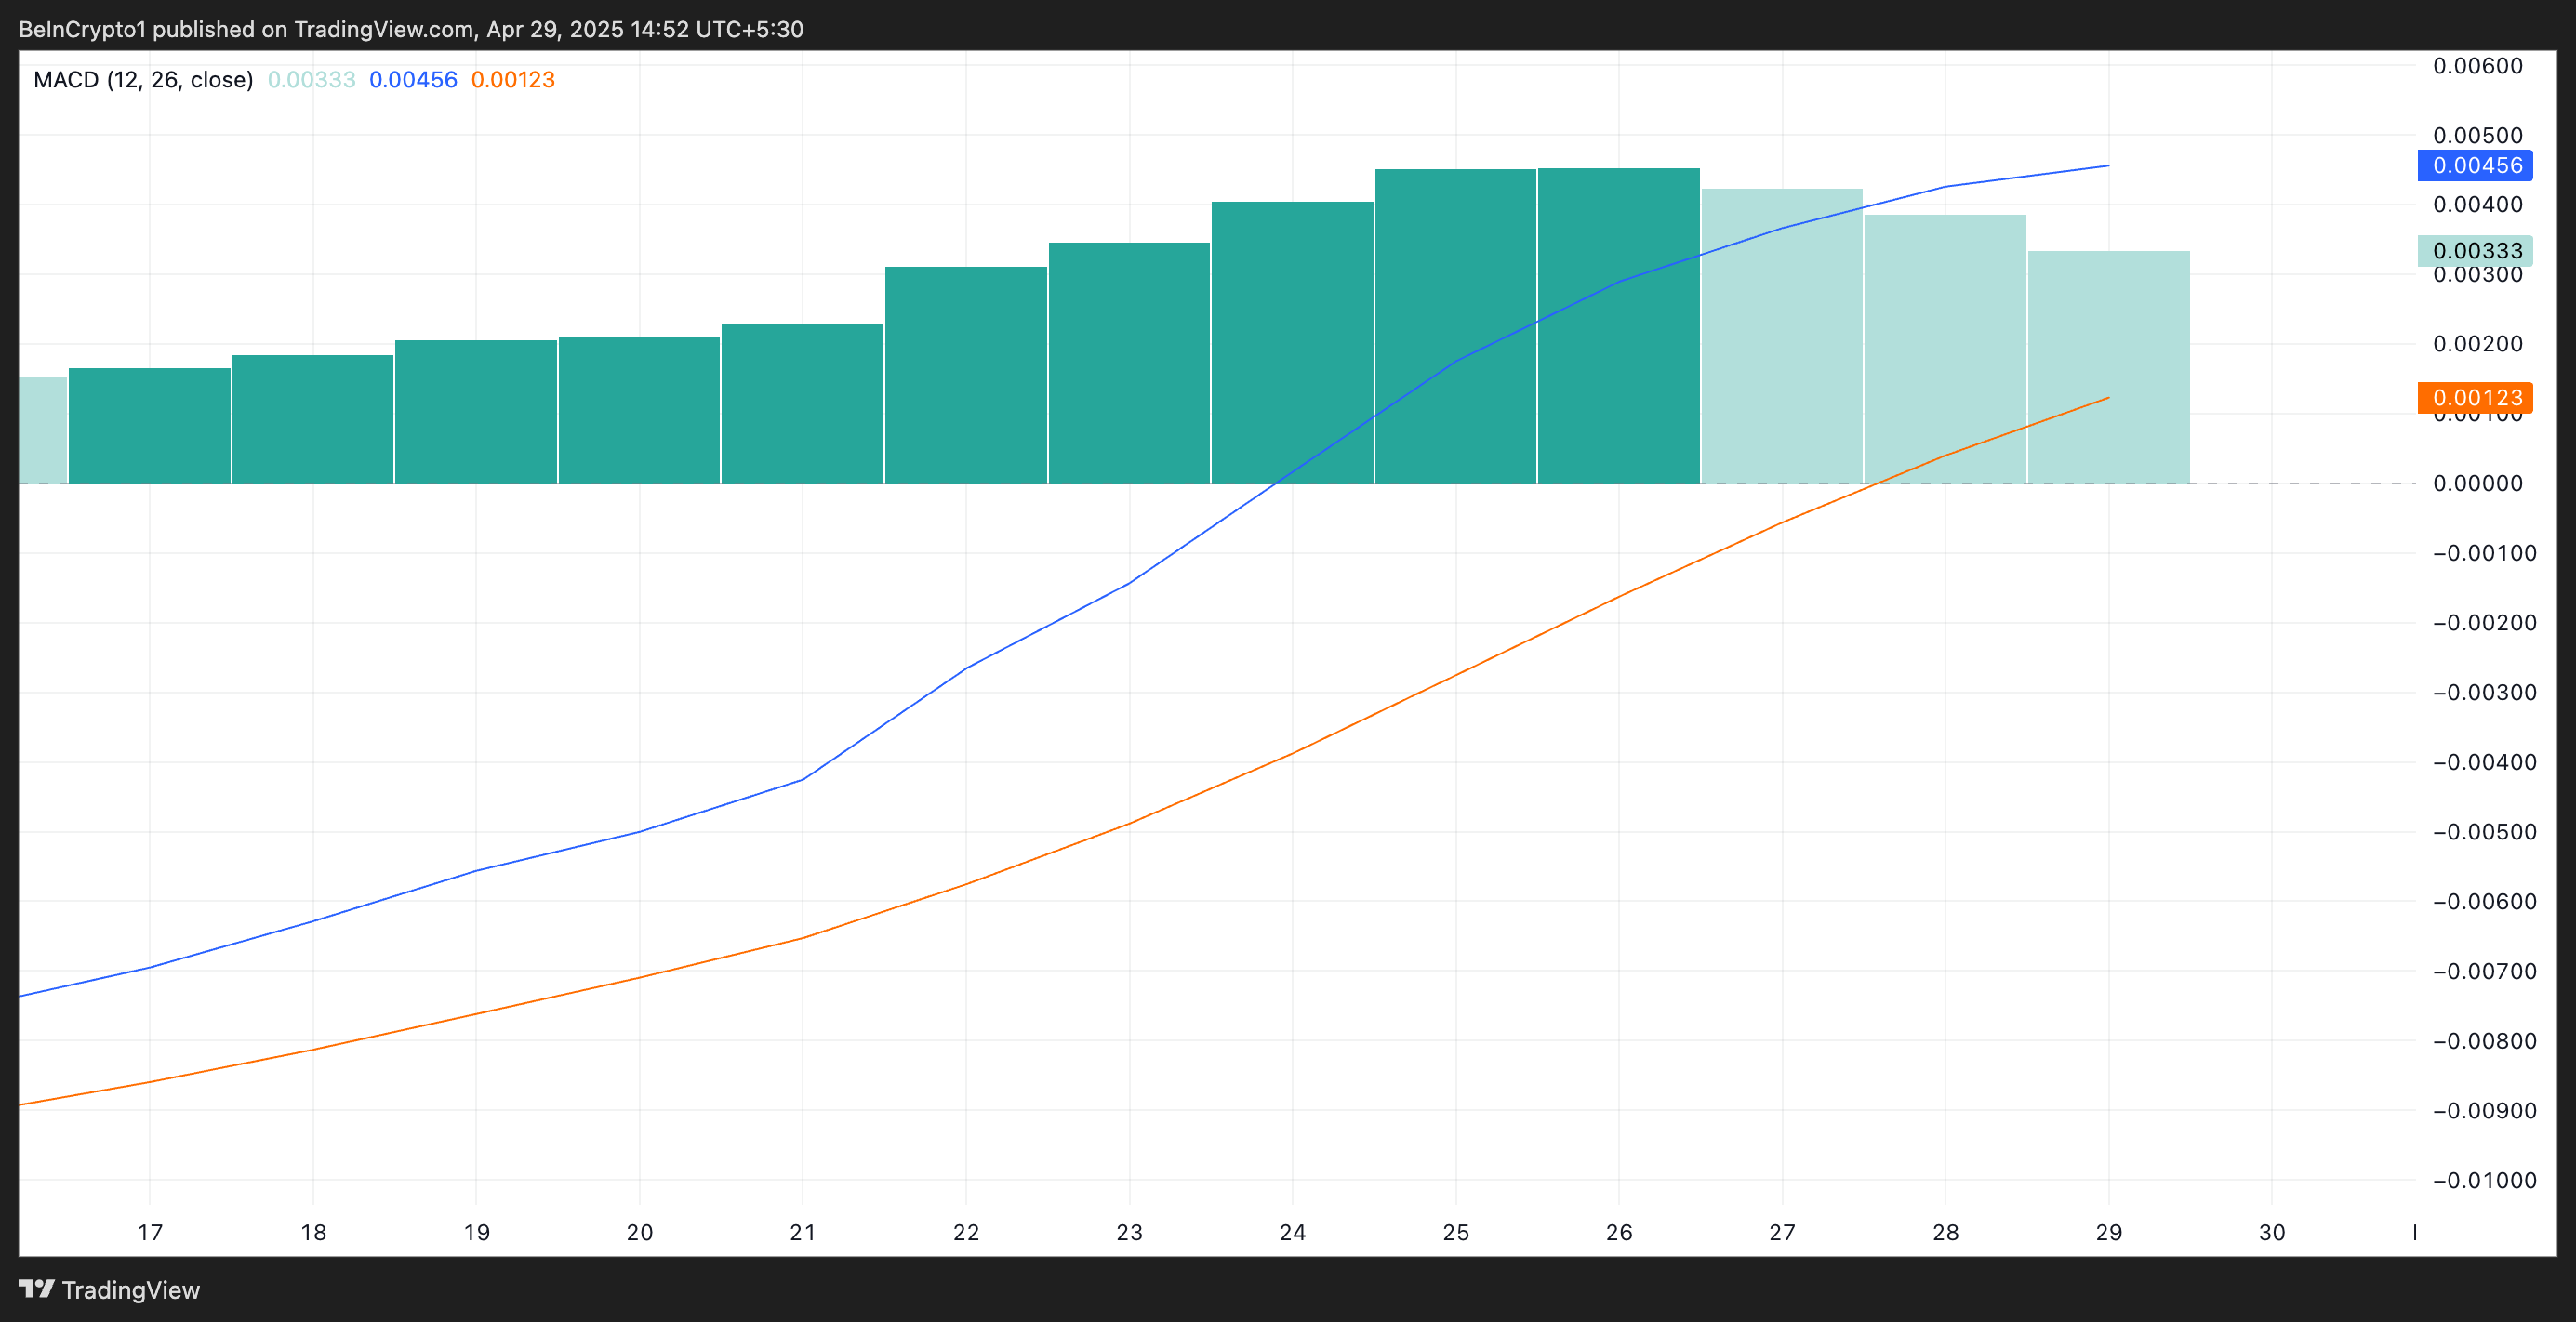
While the bars that make up this indicator have diminished over the past three days—reflecting a slowdown in bullish momentum amid broader market consolidation—the MACD line remains above the signal line, indicating that buying pressure still prevails among traders.
This setup hints at the likelihood of further price gains despite the death cross.
HBAR Climbs Steadily—Will It Hold the Line or Slip Back to $0.15?
Since April 16, HBAR has traded along an ascending trend line, a bullish pattern formed when an asset consistently posts higher lows over time. This indicates growing investor confidence and sustained upward momentum, even amid short-term pullbacks.
For HBAR, this trend suggests buyers continue stepping in at increasingly higher price points, reinforcing support levels. If the trend holds, it could pave the way for further gains, especially if market sentiment remains positive.
HBAR’s price could break above the $0.19 resistance in this scenario and rally toward $0.23.
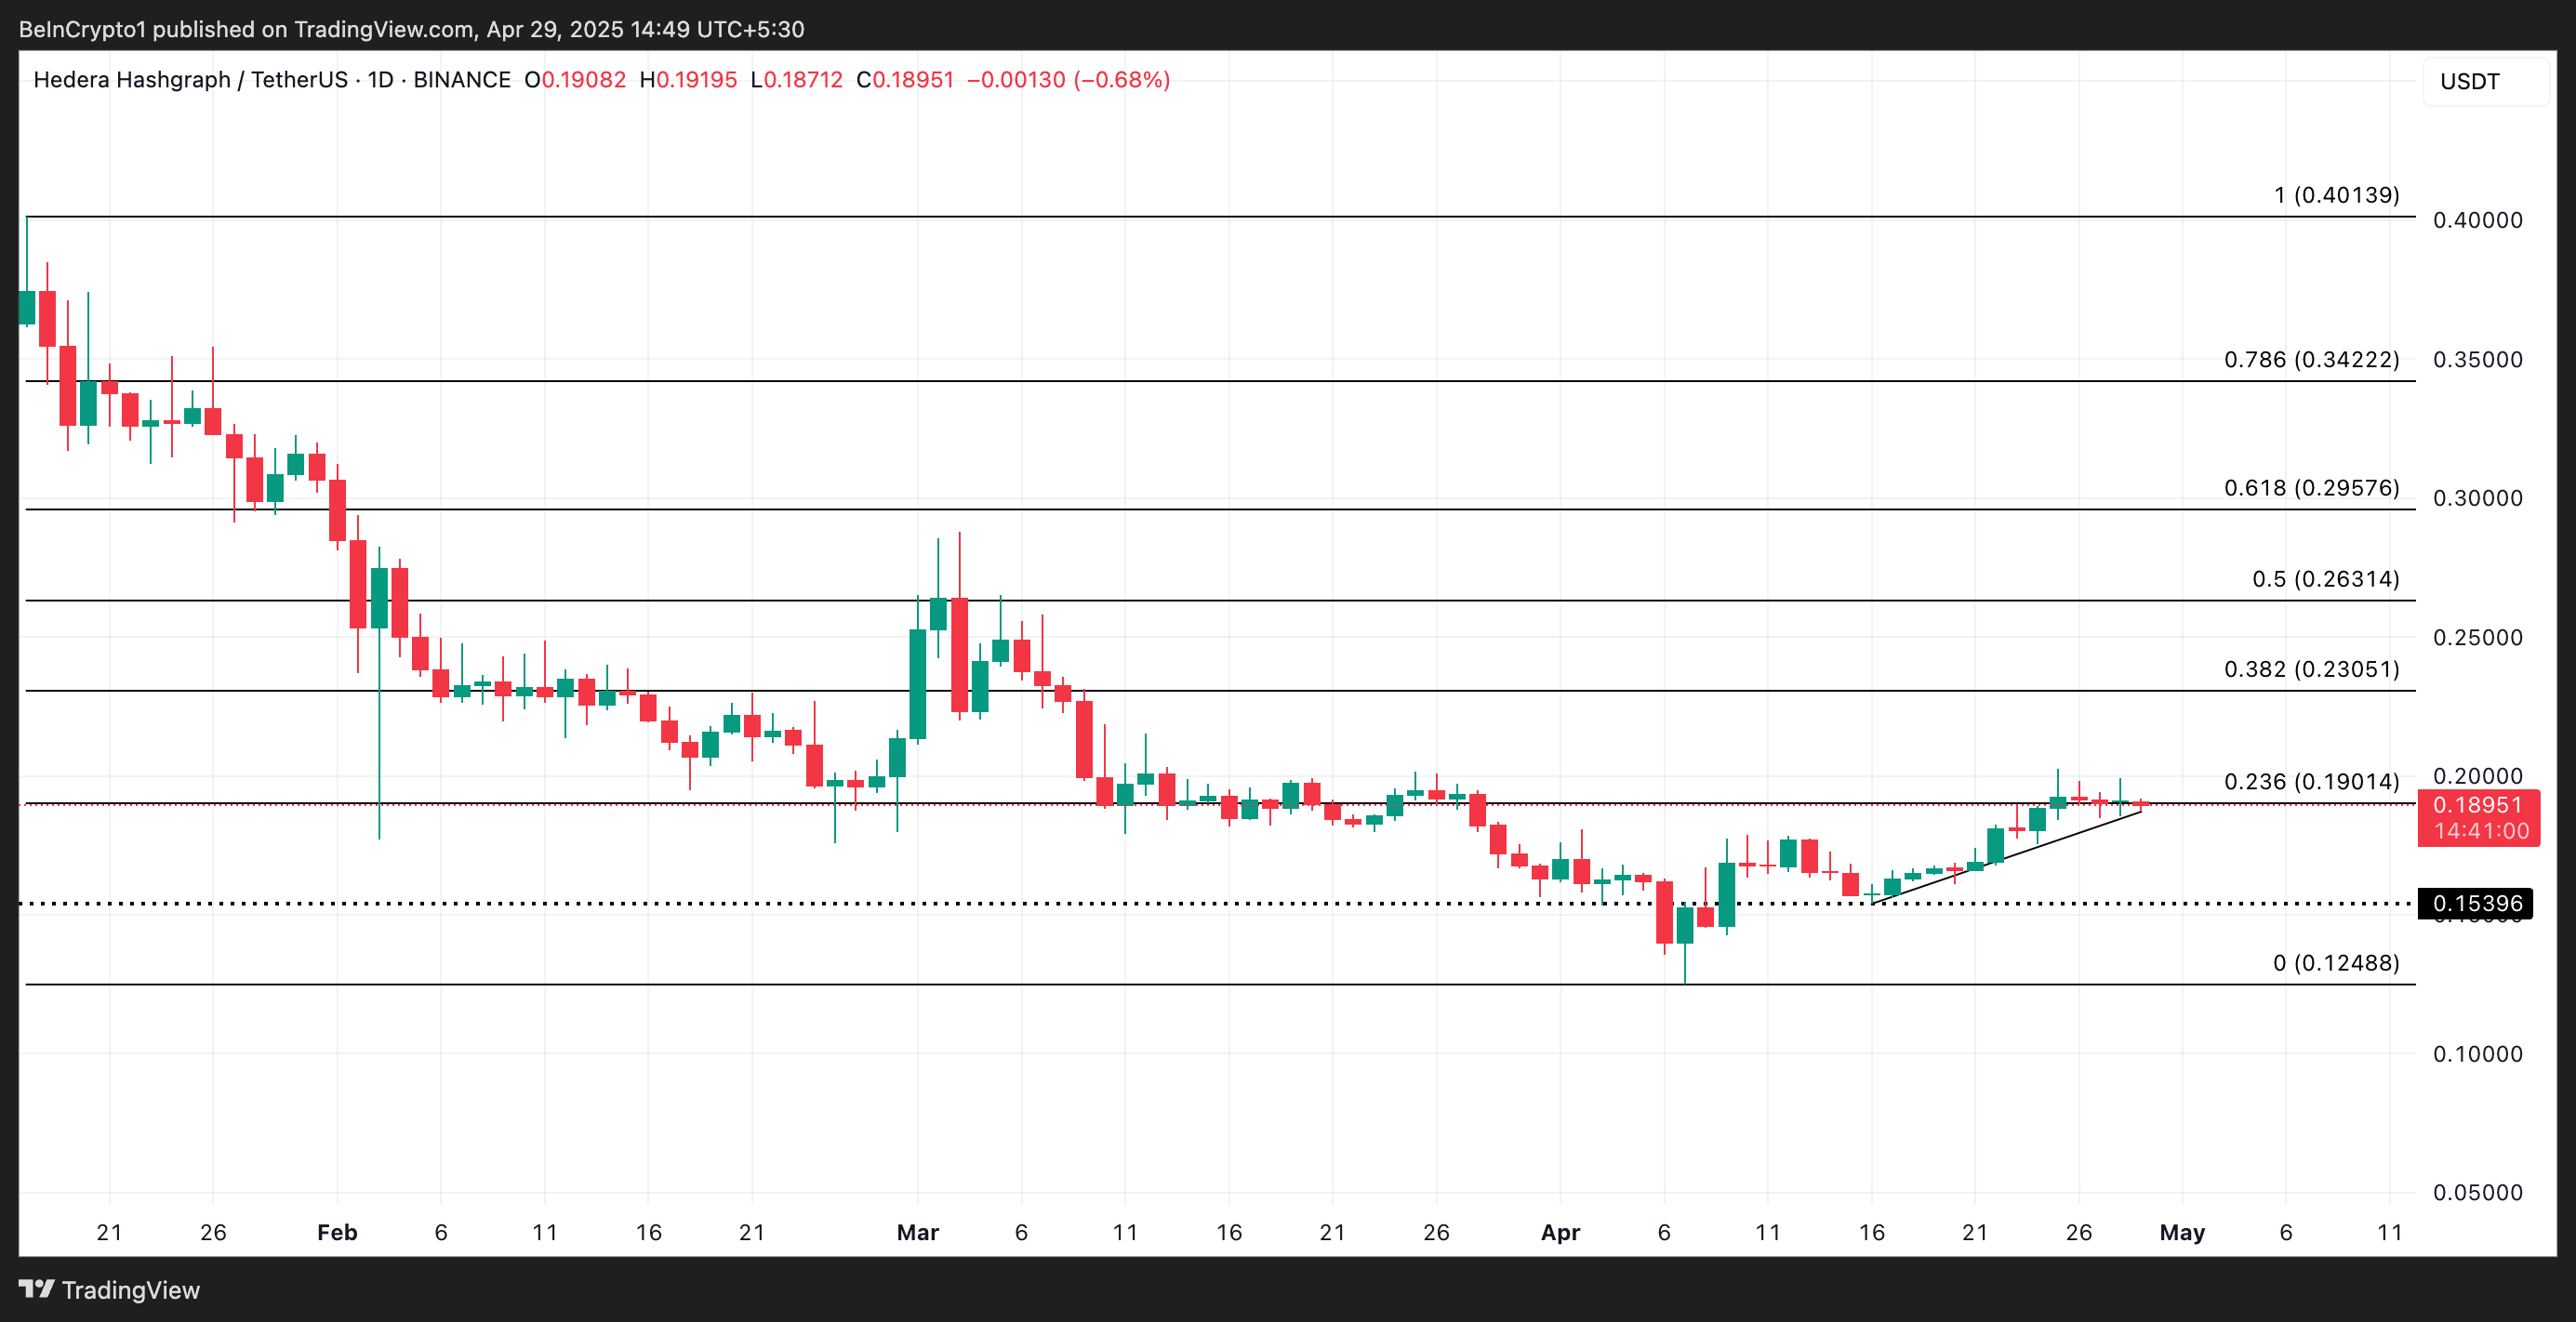
Conversely, if selloffs resume, the price of the HBAR token could fall to $0.15.
