Onyxcoin (XCN) Exhibits Potential Trend Reversal Following 200% Price Surge Correction

After a significant 200% price appreciation, Onyxcoin (XCN) is now displaying technical indicators suggesting a possible market reversal. The digital asset, which had been experiencing strong bullish momentum, appears to be undergoing a corrective phase as buying pressure subsides. Market analysts are closely monitoring key support levels to determine whether this represents a temporary retracement or the beginning of a more sustained downward trend. The cryptocurrency’s recent performance highlights the volatile nature of altcoin markets, where rapid gains can often be followed by equally swift corrections. Traders are advised to pay particular attention to trading volume patterns and moving average convergence divergence (MACD) indicators for clearer signals about XCN’s next potential price movement.
Onyxcoin Shows Early Signs of Stabilization, but Momentum Remains Uncertain
Onyxcoin’s Relative Strength Index (RSI) is currently sitting at 43. Readings above 70 typically indicate that an asset is overbought and could be due for a pullback, while readings below 30 suggest it may be oversold and poised for a potential rebound.
Levels between 30 and 70 are considered neutral, often reflecting consolidation or indecision in the market.

XCN’s RSI signals a neutral state but shows signs of gradual recovery. While not yet a clear bullish signal, yesterday’s upward move suggests that bearish momentum may be easing.
However, the fact that RSI failed to hit above 50 reflects lingering uncertainty and a lack of sustained buying pressure.
For now, XCN appears to be in a wait-and-see phase, where a continued climb in RSI could signal a shift toward renewed upside, but any further weakness might keep the price trapped in a consolidation range.
XCN Uptrend Weakens as ADX Signals Fading Momentum
Onyxcoin’s Average Directional Index (ADX) has declined to 11, down from 13.92 yesterday and 15.26 two days ago. This decline reflects a consistent weakening in trend strength.
The ADX is a key component of the Directional Movement Index (DMI) and is used to measure the strength—not the direction—of a trend on a scale from 0 to 100.
Values below 20 typically suggest that the market is trending weakly or not at all, while readings above 25 confirm a strong and established trend.

With the ADX now at 11, Onyxcoin’s trend is losing momentum, even though it technically remains in an uptrend. This low reading suggests the current bullish phase is fragile and may lack the conviction needed for sustained upward movement.
Combined with EMA lines that are beginning to flatten, the weakening ADX adds weight to the possibility that the trend could soon shift or stall.
If no surge in buying pressure emerges to reinforce the uptrend, XCN may enter a period of sideways movement or even a reversal in the short term.
Onyxcoin at a Crossroads as EMA Lines Hint at Possible Trend Reversal
XCN EMA lines remain bullish for now, with short-term averages still positioned above long-term ones.
However, the short-term EMAs have started to slope downward, raising the possibility of a looming death cross—a bearish crossover in which the short-term average falls below the long-term average.
If this crossover materializes, it would signal a shift in trend direction and could trigger a deeper pullback, after a 200% rally between April 9 and April 11, making it one of the best-performing altcoins of the previous weeks.
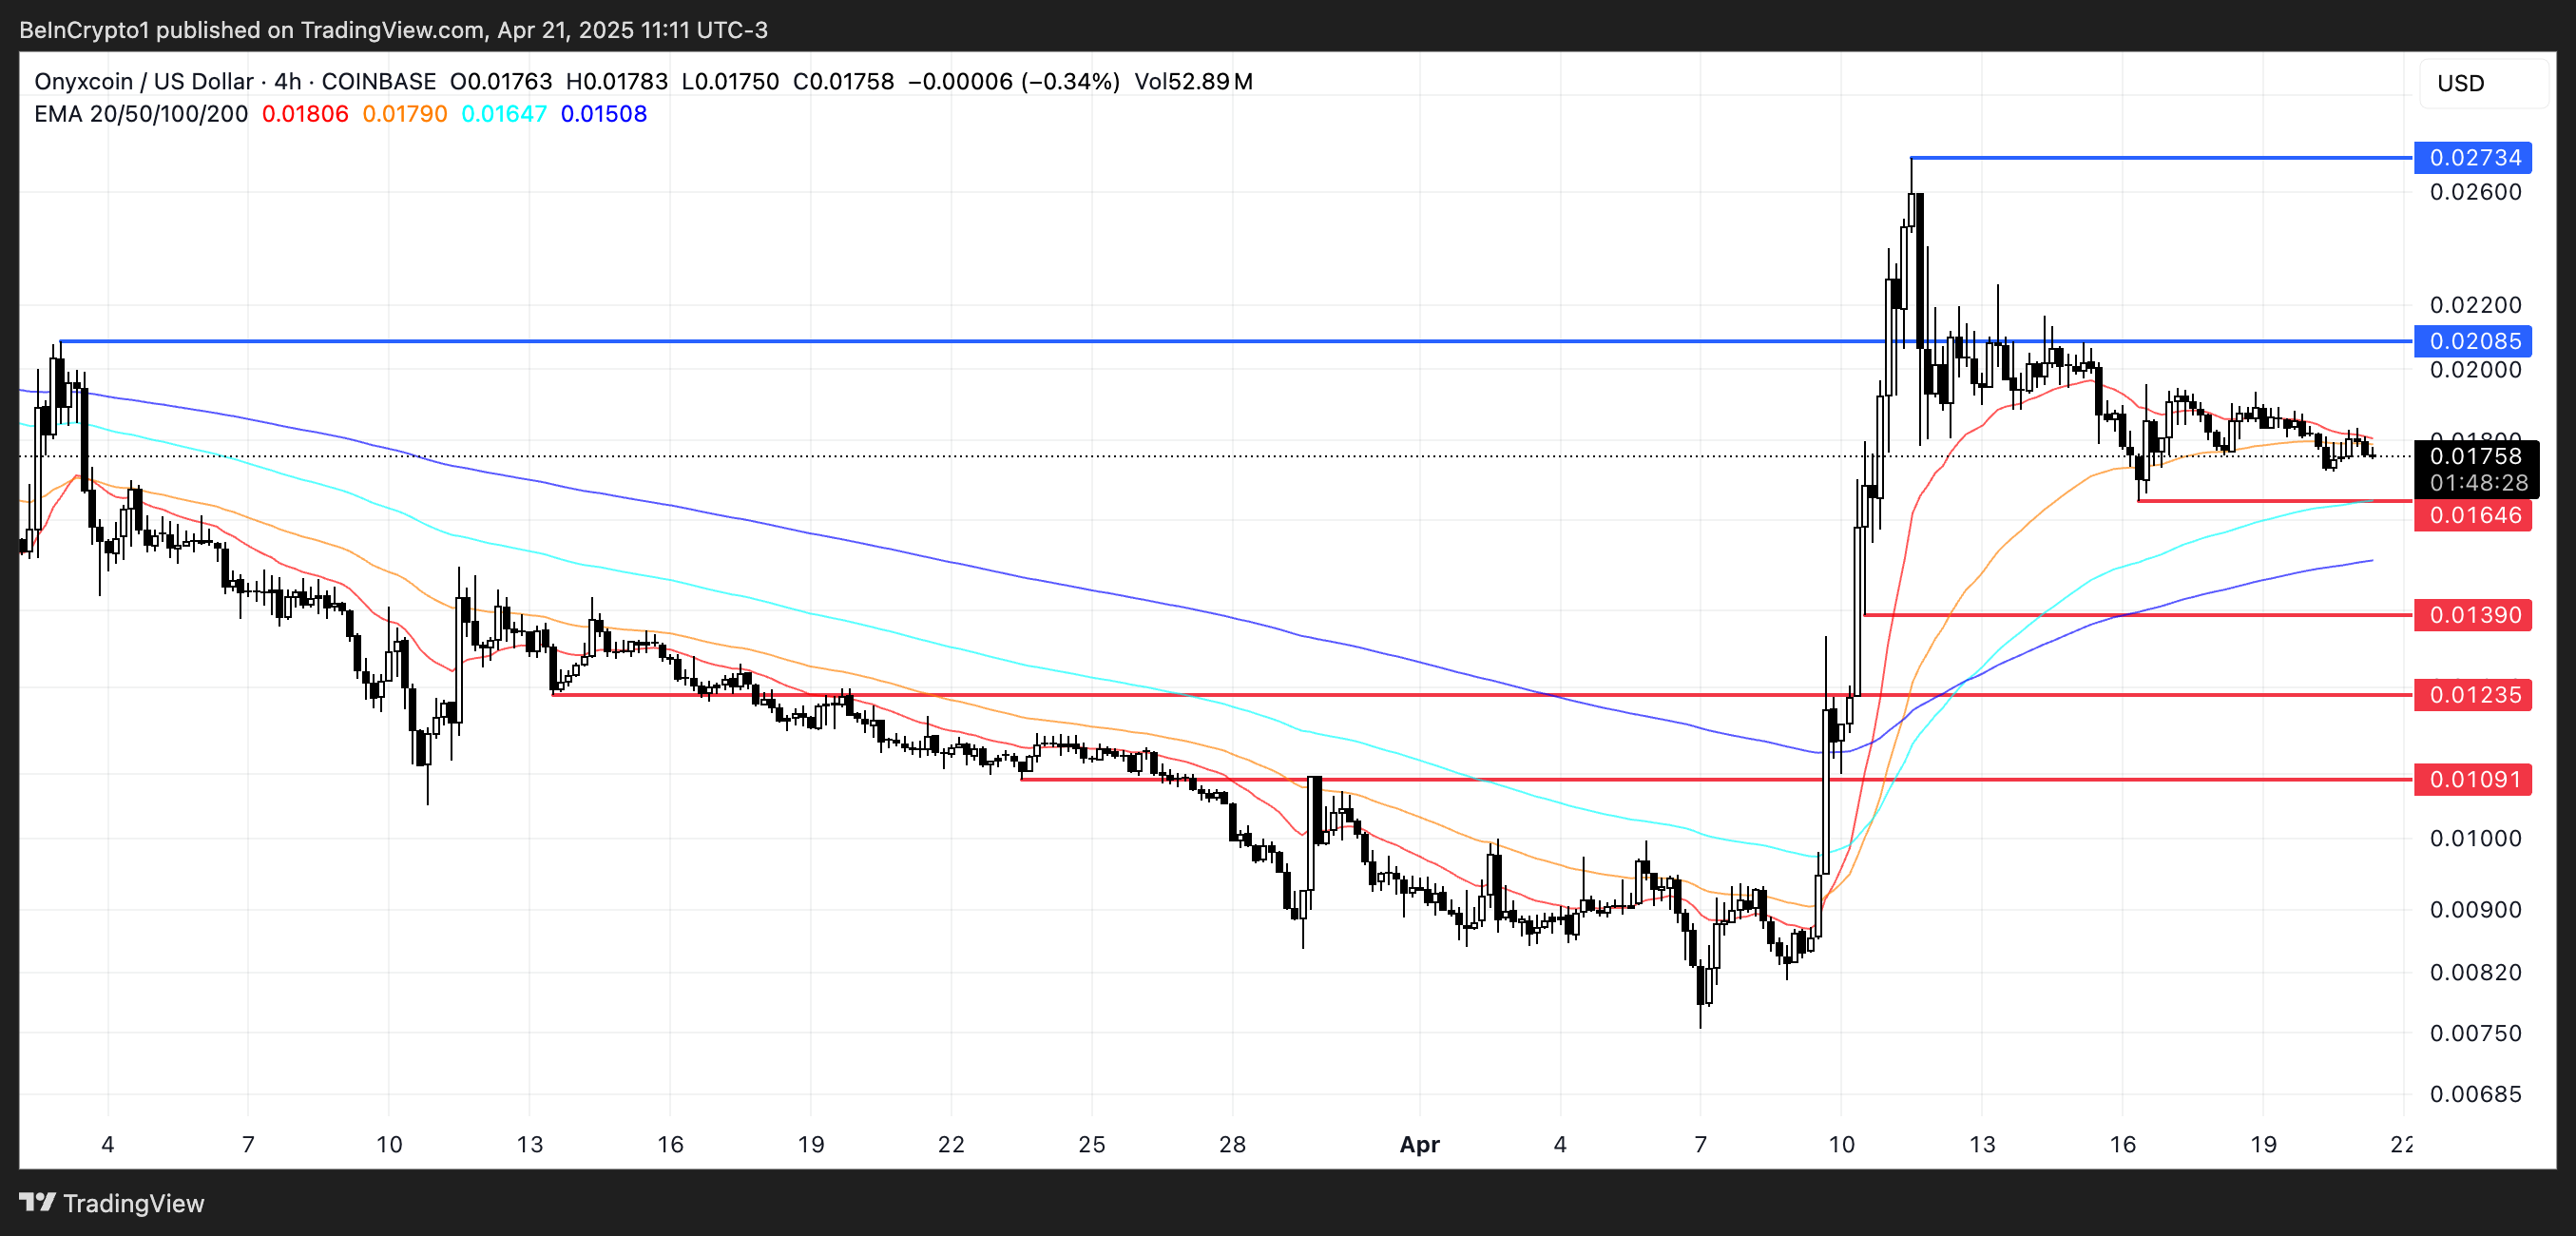
Key support levels to watch are $0.016, followed by $0.0139 and $0.0123. If bearish momentum accelerates, XCN could drop as low as $0.0109, marking a potential 38% correction from current levels.
On the flip side, if bulls manage to regain control and reinforce the existing uptrend, XCN could challenge the resistance at $0.020.
A breakout above that level would open the door for a potential rally toward $0.027, representing a 55% upside.
