XRP Trading Volume Plummets More Than 20% as Market Sentiment Turns Cautious

Amidst growing market uncertainty and indecision among traders, XRP has experienced a significant decline in trading activity, with volumes dropping sharply by over 20%. This contraction reflects broader hesitancy in the cryptocurrency markets as investors await clearer signals. The reduced liquidity could lead to increased volatility for XRP in the near term, with technical indicators suggesting a potential consolidation phase before the next decisive move.
Neutral RSI Reading Suggests Caution for XRP Traders
XRP’s Relative Strength Index (RSI) is currently sitting at 46.82, signaling neutral momentum in the market. This neutral zone has persisted since April 7, with no significant shifts into either overbought or oversold territory.
Notably, the RSI was at 57.30 just three days ago, indicating that XRP has experienced a recent decline in buying pressure.
The drop suggests cooling interest or a possible shift in sentiment among traders, as the asset now hovers closer to the midpoint of the RSI scale.

The RSI is a momentum oscillator that measures the speed and magnitude of recent price changes, typically on a scale from 0 to 100.
Readings above 70 often suggest an asset is overbought and could be due for a pullback, while readings below 30 indicate it may be oversold and potentially poised for a bounce. With XRP now at 46.82, the asset is neither overbought nor oversold, implying indecision in the market.
This level, combined with the recent dip from 57.30, may signal growing caution or weakening bullish momentum. It could potentially point to a consolidation phase or slight downward pressure in the short term unless buyers re-enter with conviction.
Ichimoku Indicators Show Indecision in XRP’s Price Action
XRP is currently trading inside the Ichimoku Cloud, reflecting a state of indecision or consolidation.
The Tenkan-sen (blue line) and Kijun-sen (red line) are flat and closely aligned, suggesting weak momentum and a lack of short-term trend direction.
The Senkou Span A and B (the cloud boundaries) are relatively flat as well, which typically indicates that the market is in equilibrium without strong pressure from either buyers or sellers.
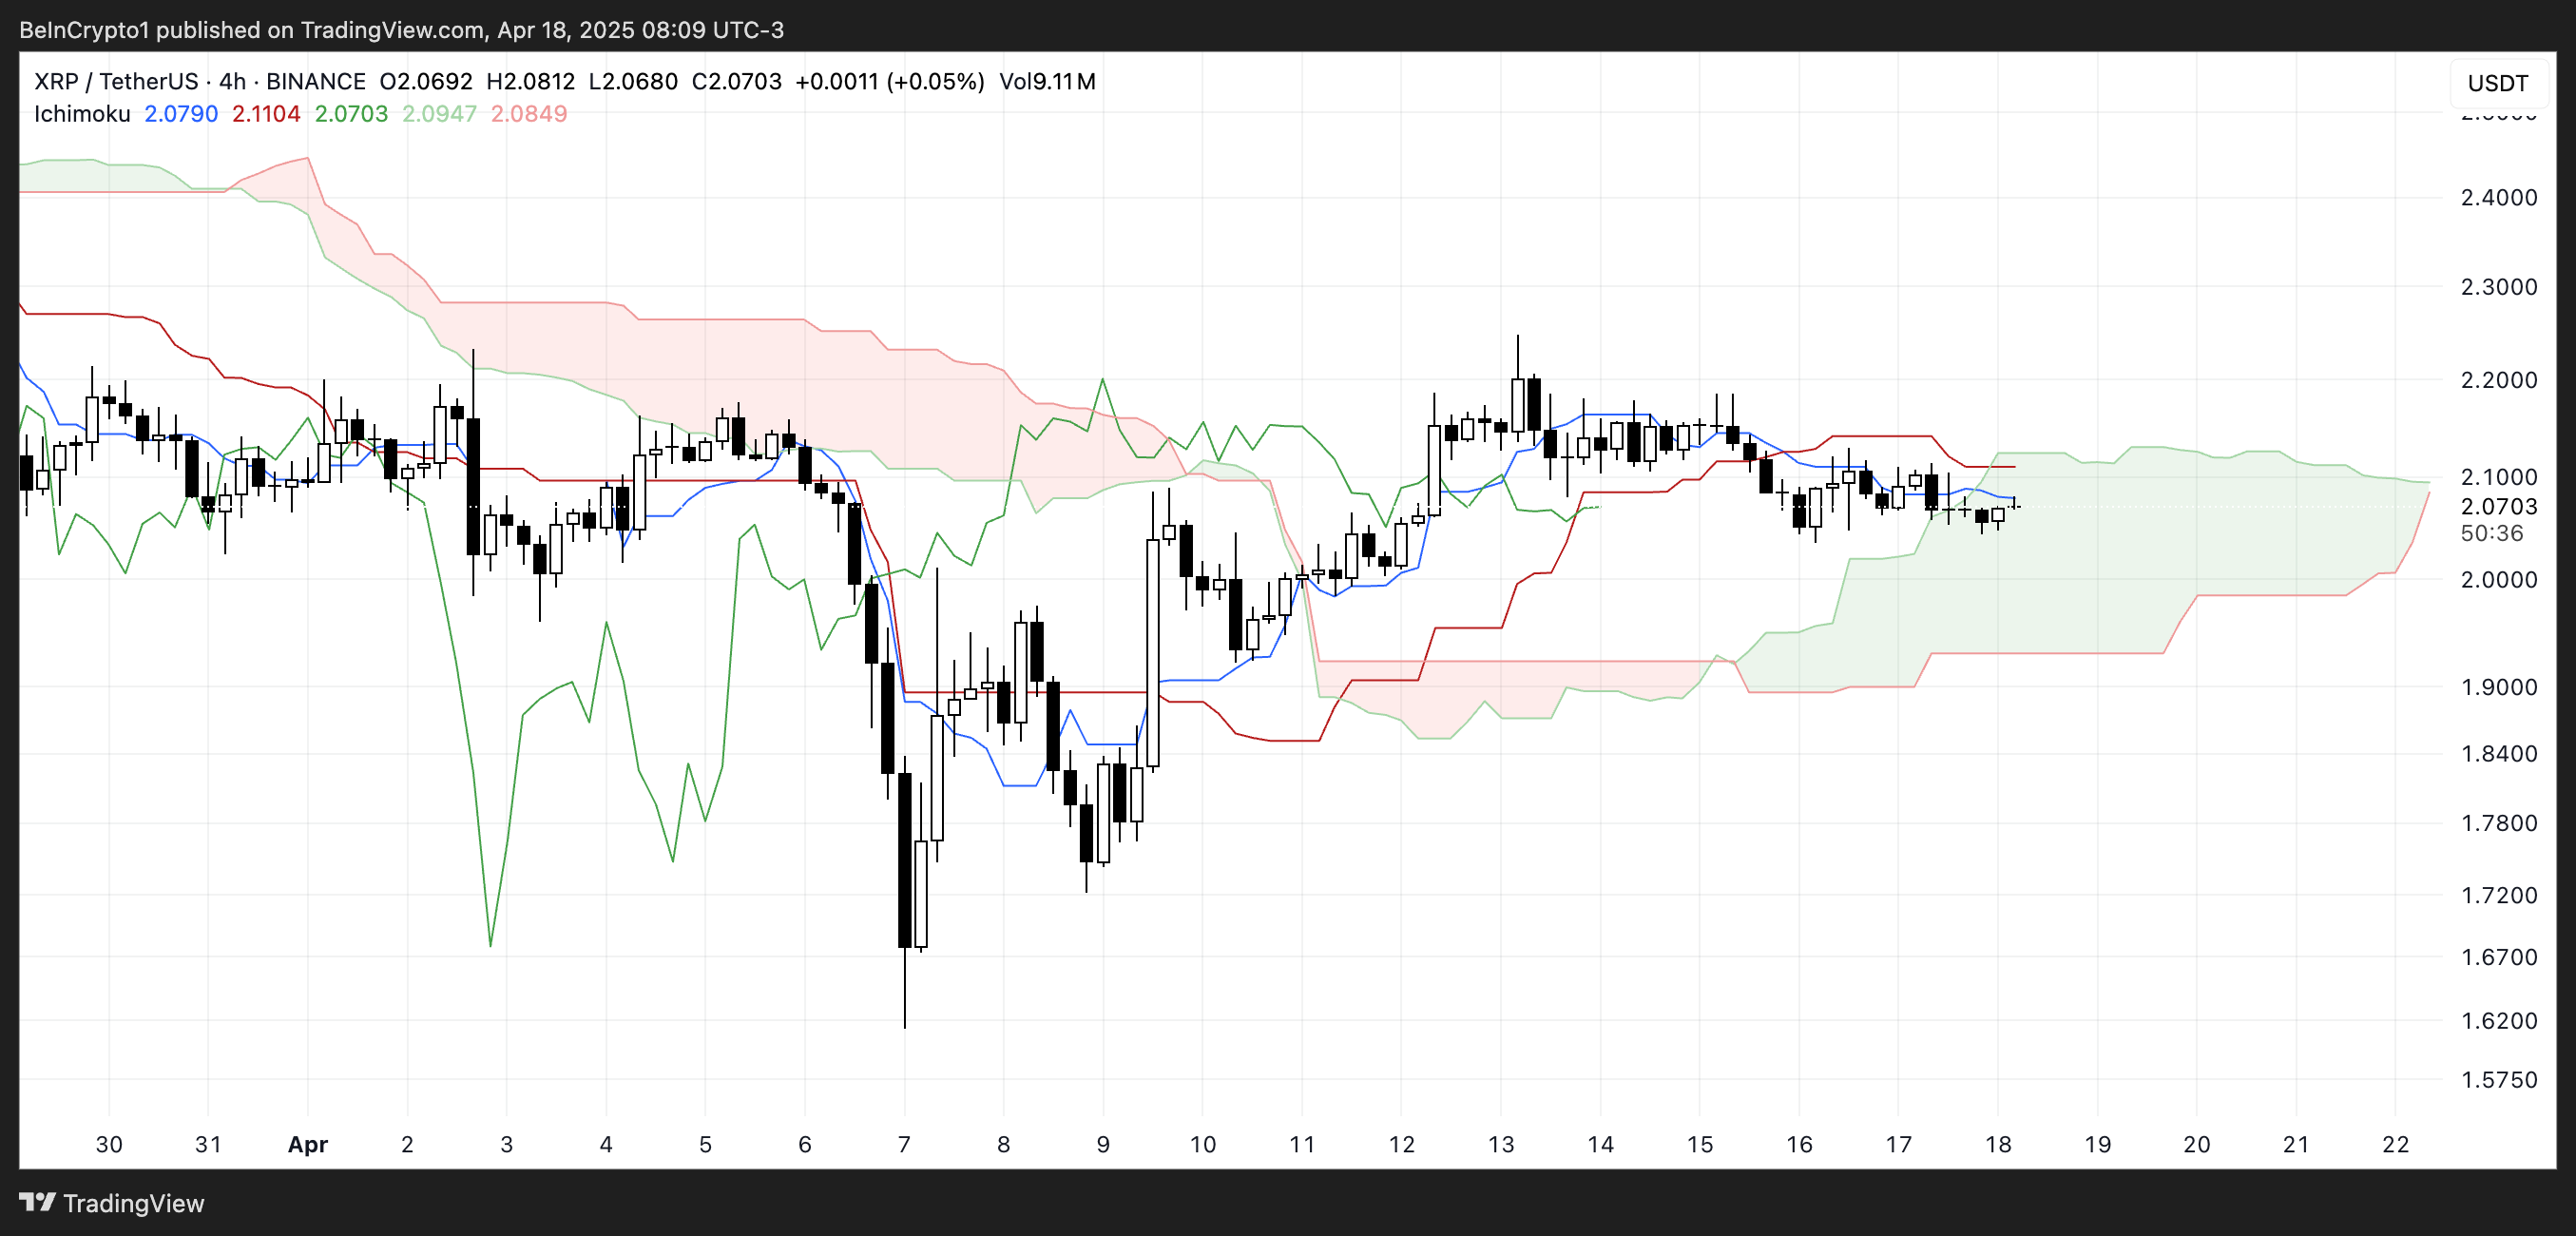
The Ichimoku Cloud, or Kumo, helps visualize support, resistance, and trend direction at a glance. When the price is above the cloud, the trend is considered bullish; below it, bearish.
Inside the cloud, as XRP currently is, the trend is neutral, and volatility often contracts. The flatness of the cloud’s leading edges implies a consolidation phase, and the fact that price is not breaking clearly above or below the cloud reinforces the idea of market uncertainty.
For now, the lack of a decisive breakout suggests XRP could remain range-bound until a stronger trend develops.
$2.03 Support and $2.09 Resistance Hold the Key to XRP’s Next Move
XRP price is currently trading within a narrow consolidation range, with key support at $2.03 and resistance at $2.09.
The price action has been relatively muted, but the EMA lines are starting to show signs of potential weakness, as a death cross—where the short-term EMA crosses below the long-term EMA—appears to be forming.
If this bearish crossover confirms and XRP breaks below the $2.03 support, a move down to $1.96 becomes increasingly likely.

A strong continuation of the downtrend could trigger a steeper drop. It could potentially drive the price as low as $1.61 if selling pressure accelerates.
However, there’s still a bullish scenario on the table. If buyers manage to push XRP above the $2.09 resistance, it could open the door for a retest of the $2.17 and $2.35 levels.
This would indicate renewed strength and a shift in momentum in favor of the bulls. Should the rally gain traction beyond these levels, XRP could make a run toward $2.50, marking a significant recovery.
