Onyxcoin (XCN) Experiences a 95% Weekly Rally – Can the Upward Momentum Sustain?

Onyxcoin (XCN) has demonstrated remarkable bullish behavior over the past seven days, with its price surging by an impressive 95%. Investors and traders are now closely monitoring whether this upward trend will persist or if a correction is imminent. The cryptocurrency market’s volatility makes it essential to analyze key indicators, such as trading volume, market sentiment, and broader macroeconomic factors, to gauge the sustainability of this rally. Technical analysis suggests potential resistance levels ahead, while on-chain metrics reveal increased network activity and adoption. As the digital asset continues to attract attention, market participants are evaluating entry and exit strategies to capitalize on XCN’s price movements.
XCN RSI Shows Buyers Are Trying To Recover Control
Onyxcoin Relative Strength Index (RSI) has declined to 49.28, down from 56.74 just two days ago. The RSI is a momentum indicator that ranges from 0 to 100 and is used to assess whether an asset is overbought or oversold.
Readings above 70 typically signal overbought conditions, while readings below 30 suggest oversold territory. Levels around 50 are considered neutral, indicating a balance between buying and selling pressure.
 XCN RSI. Source: TradingView.
With XCN’s RSI now dipping just below the 50 mark, it signals that bullish momentum may be fading. The recent drop suggests sellers are beginning to gain the upper hand, and if this trend continues, price action could start leaning bearish, after Onyxcoin became one of the top-performing altcoins in the last seven days.
While not a strong sell signal on its own, the move below 50 is often seen as an early warning that the uptrend may be stalling. If the RSI continues to slide, Onyxcoin could be at risk of further downside in the short term.
Onyxcoin BBTrend Is Still Positive But Quickly Going Down
Onyxcoin’s BBTrend has fallen sharply to 20.27, down from 64 just three days ago.
BBTrend, or Bollinger Band Trend, is a technical indicator that measures the strength of a trend based on the width and expansion of the Bollinger Bands.
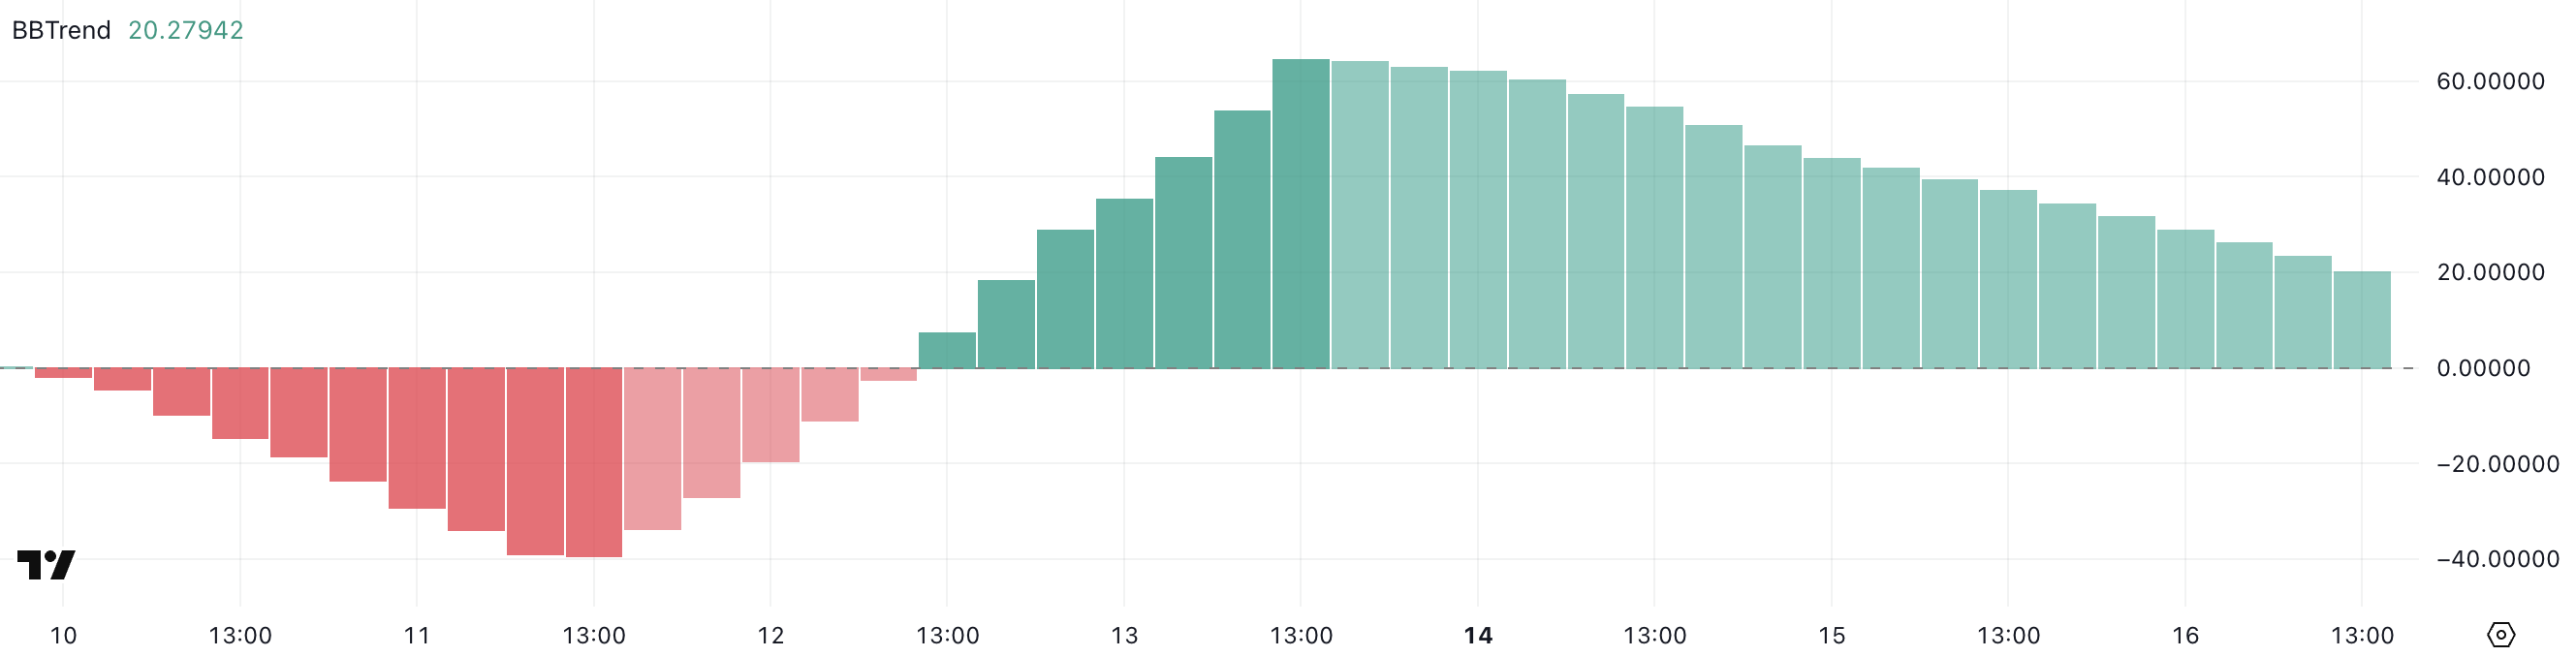 XCN BBTrend. Source: TradingView.
With XCN’s BBTrend now at 20.27, the data points to a significant loss of momentum.
This steep decline suggests that the strong trend seen earlier in the week has faded, and the price may now be entering a period of range-bound movement or potential reversal.
If no new catalyst emerges to drive buying interest, the current setup could lead to sideways action or a gradual decline as volatility contracts.
Will Onyxcoin Fall Below $0.015 Soon?
Onyxcoin EMA lines are showing early signs of weakness, with a potential death cross forming as the short-term average approaches the long-term from above.
If this bearish crossover is confirmed, it could trigger further downside and lead the price to test the support at $0.0139.
A break below that level could expose XCN to even deeper losses. If the downtrend accelerates, the next support is $0.012, followed by $0.010 and $0.00849.
 XCN Price Analysis. Source: TradingView.
However, if buyers defend the $0.0139 level and spark a rebound, Onyxcoin could regain upward momentum.
In that case, the next resistance to watch would be at $0.020.
A breakout above that could open the door for a move toward $0.027, signaling a potential recovery.

Log in to Reply
Log in to comment your thoughtsComments
Related Articles
|Square
Get the BTCC app to start your crypto journey
Get started today Scan to join our 100M+ users