Bitcoin’s Bullish Breakout Hinges on This 3-Month Low Signal — $114,900 Is the Magic Number

Bitcoin teeters on the edge of a massive breakout as a critical technical signal flashes for the first time in three months.
The Make-or-Break Level
All eyes remain locked on that $114,900 resistance barrier—crack it, and the bulls charge into uncharted territory. Fail, and we're looking at another frustrating consolidation phase that'll have traders questioning their life choices.
Reading the Signals
This isn't just another false dawn. The three-month low signal that just triggered has historically preceded major moves. When institutional money meets technical confirmation, even the most cynical Wall Street veterans start paying attention—though they'll never admit it over their morning coffee.
The market holds its breath. Break through $114,900, and Bitcoin rewrites the rulebook. Stall here, and we're just another statistic in the volatile crypto history books—proving once again that in finance, sometimes the only thing predictable is the unpredictability.
More Holders Are Buying Again as Market Confidence Slowly Returns
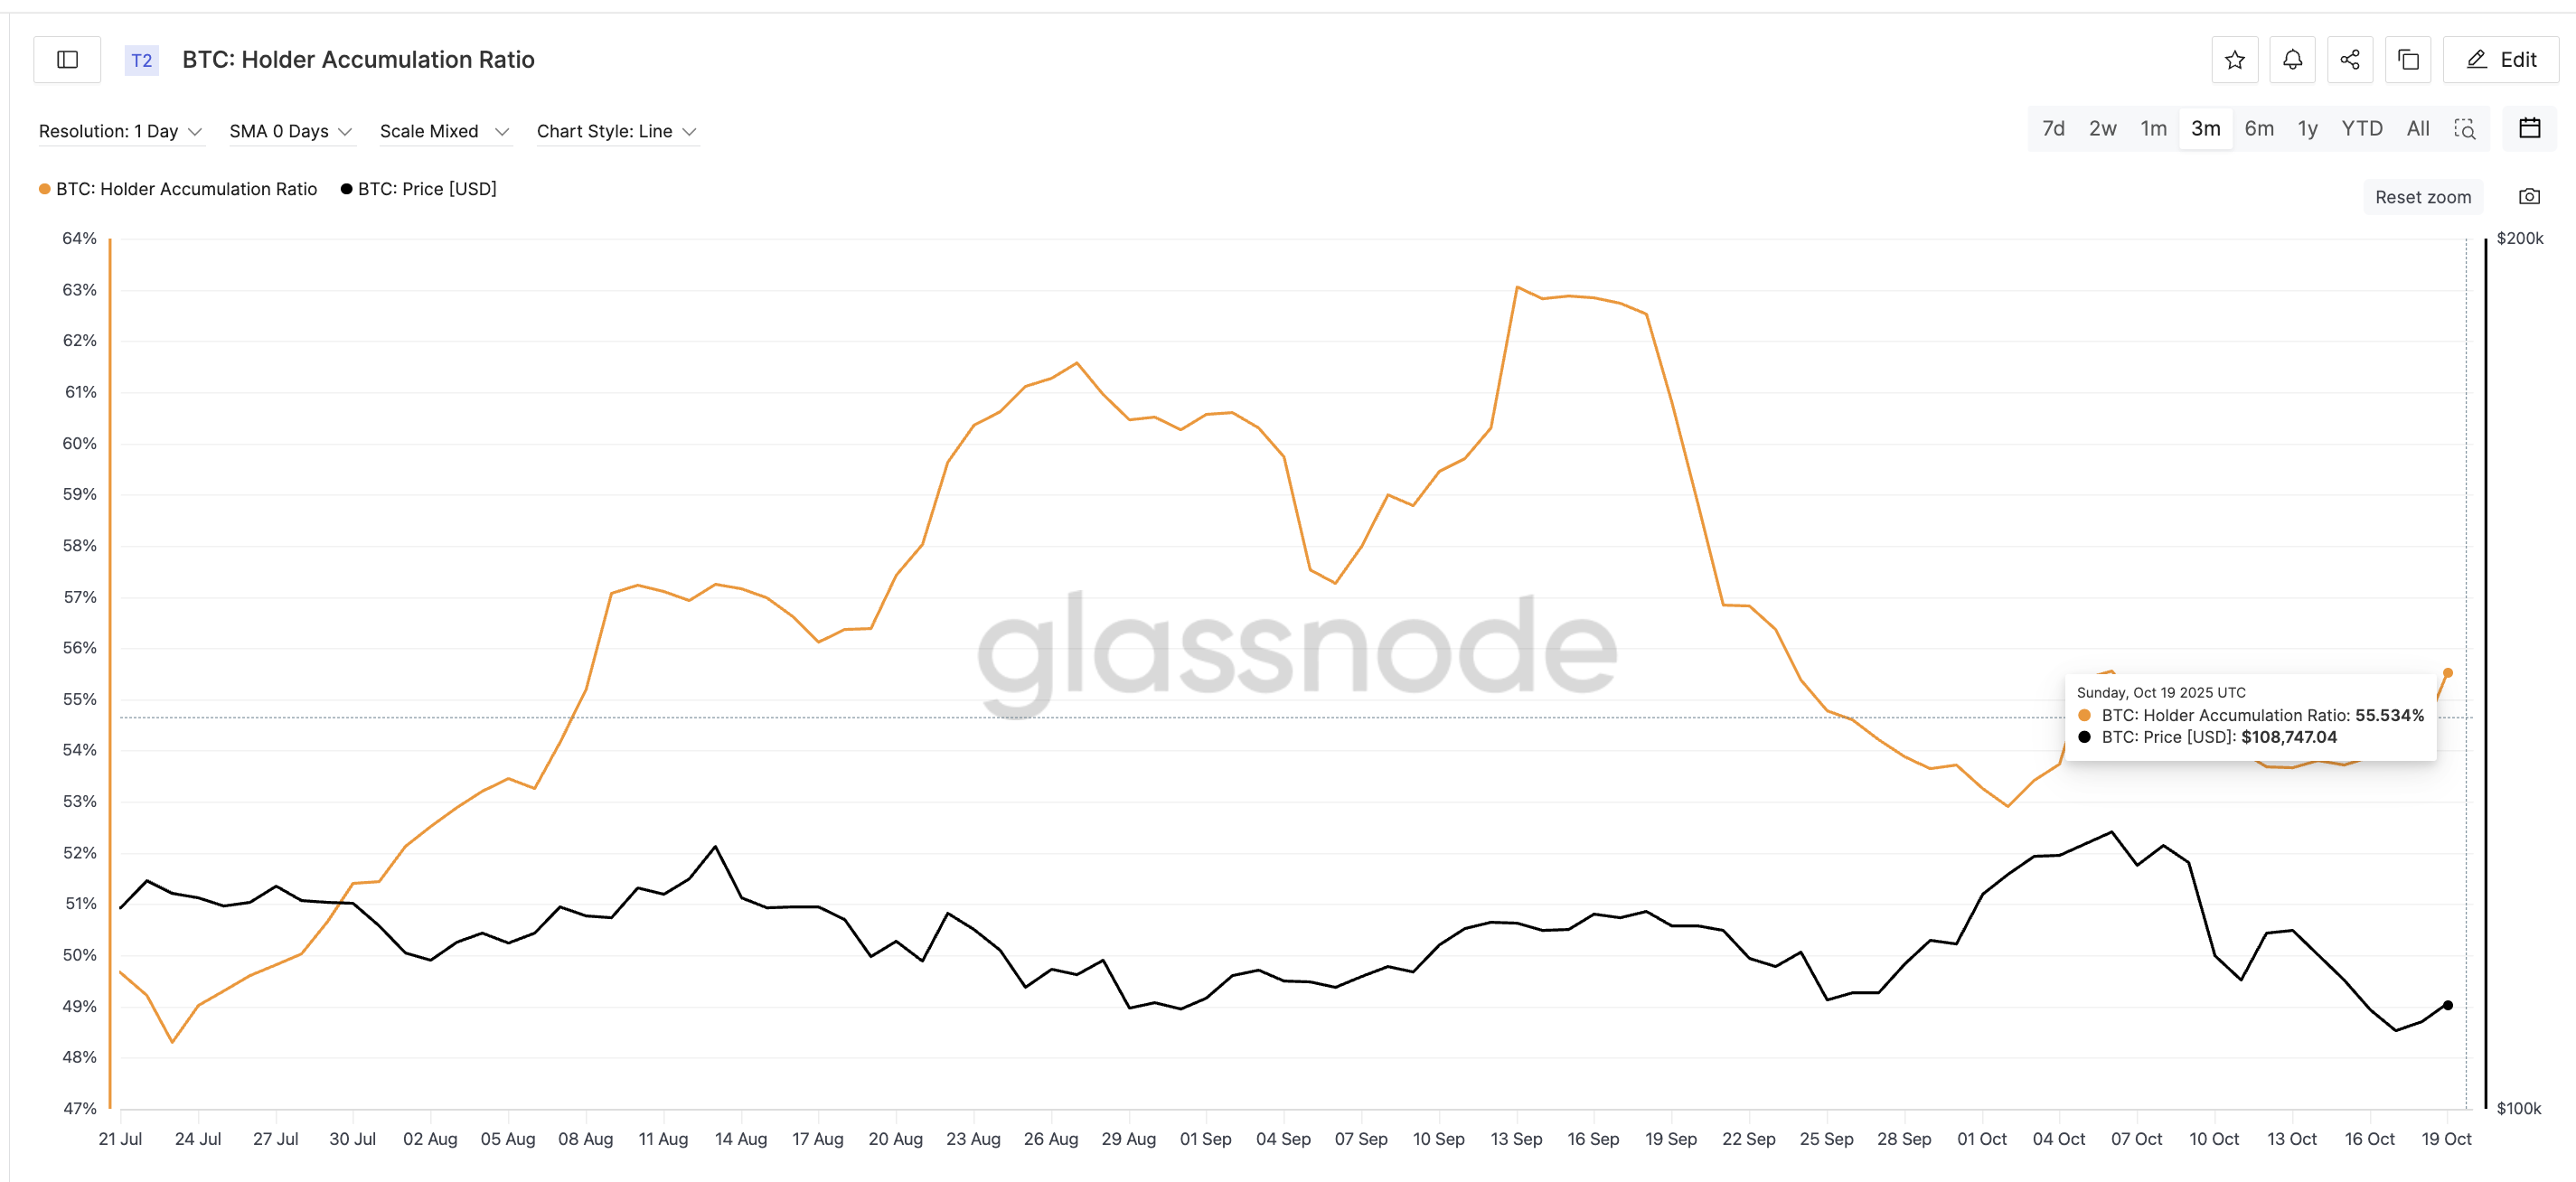
The Holder Accumulation Ratio (HAR), which measures how many active holders are increasing their positions versus reducing them, shows improving confidence.
Although the ratio trended down since September 13, reaching a low of 52.91% in early October, it has since rebounded to 55.53%, signaling renewed accumulation behavior.
When this ratio stays above 50%, it typically means long-term bitcoin holders are buying more than selling – a bullish sign.
Sign up for Editor Harsh Notariya’s Daily crypto Newsletter here.
The Net Unrealized Profit/Loss (NUPL), which tracks whether the market is in profit or loss, also supports this view. After hitting a three-month low of 0.48 on October 17, it has begun to turn upward.
As NUPL is still under 0.50 and NEAR the 3-month low, profit-taking doesn’t look like an immediate hurdle.
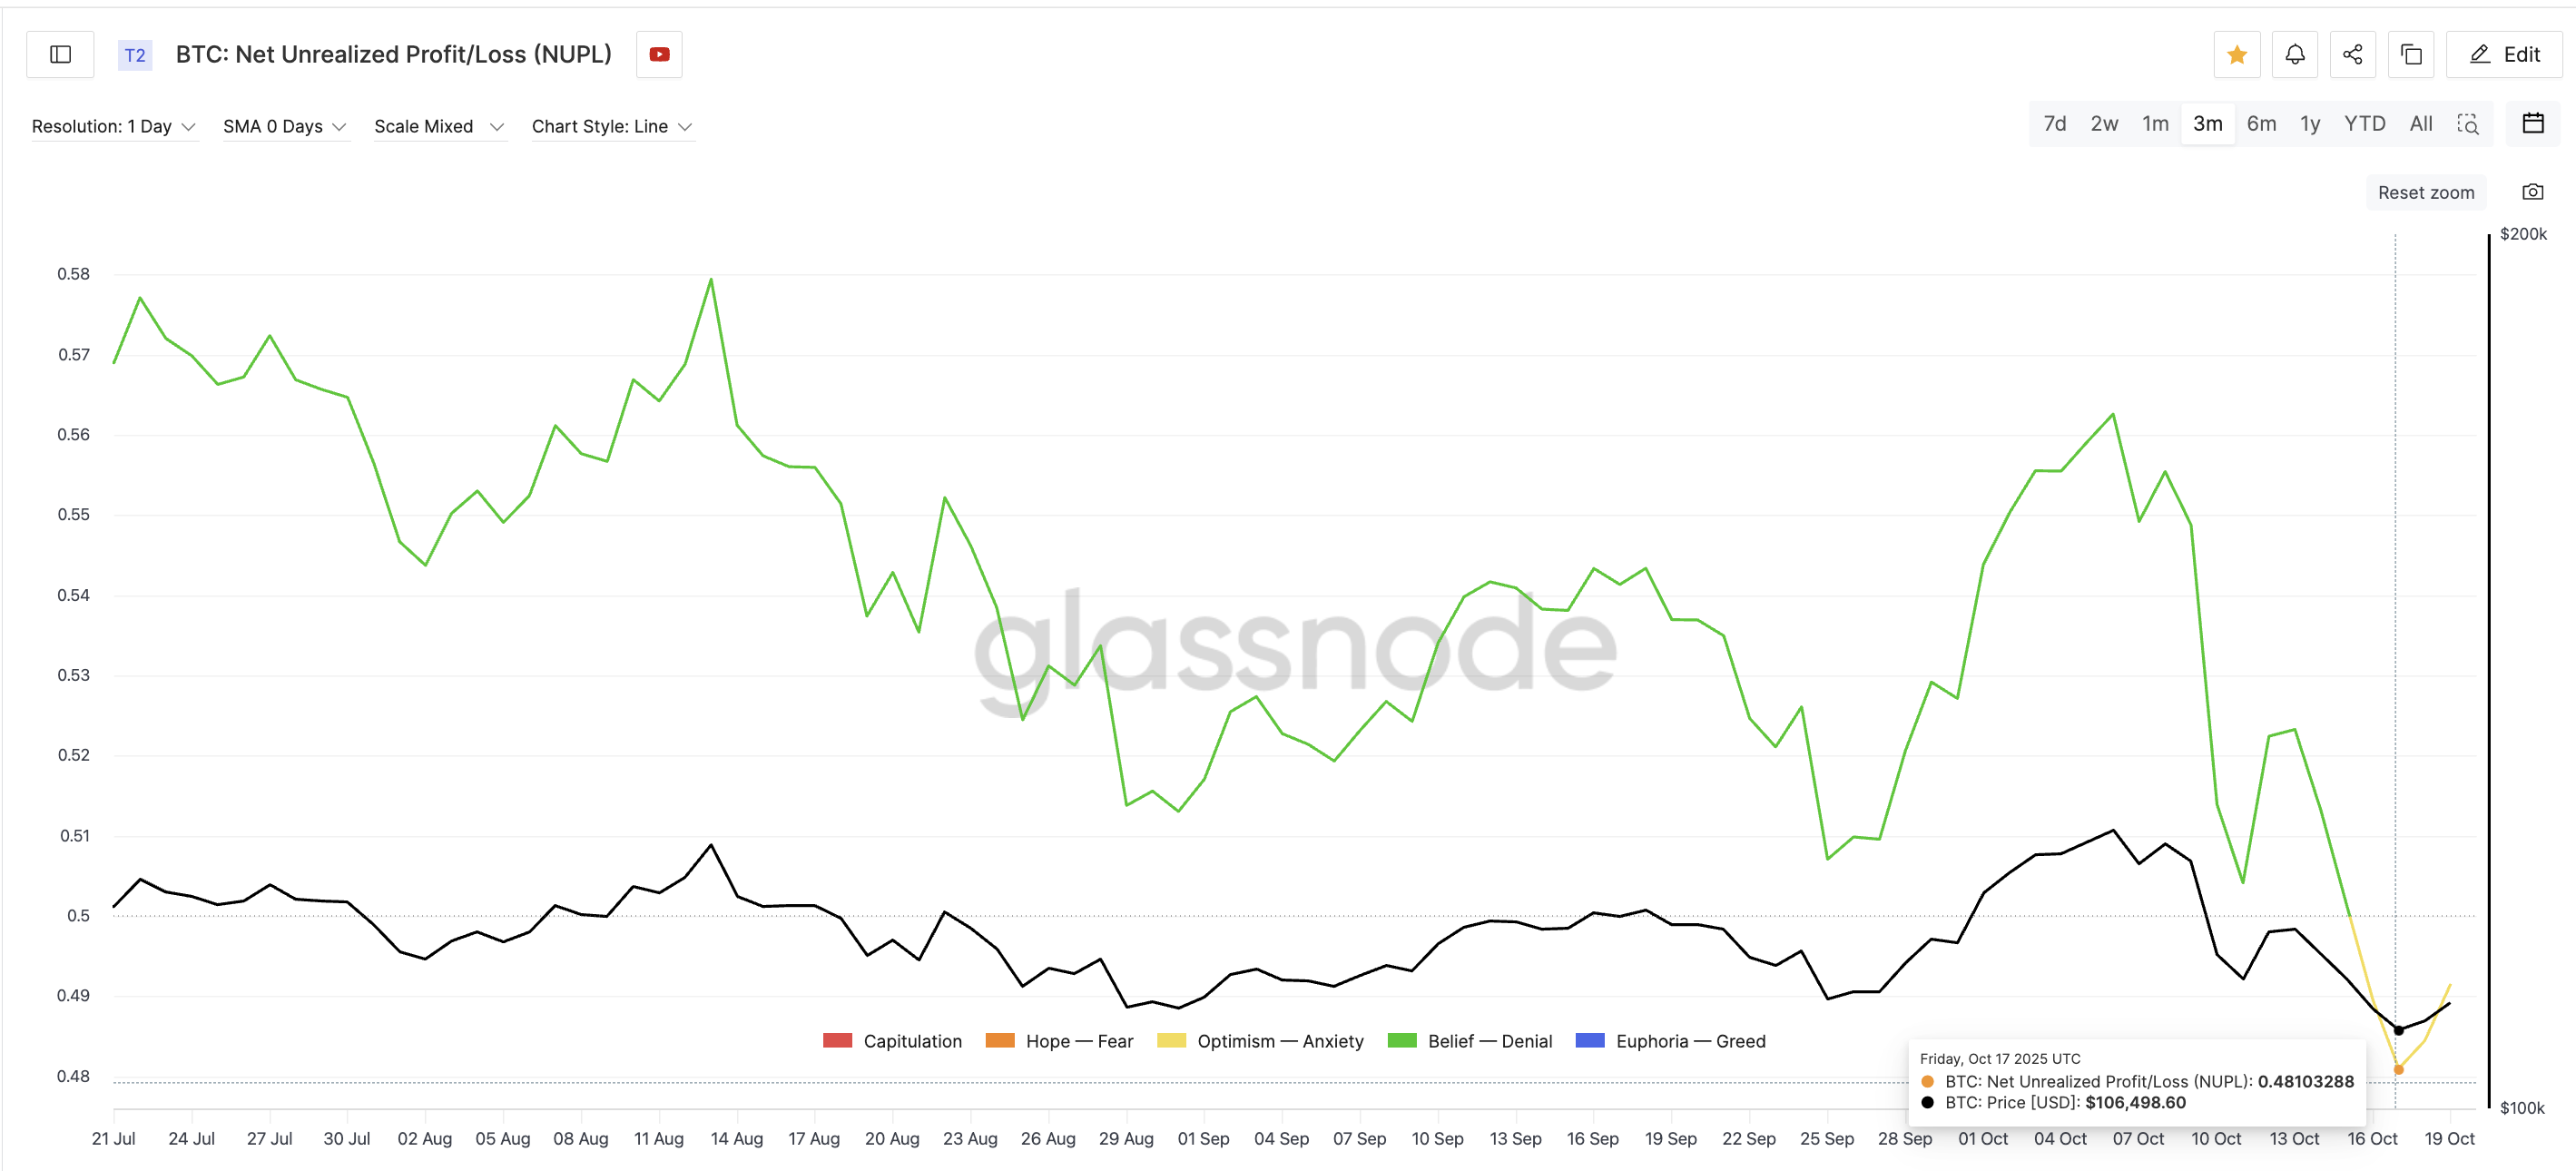
Historically, a similar dip on October 11 preceded a quick rally from $110,810 to $115,321 (a 4% rise) within two days. This setup suggests that Bitcoin could once again be entering an accumulation phase before a breakout.
Combined, these two on-chain signals show that investor confidence and profitability are recovering, even though sentiment remains cautious.
Bitcoin Price Chart Pattern Hints at a Breakout If $114,000+ Gives Way
On the daily chart, Bitcoin is trading within a falling wedge, a bullish reversal pattern that often precedes upward movement. The structure shows both trendlines converging downward, but with volume steadily declining, confirming the wedge’s validity.
This setup usually ends with a breakout above the upper trendline, supported by increasing volume and renewed buying pressure. At the time of writing, BTC trades near $111,346, having flipped $108,918, a key resistance, into support.
The next major level to watch is $112,242, which aligns with the upper boundary of the wedge. A daily close above $114,928 (zone that has capped previous recovery attempts) WOULD confirm a breakout.
And it would likely open the path toward $117,615 and $121,440, which are 5.6% and 9% above current levels, respectively.
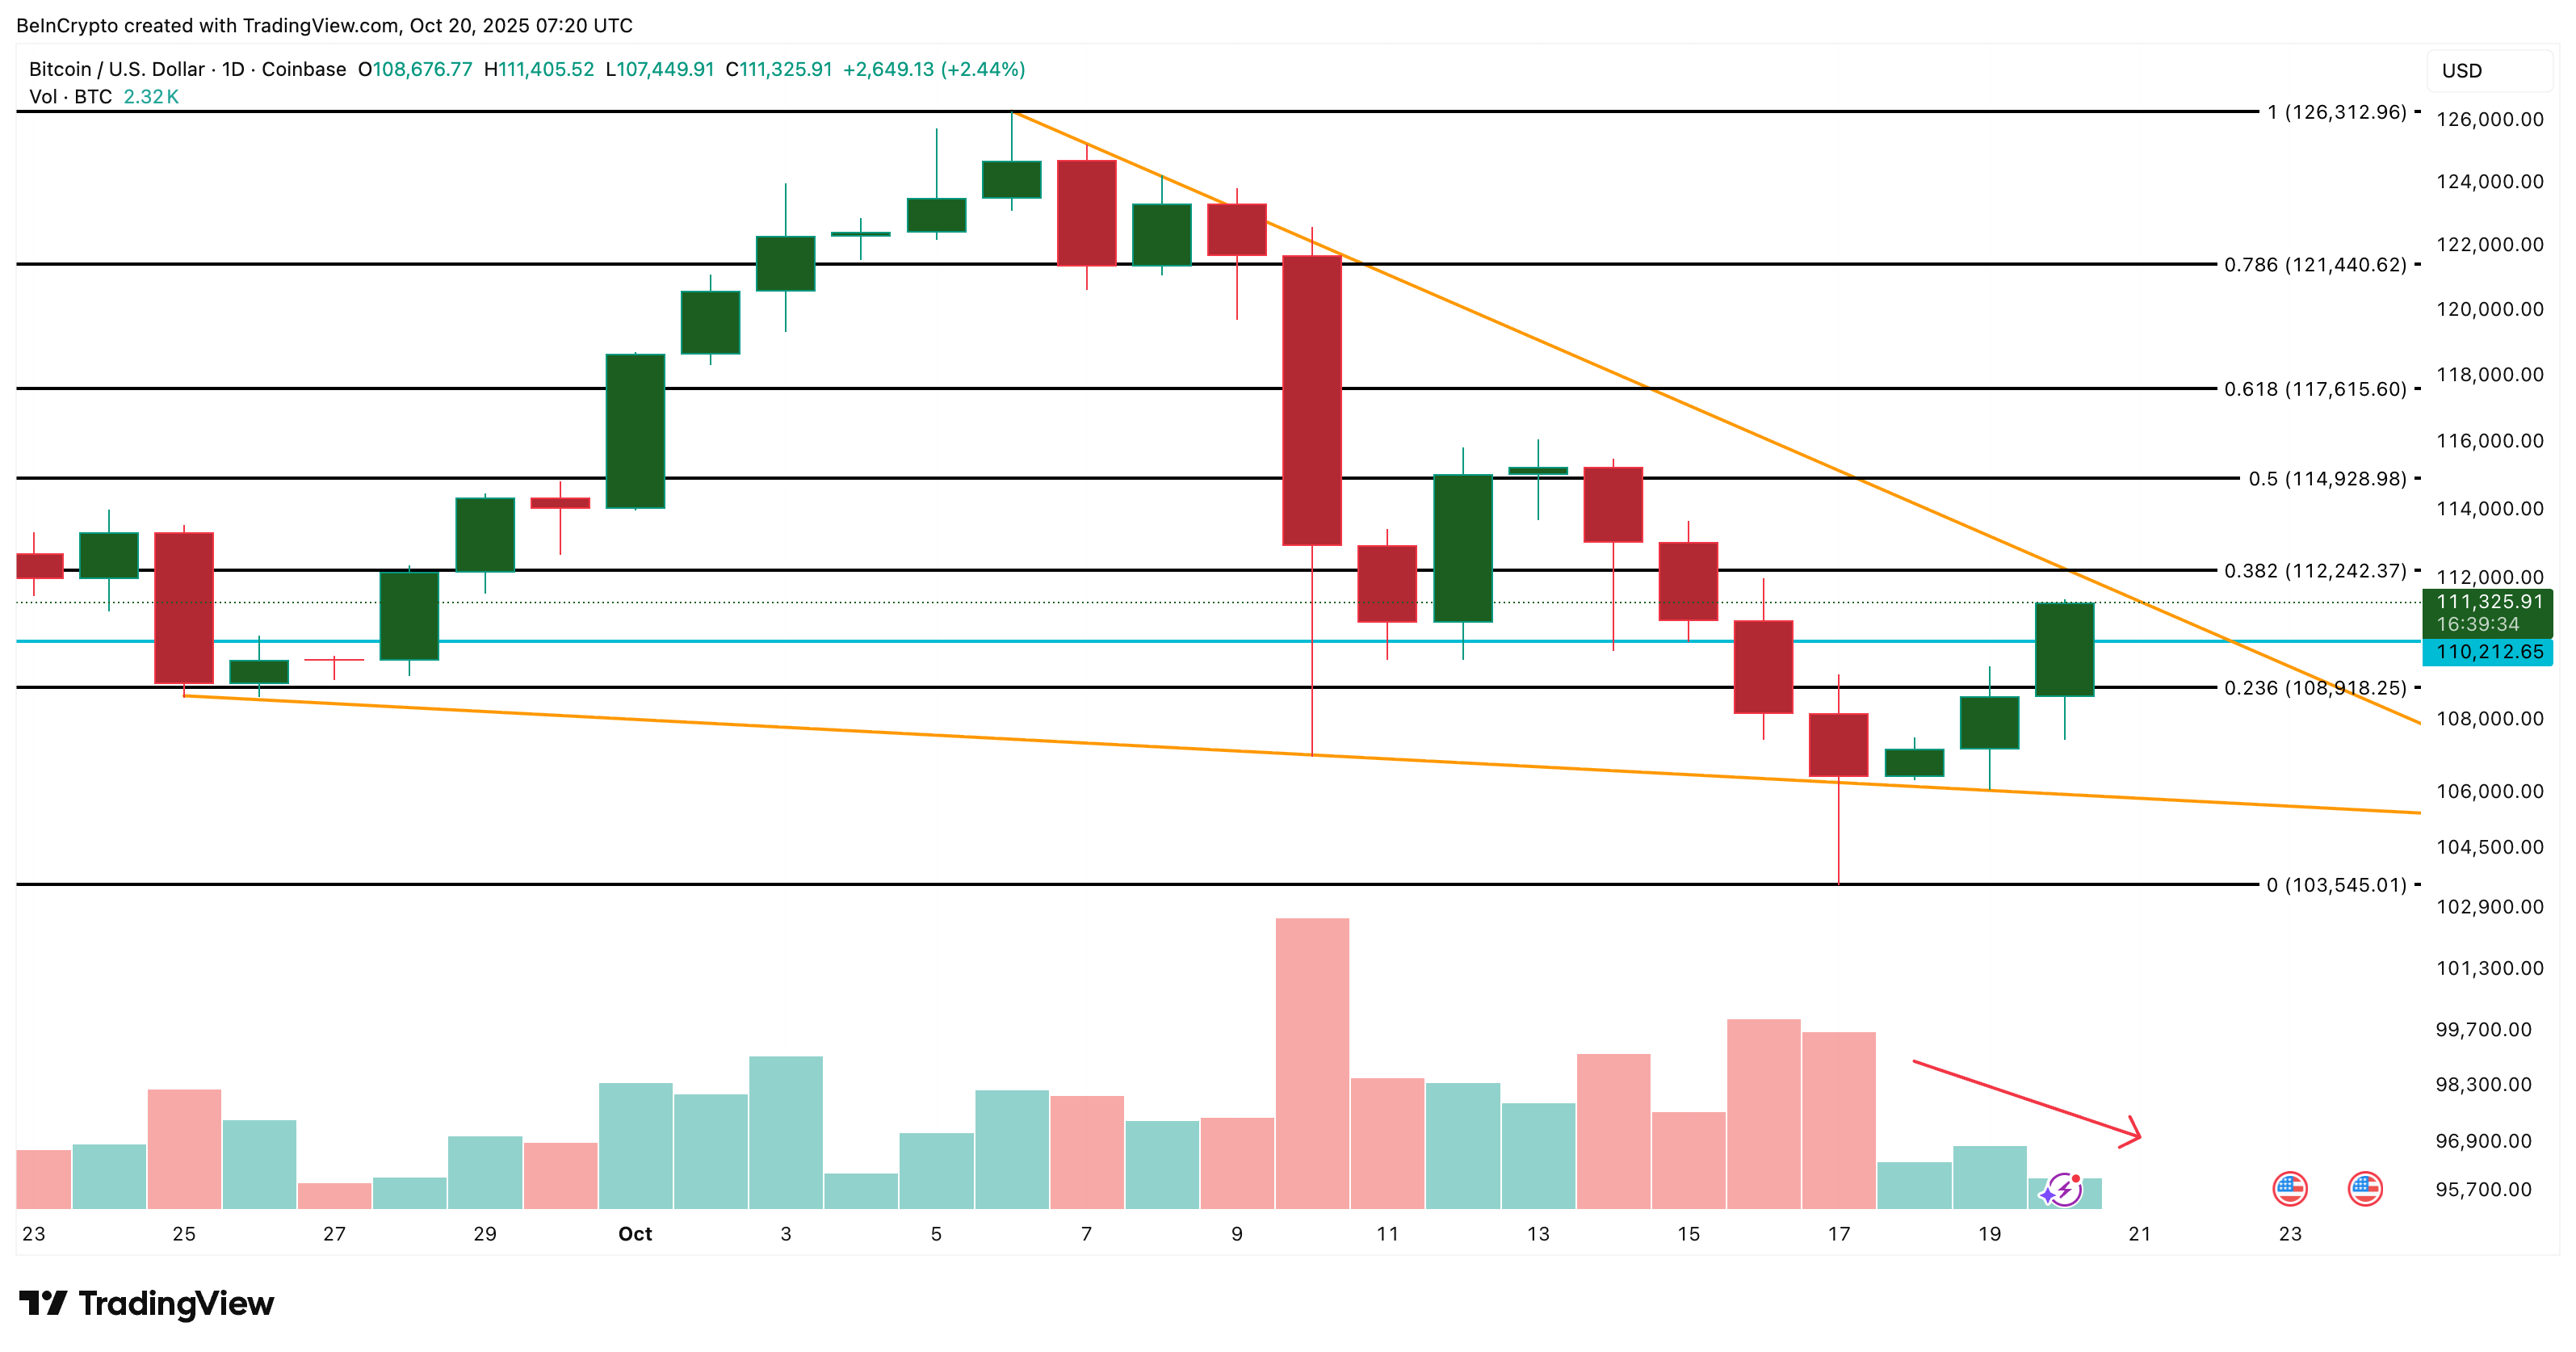
If BTC fails to hold $108,918, however, the short-term bullish bias would weaken, with potential downside targets at $103,545 – the lower boundary of the wedge.
