Zcash (ZEC) Chart Flashing Bull Trap Warning - 30% Plunge Imminent?

ZEC's technical setup screams danger - that bullish breakout might just be the market's latest mirage.
The Pattern That Should Scare Every ZEC Holder
Classic bull trap formation unfolding right now. Price action suggests institutional players are dumping while retail chases the pump. The 30% downside risk isn't just analyst speculation - it's written in the charts themselves.
When the 'privacy coin' narrative meets technical reality
Zcash bulls are about to learn the oldest lesson in crypto: charts don't lie, but they will separate you from your money if you ignore the warnings. Another case of 'this time it's different' meeting 'no, it's actually exactly the same.'
Big Money Is Exiting While Leverage Builds Up
The Zcash Price is showing early signs of exhaustion as large money inflows start to fade. On-chain readings from the Chaikin Money Flow (CMF), which measures the strength of buying and selling pressure using both price and volume, reveal a steady decline since October 1.
CMF remains above the zero line at press time. This means some inflows persist, but the series of lower highs signals that institutional and whale money are quietly exiting Zcash positions.
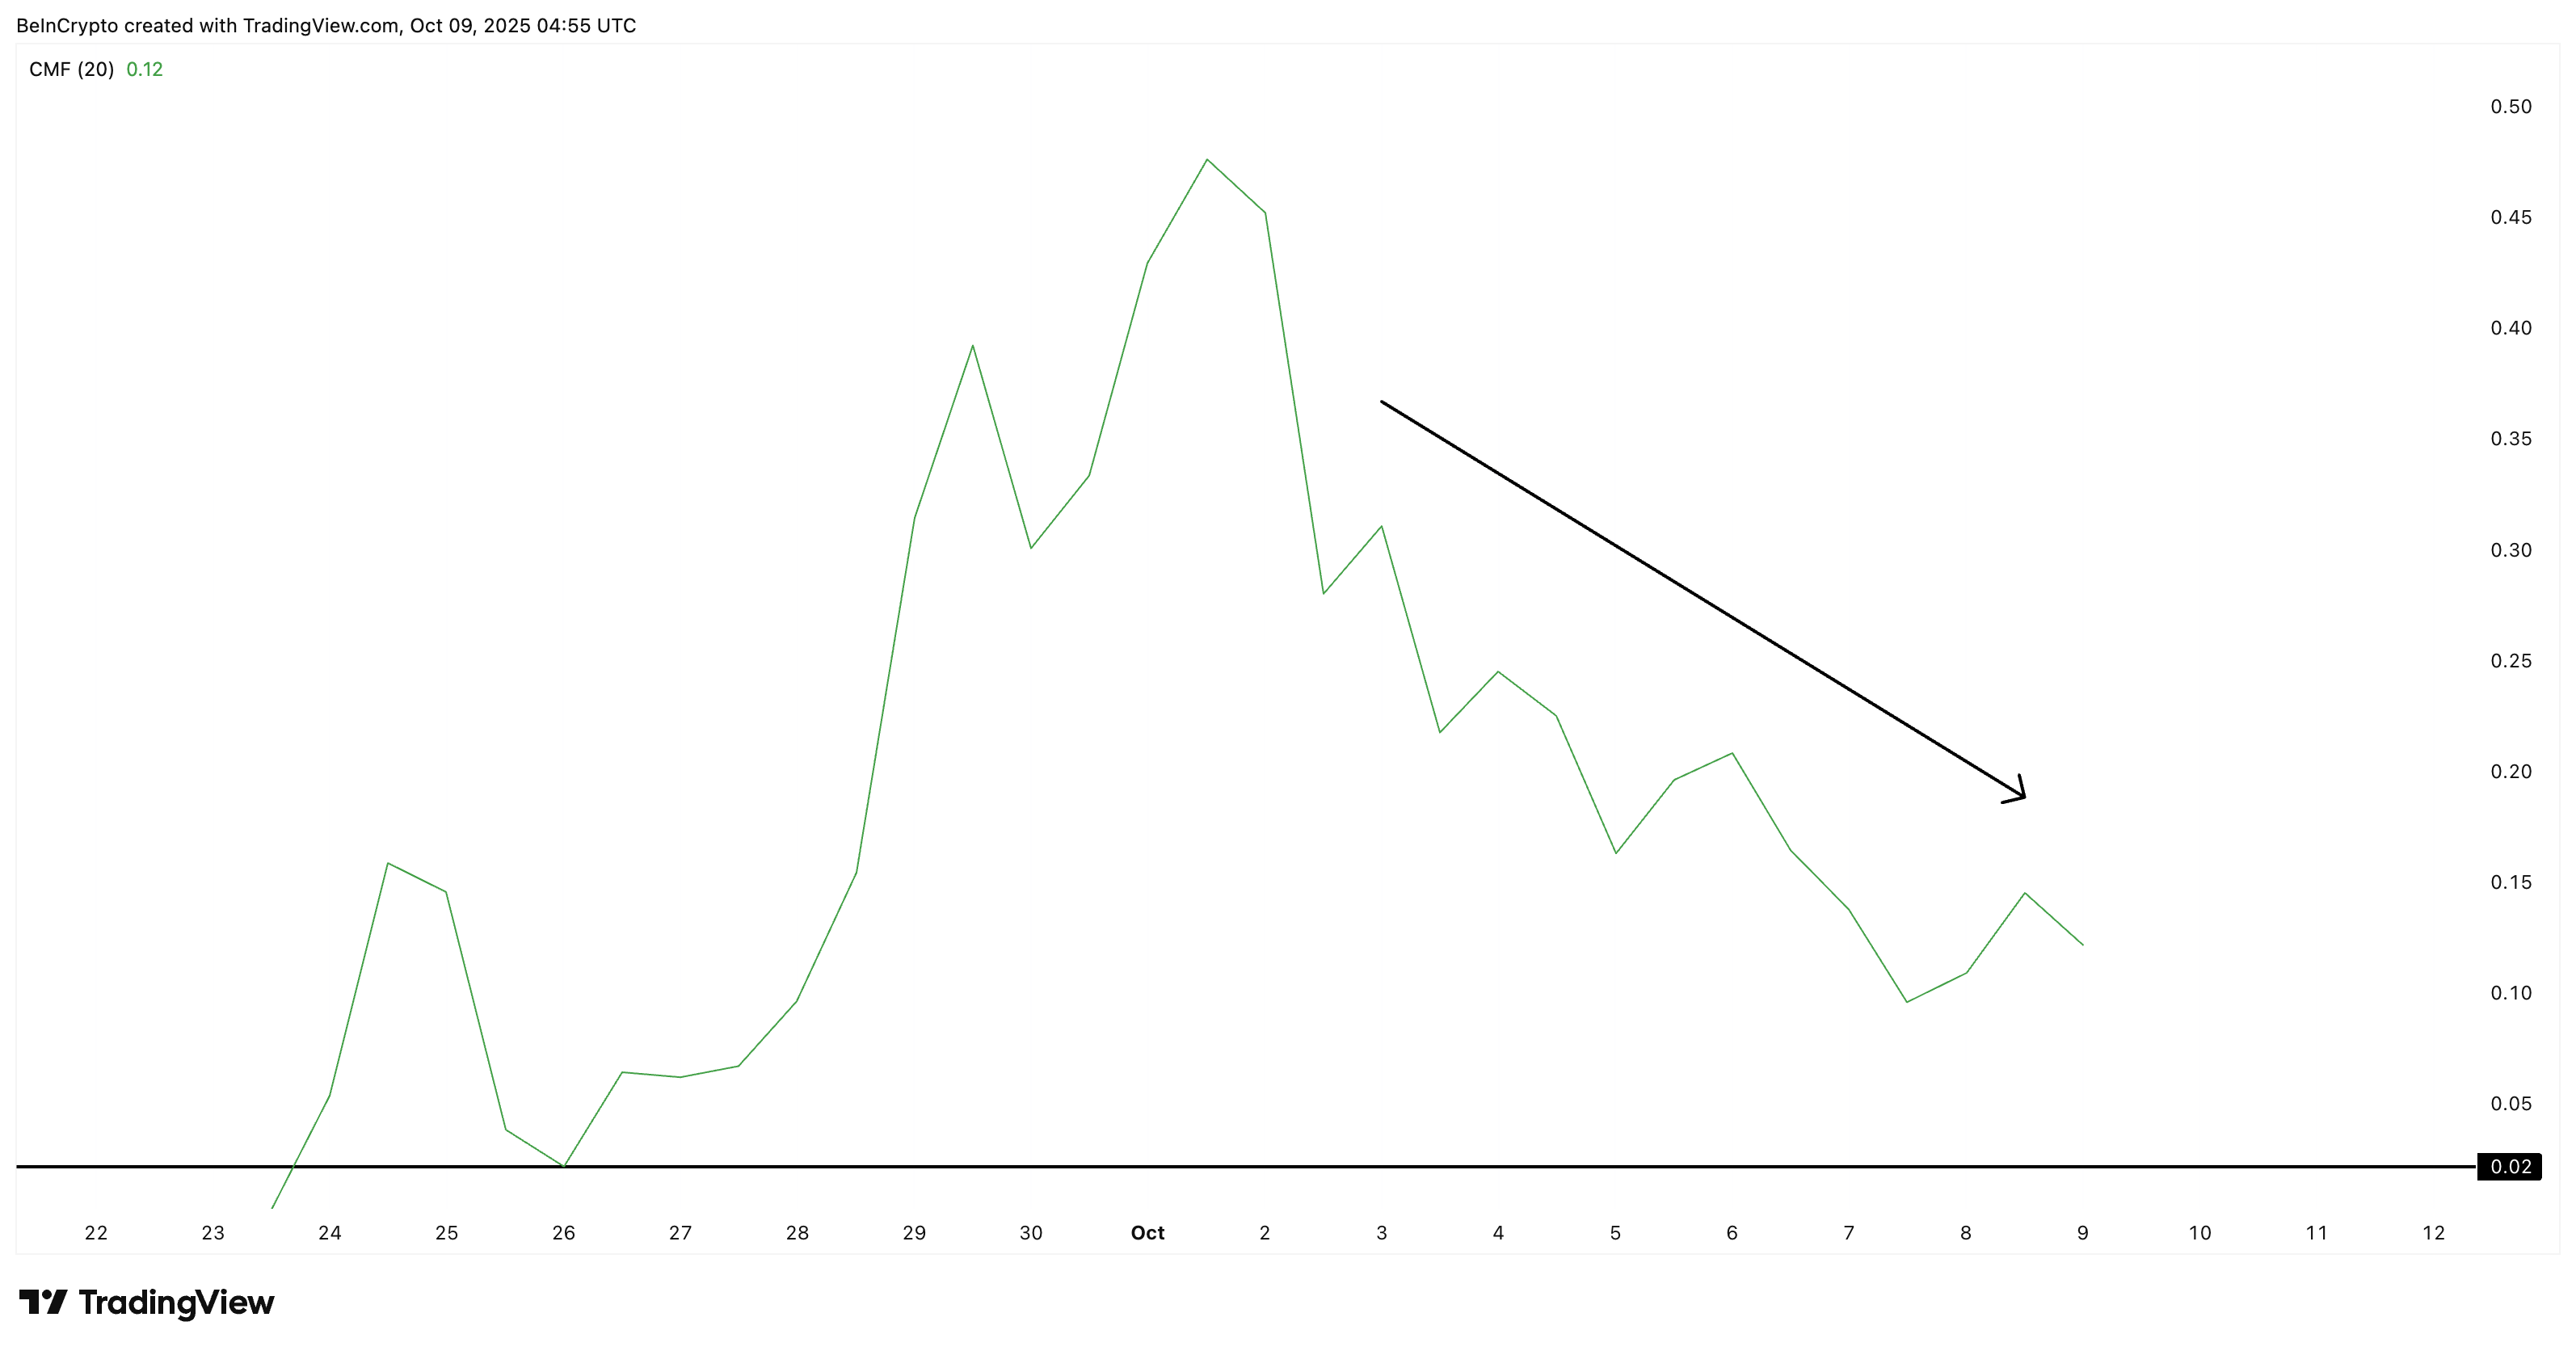
This fading CMF trend often precedes a shift in momentum. It also suggests that buying demand is slowing even as price pushes higher. In simple terms, the rally is being sustained more by retail enthusiasm than by strong capital inflows.
? Sign up for Editor Harsh Notariya’s Daily crypto Newsletter here.
At the same time, derivatives data adds to the risk narrative. On the Binance ZEC/USDT perpetual pair, cumulative long liquidations stand at $16.05 million, compared to only $3.65 million in shorts.
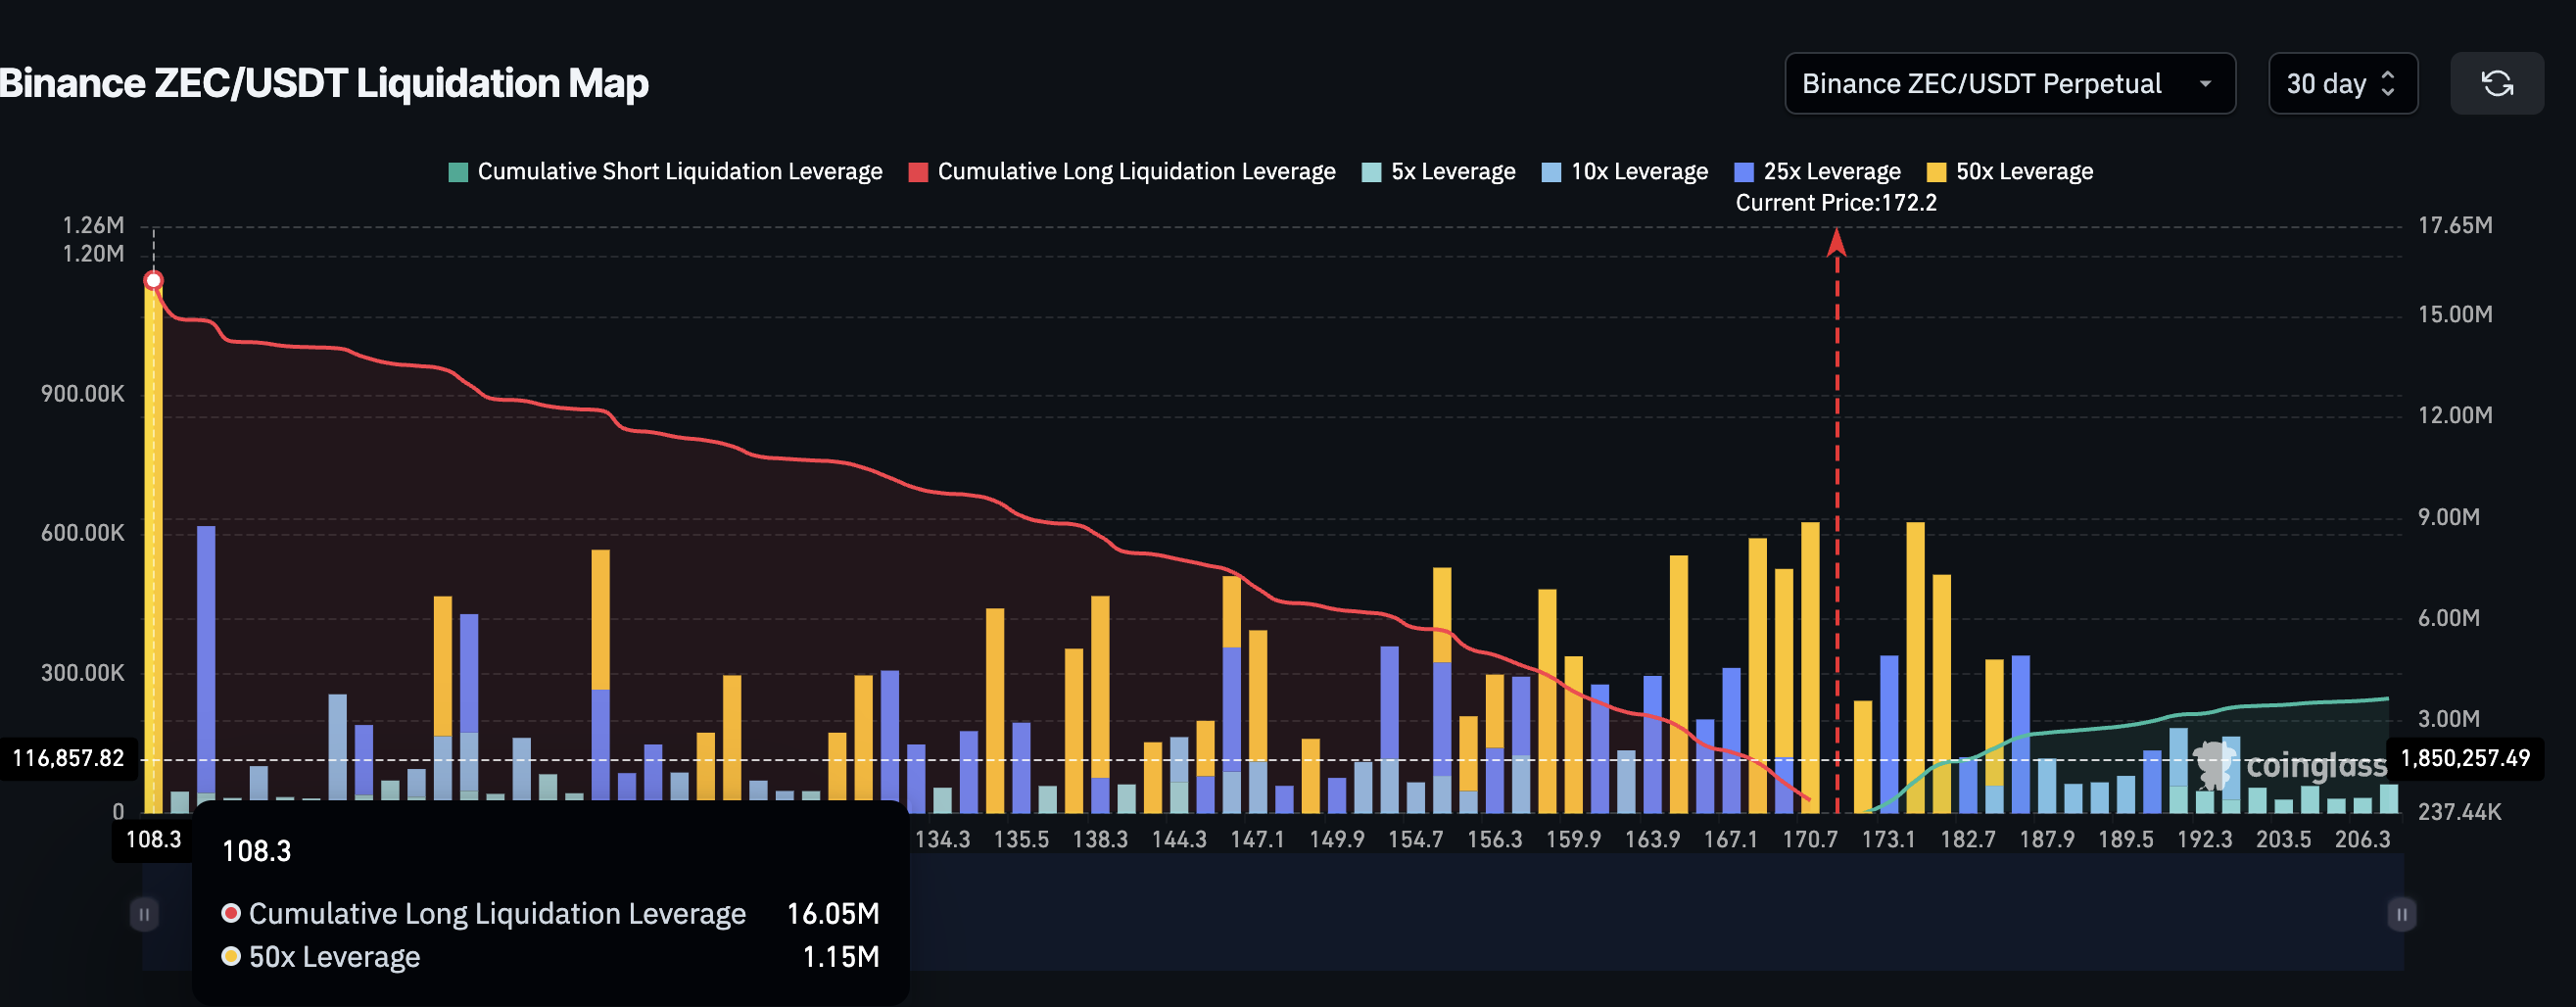
This sharp imbalance on one exchange alone shows that most traders across major exchanges are over-leveraged on the long side. This, too, leaves Zcash vulnerable to a long squeeze when forced liquidations cascade as prices drop, accelerating the fall.
Together, these signals show that Zcash’s latest price bounce is built on a weak footing, with institutional money exiting and speculative leverage piling up.
Bearish Pattern and Divergence Confirm the Zcash Price Trap
The 12-hour Zcash price chart reinforces the bull trap thesis. The token is trading NEAR the upper trendline of a rising wedge, a structure that usually breaks downward once momentum fades. Between October 2 and October 8, the Zcash price made higher highs, while the Relative Strength Index (RSI), which measures buying momentum, made lower highs.
This bearish divergence means that although the Zcash price rose, the strength behind those moves weakened. In other words, buyers are losing conviction while sellers are gradually stepping in, a classic sign of an upcoming correction.
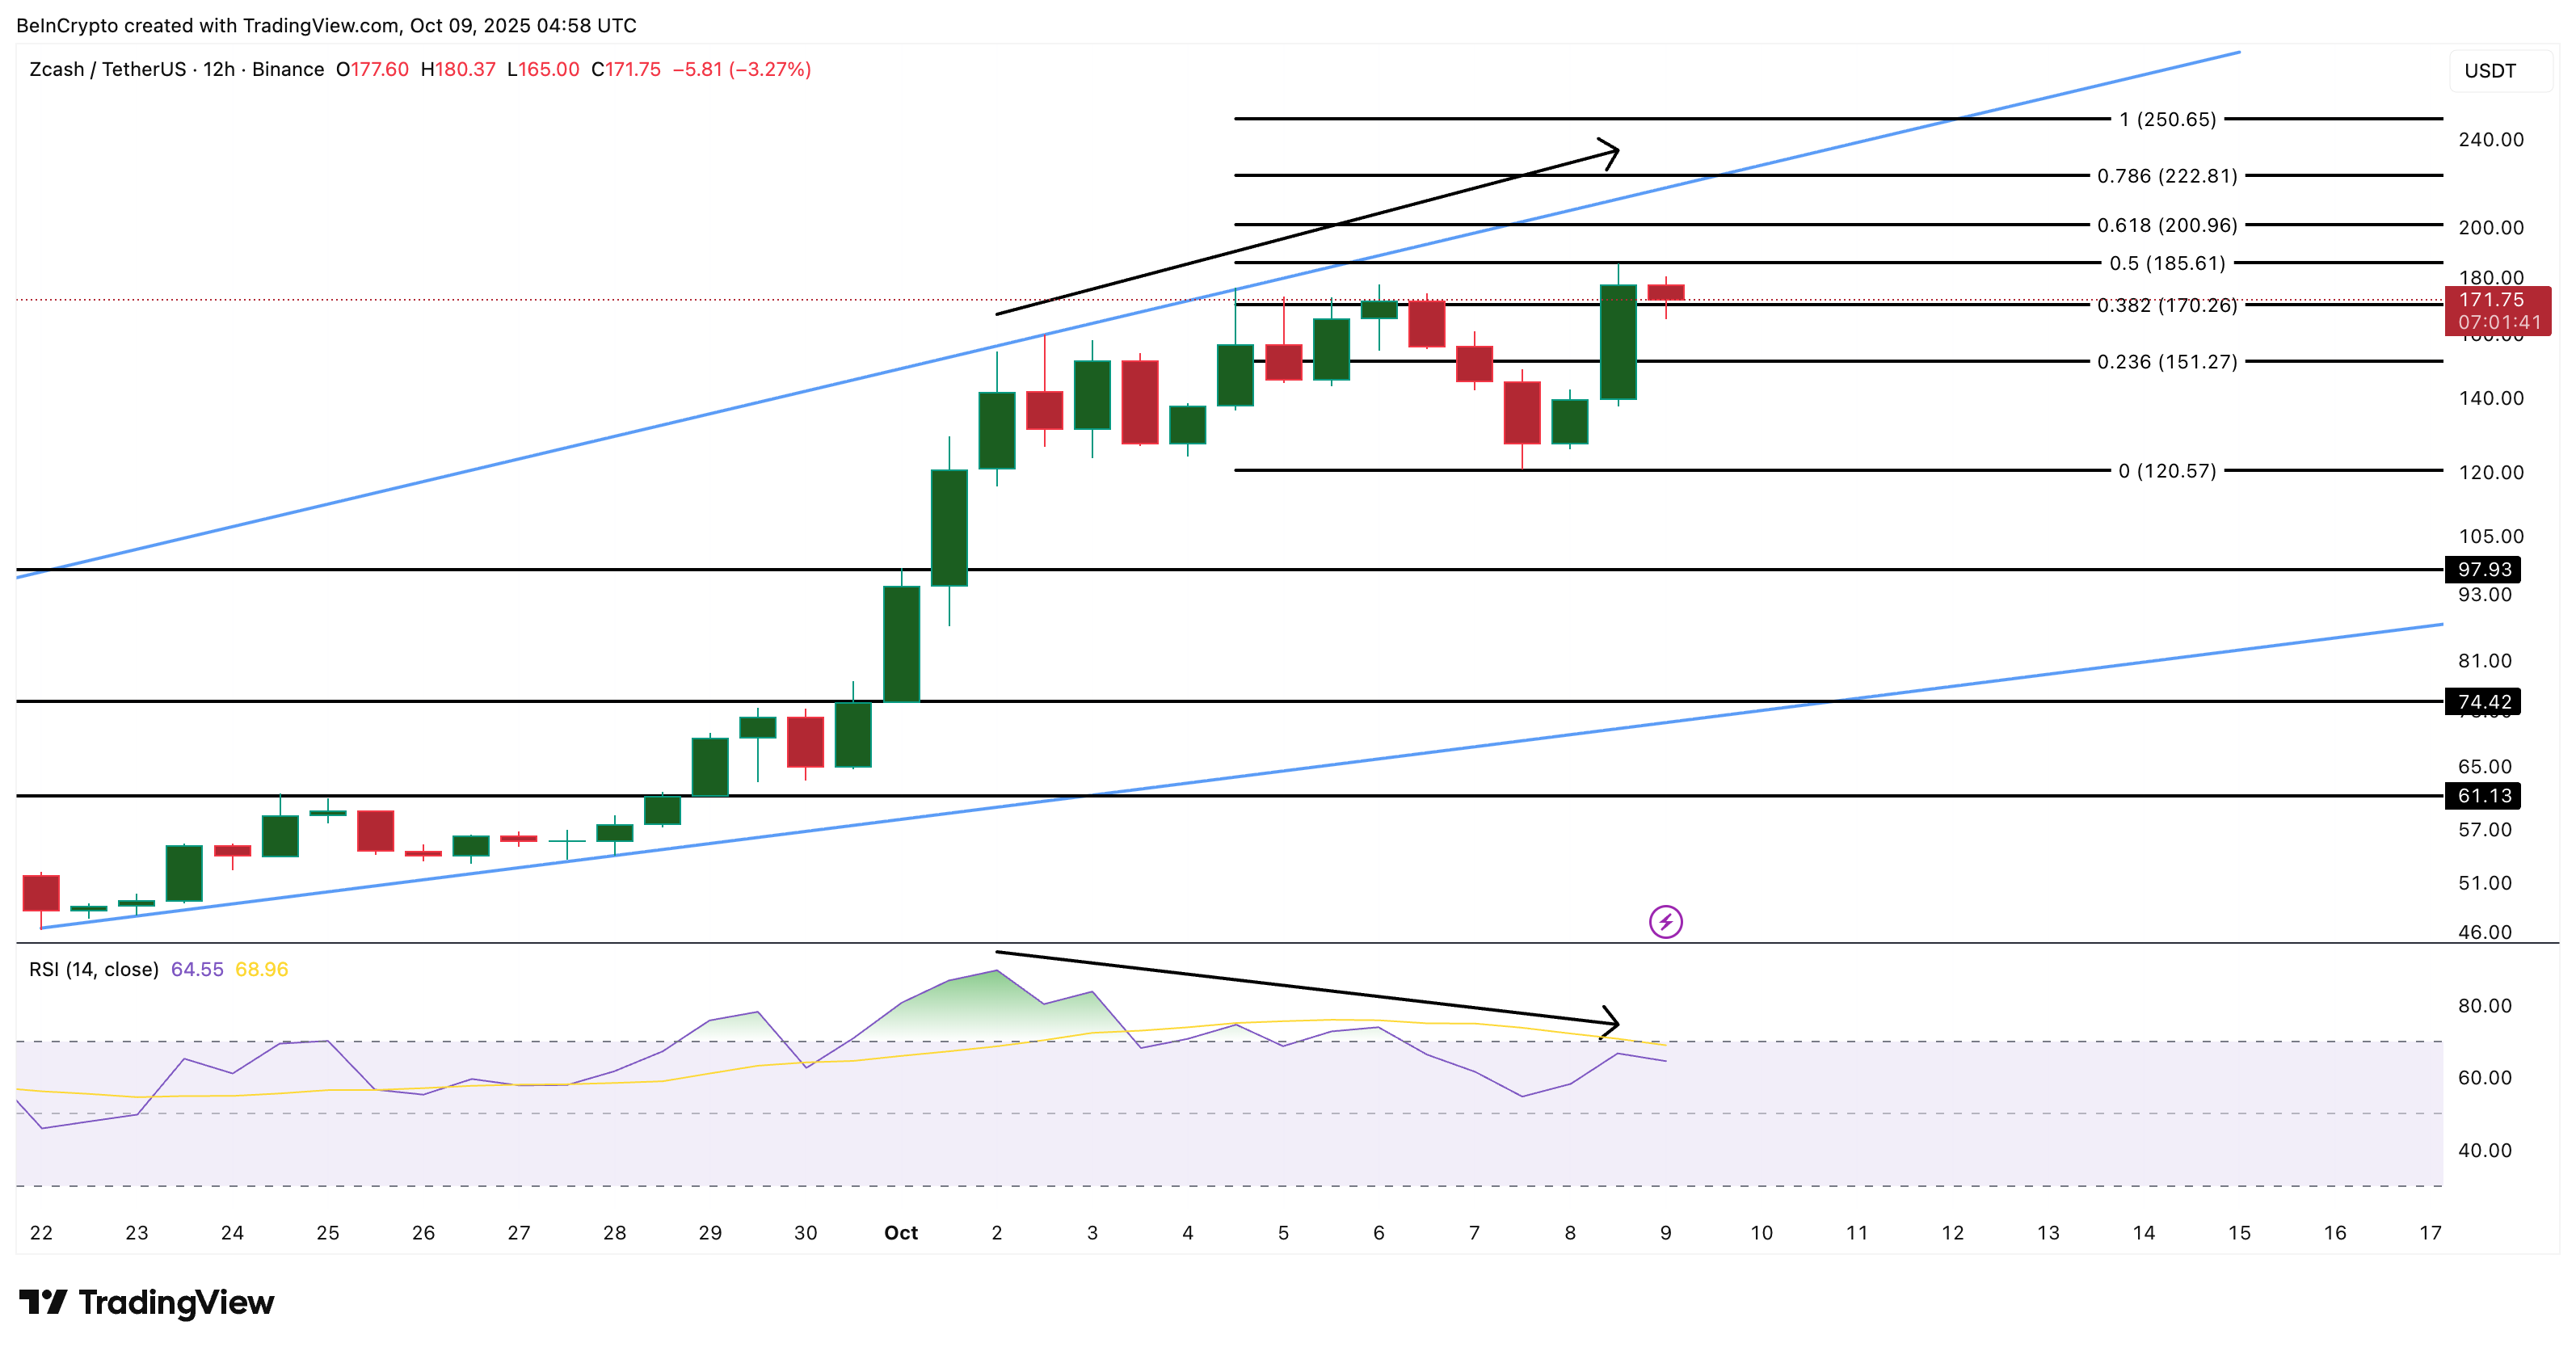
If this pattern plays out, a drop below $151 (the 0.236 Fib level) could confirm the breakdown, potentially sending the Zcash price down to $120 (the 0 Fib level), a fall of nearly 30% from current levels. In a deeper correction, $97 could serve as the next historical support. Also, a dip under $74 WOULD lead to a wedge breakdown and risk a fall to even $61.
However, a decisive breakout above $222 (the 0.786 Fib extension level) would invalidate this bearish setup, suggesting that buyers have regained control and negating the bull trap narrative.
