Solana’s 4-Year September Win Streak Cracks Under Network Activity Pressure

Solana's September dominance hits a wall as network metrics flash warning signs.
Breaking the Pattern
The blockchain that defied seasonal trends now faces its first September slump in four years. Transaction volumes dip while developer activity shows unusual quietude.
Behind the Numbers
Daily active addresses slide 15% month-over-month. NFT trading volume drops 22% from August peaks. DeFi TVL holds steady but fails to attract fresh capital injections.
Market Realities
Traders eye the September curse—historically crypto's weakest month. Solana's resilience finally meets macro headwinds even high-throughput blockchains can't bypass.
Network health remains robust despite usage dips. Validator participation stays near all-time highs. But momentum needs more than technical specs—it needs users actually using the chain. Maybe Wall Street's 'infrastructure plays' should try building something people want.
SOL Network Activity Declines, Market Sentiment Turns Negative
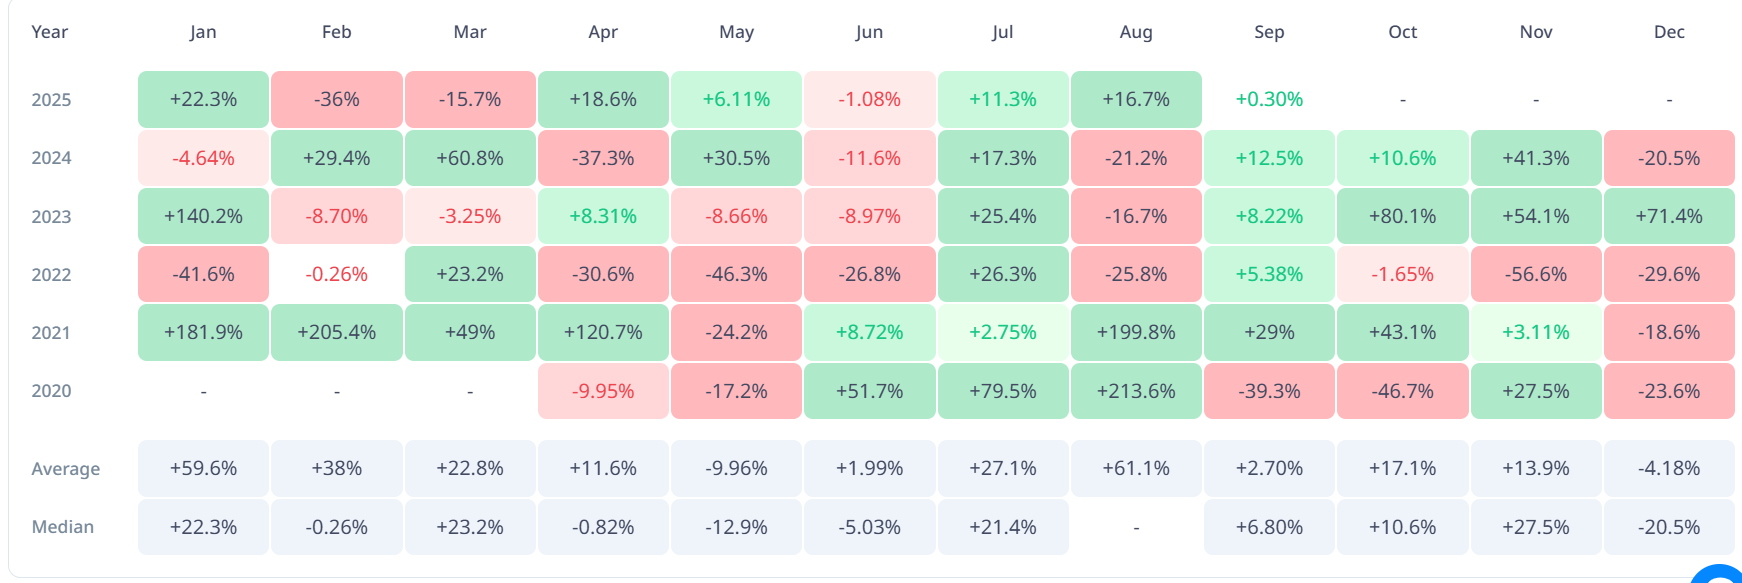
Over the past four years, September has consistently delivered gains for SOL. In 2021, SOL surged by 29%, followed by a more modest but steady 5.38% rise in 2022. The momentum strengthened in 2023, when the token climbed 8.22%, and continued in 2024 with a solid 12.5% increase.
: Want more token insights like this? Sign up for Editor Harsh Notariya’s Daily crypto Newsletter here.
However, this year appears different, as SOL looks poised to close September at a low, breaking its winning streak.
Despite starting the month strongly, SOL peaked at $253.51 on September 18 but has since fallen roughly 17%, reflecting growing bearish pressure.
This drop is partly attributed to the waning bullish sentiment in the market and primarily due to the weakening user engagement on the solana network.
According to Artemis, the total number of daily active addresses interacting with Solana-based protocols has totaled 3.04 million month-to-date, declining by 25%.
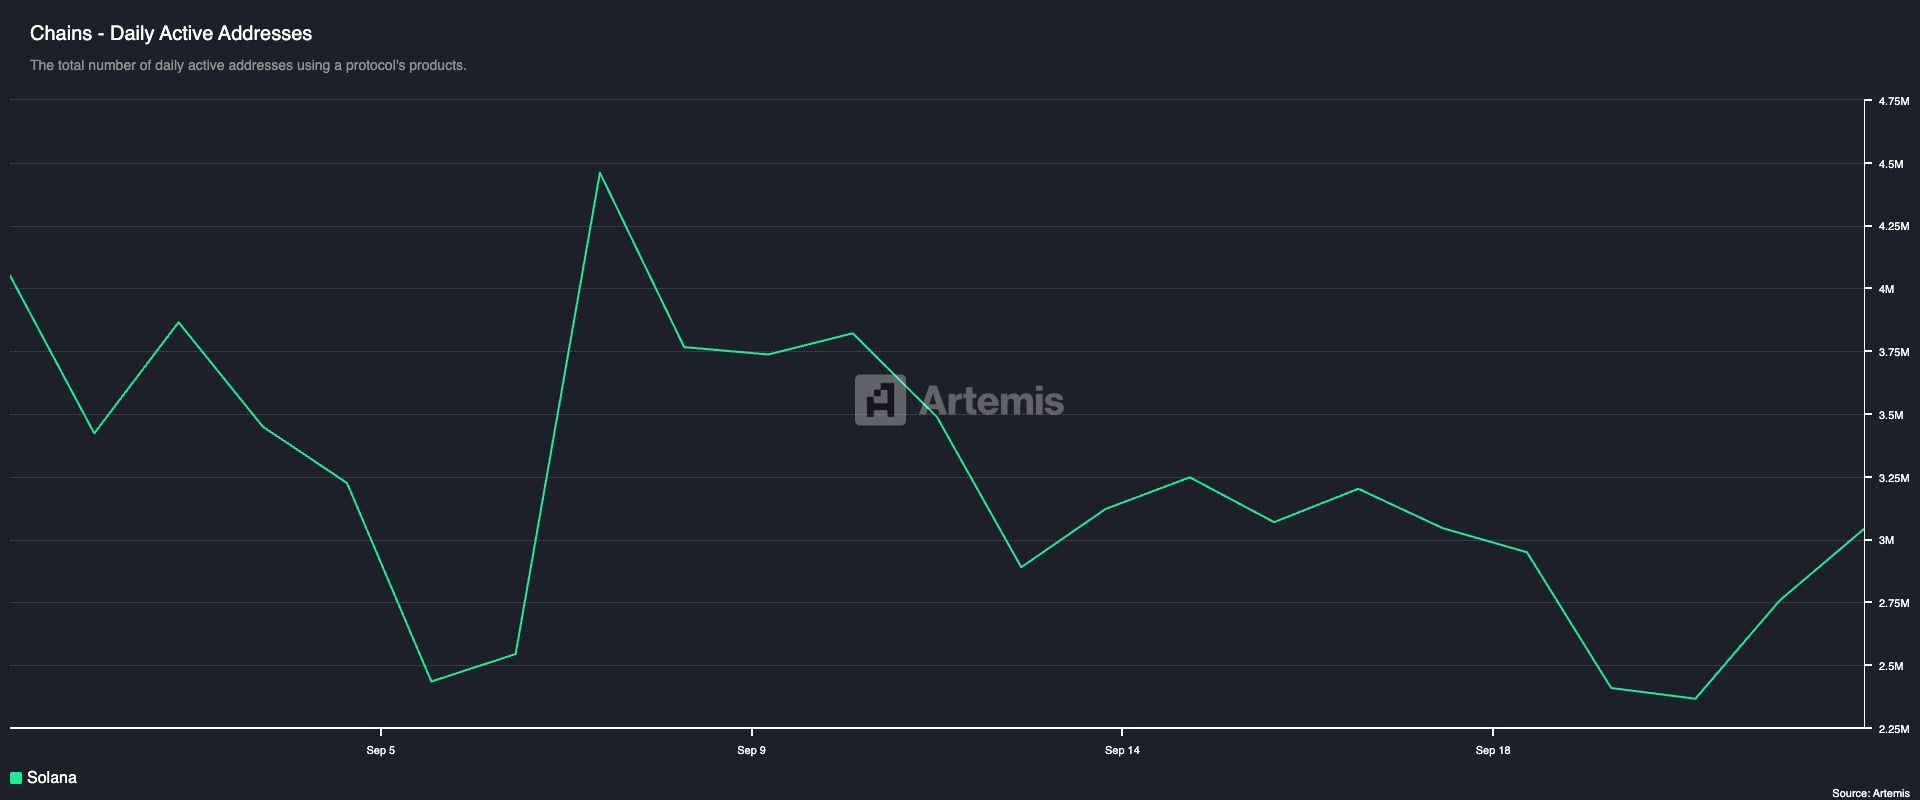
Daily active addresses represent the number of unique wallets actively sending, receiving, or interacting with on-chain applications. When it falls, it signals weakening user engagement and lower network activity, which can reduce overall demand for the coin.
On the technical side, SOL’s plummeting Relative Strength Index (RSI) on the daily chart confirms the falling demand. At press time, this momentum indicator is at 40.54.
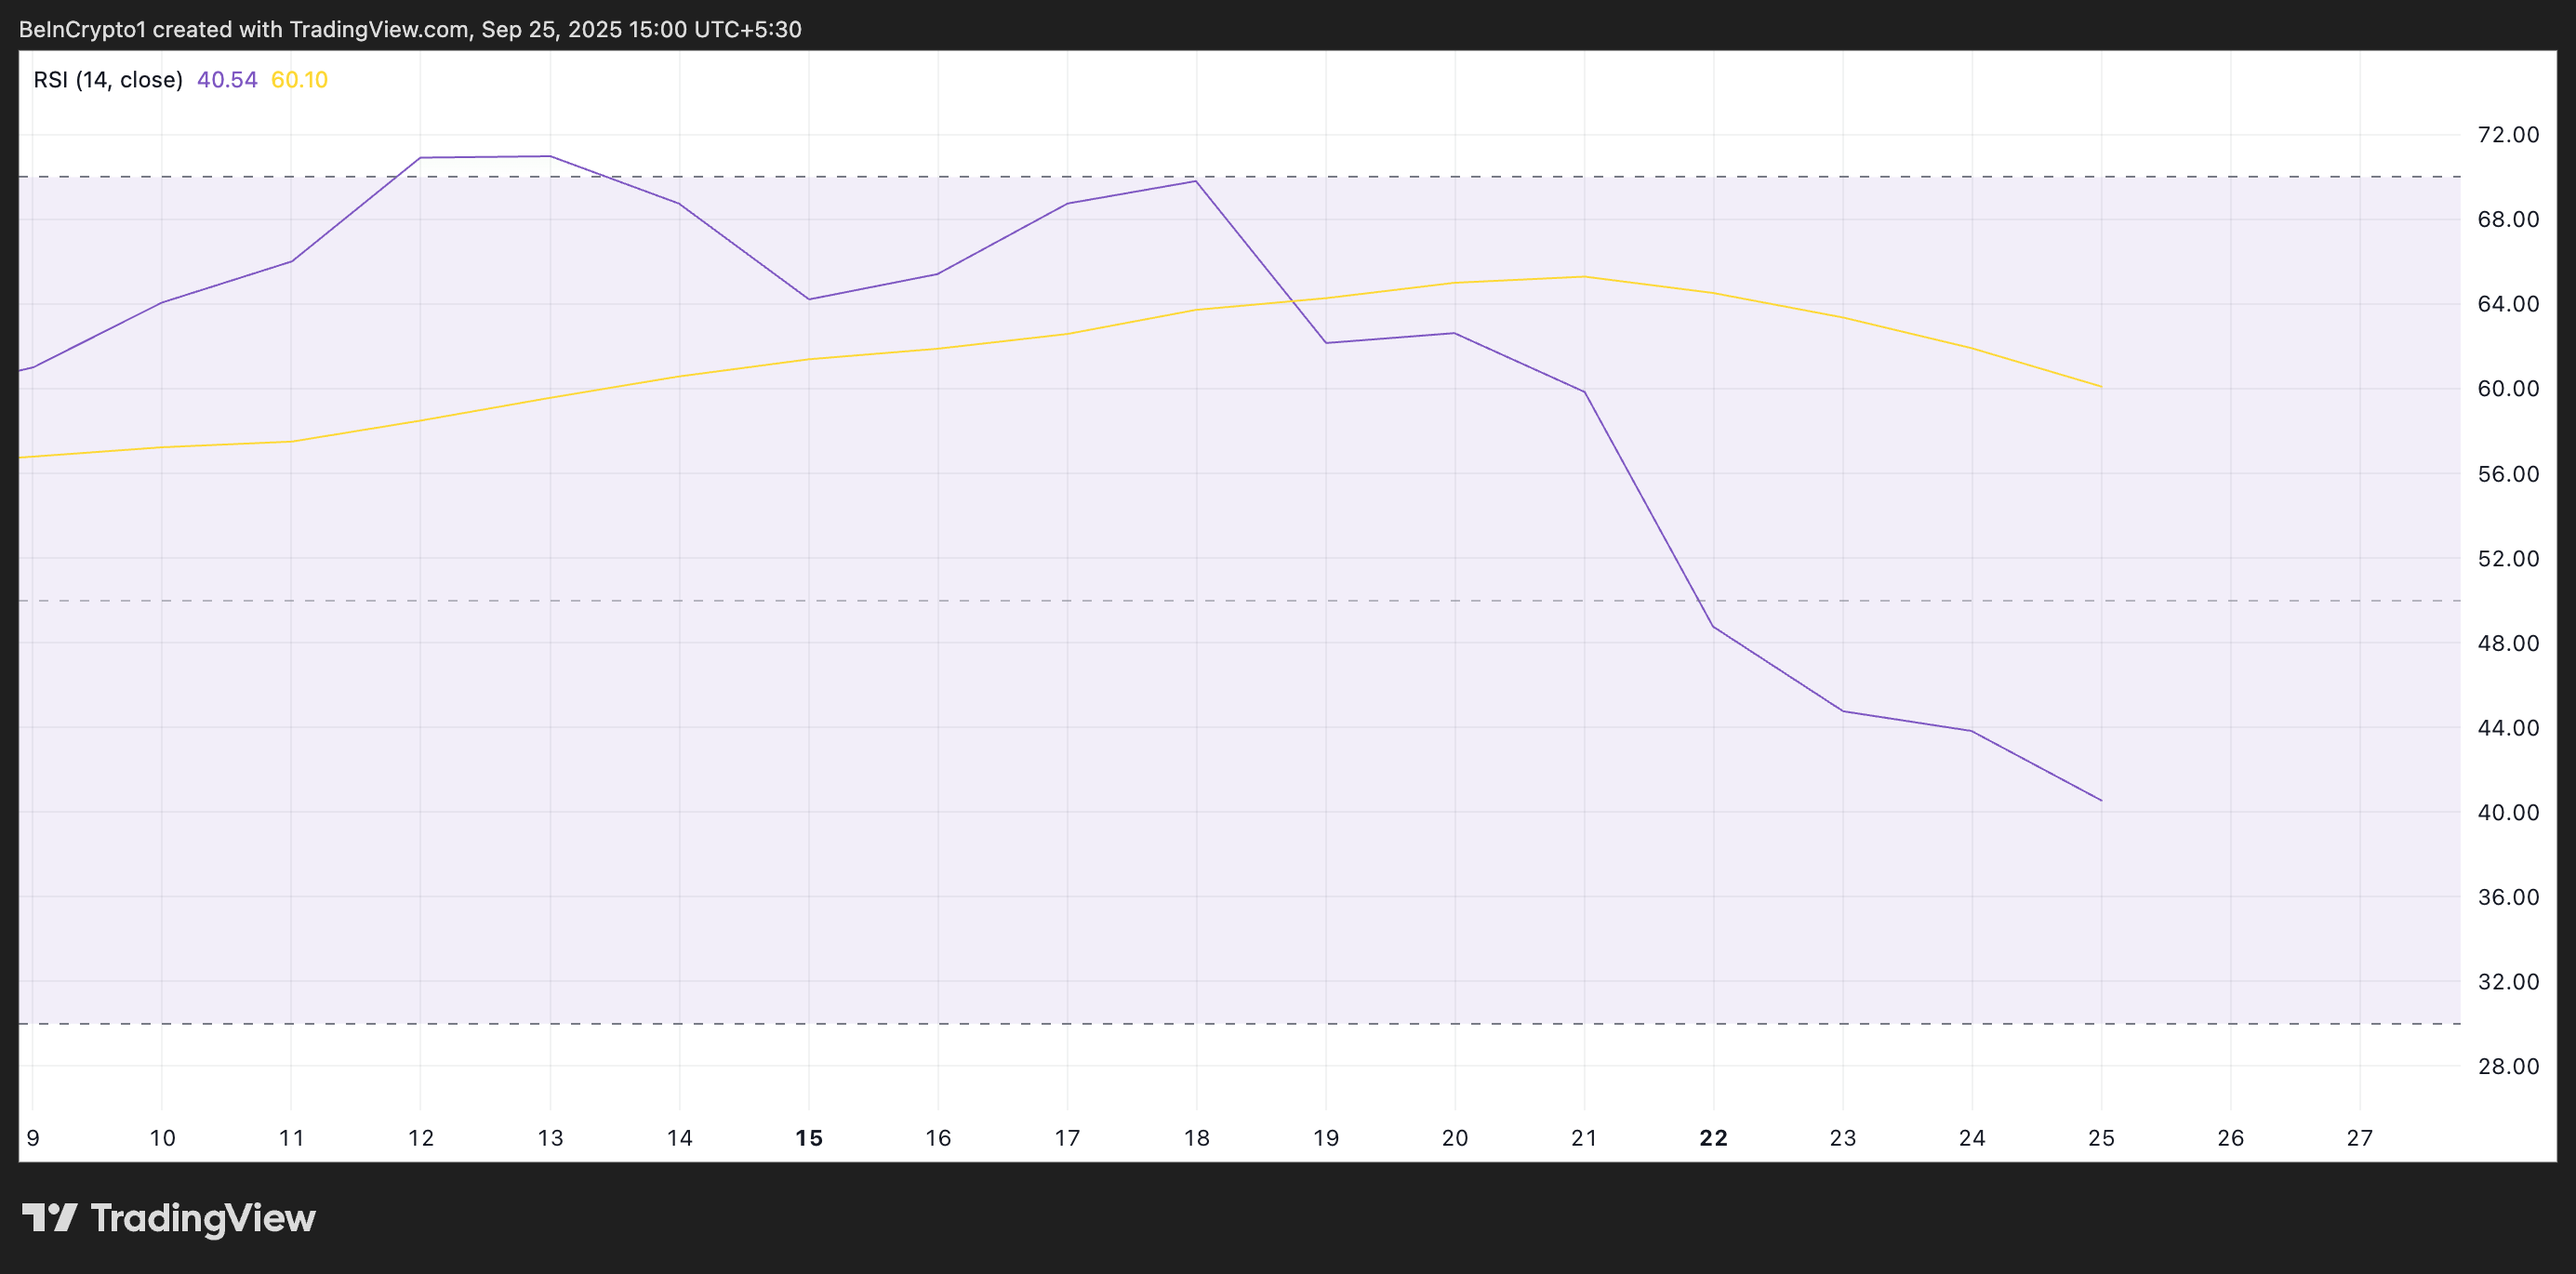
The RSI measures an asset’s overbought and oversold conditions, with readings above 70 suggesting overbought conditions and below 30 indicating oversold conditions.
At 40.54, SOL’s RSI is in bearish territory, indicating that selling pressure is outweighing buying momentum. While a capitulation phase may not be imminent, downward momentum could persist if bearish sentiment continues.
SOL Poised for Red September Close
If the downward trend continues, SOL may close September below its recent highs. In this scenario, its price could fall toward $195.55. If this support fails to hold, the coin’s price could dip further to $171.88.
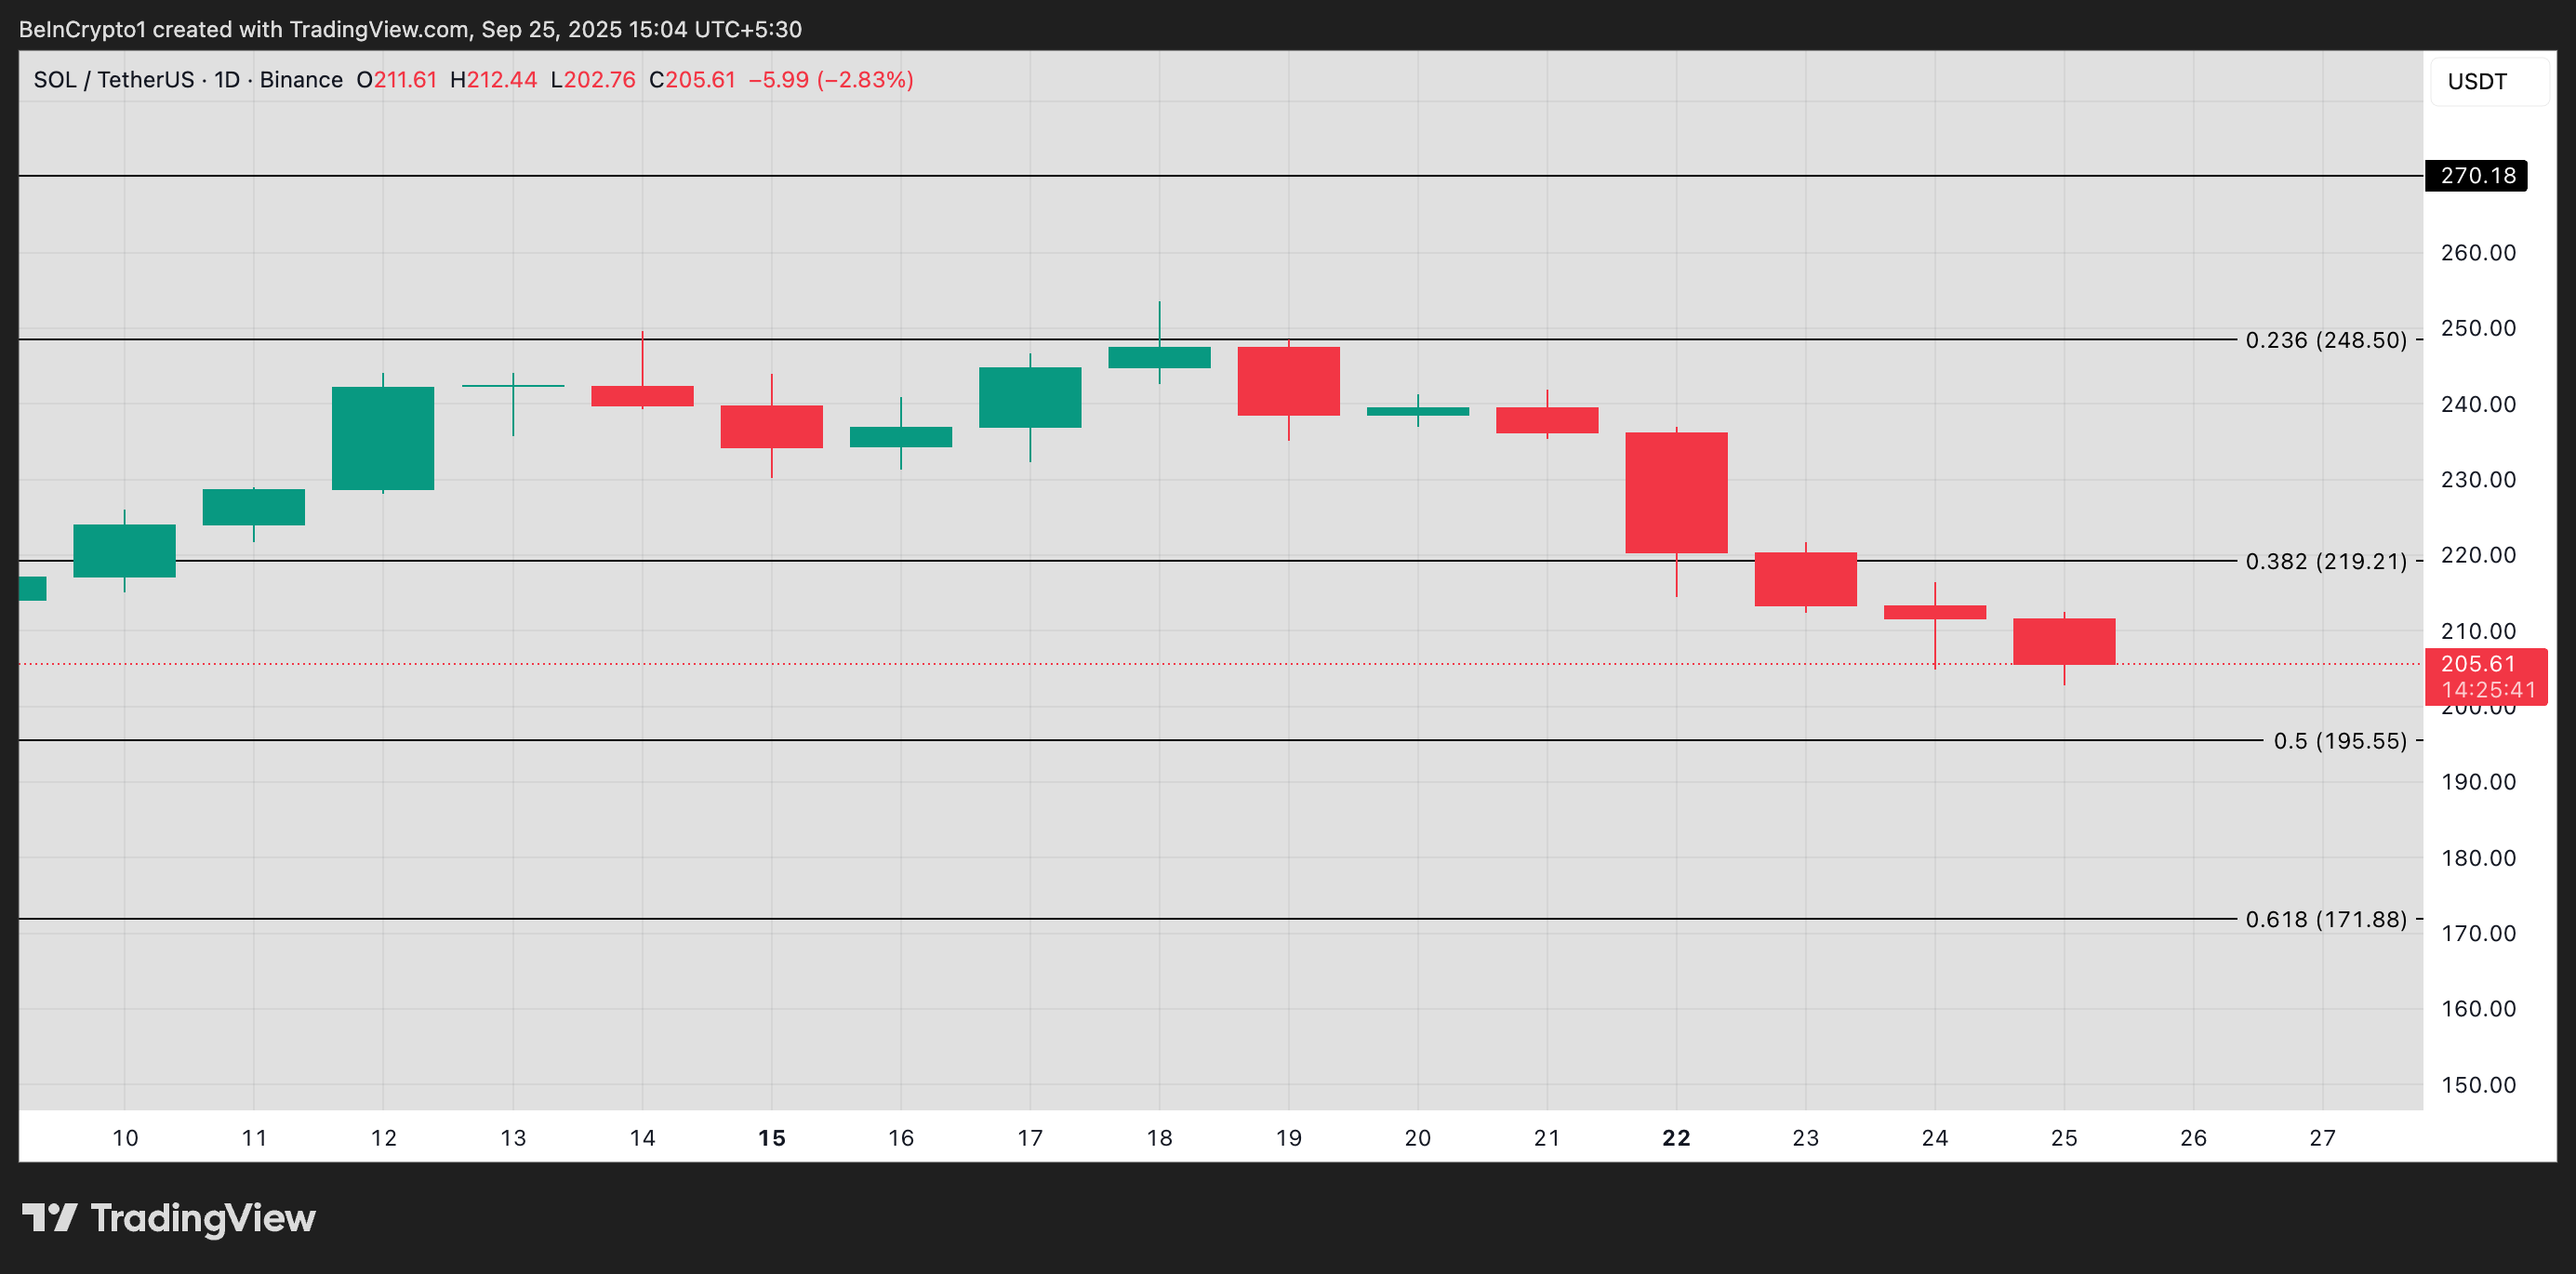
However, a sudden surge in network activity or a reversal in broader market sentiment could mitigate losses and stabilize the price. With such a catalyst, SOL could rally toward $219.21.
