Bitcoin’s $200K Quest: Analyzing the Bullish Signals Against Profit-Taking Pressures

- Bitcoin's Technical Landscape: Bullish Structure Meets Overbought Signals
- Institutional Activity: The New Bull Market Catalyst
- Market Sentiment: The Retail vs. Institutional Divide
- The $200,000 Question: Roadmap or Pipe Dream?
- Frequently Asked Questions
As bitcoin consolidates near all-time highs, the crypto community is buzzing about its potential to reach $200,000 despite significant profit-taking activity. This analysis examines the technical indicators, institutional movements, and market sentiment that could propel BTC to new heights or trigger a correction. With SpaceX making its first Bitcoin move in three years and Square rolling out merchant payment solutions, fundamental support appears strong - but can technicals confirm the bullish case?
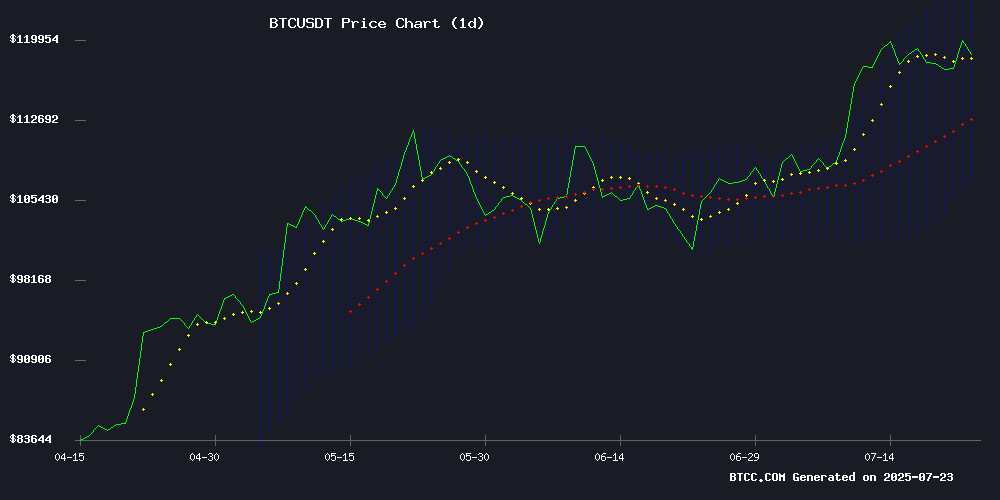
Bitcoin's Technical Landscape: Bullish Structure Meets Overbought Signals
Bitcoin currently trades comfortably above key moving averages, with the price at $119,000 sitting well above the 20-day MA ($115,418). The Bollinger Bands show expansion, indicating increased volatility, while the MACD presents a mixed picture - the bearish crossover (-629.98) is being challenged by narrowing gaps between lines.
Source: BTCC trading platform
According to TradingView data, Bitcoin faces immediate resistance at $124,132 (upper Bollinger Band) with strong support at $115,418 (middle band). The 100-hour Simple Moving Average has held as dynamic support during recent pullbacks, suggesting institutional buyers are accumulating at these levels.
Institutional Activity: The New Bull Market Catalyst
Corporate treasury movements are creating fundamental support unseen in previous cycles:
| Institution | Activity | Amount |
|---|---|---|
| SpaceX | First BTC move in 3 years | 1,300 BTC ($153M) |
| Square | Merchant payment rollout | 4M merchants |
| Twenty-One Capital | IPO announcement | Backed by Tether/SoftBank |
The BTCC research team notes: "We're seeing traditional finance adoption patterns that validate Bitcoin's store-of-value proposition. Unlike 2021's retail frenzy, this rally has institutional fingerprints all over it."
Market Sentiment: The Retail vs. Institutional Divide
On-chain data reveals a fascinating divergence:
- Retail investors are taking profits (Spent Output Profit Ratio at 2.5)
- Whale wallets continue accumulating (UTXO count declining)
- Exchange reserves increasing but remain below previous cycle peaks
This creates what analysts call a "passing of the baton" moment, where early investors cash out while institutions and long-term holders absorb the supply. The critical question becomes whether institutional demand can outpace retail selling pressure.
The $200,000 Question: Roadmap or Pipe Dream?
Breaking down the bullish and bearish cases for Bitcoin's path to $200K:
| Factor | Bull Case | Bear Case |
|---|---|---|
| Technical | Break above $124K could trigger Fibonacci extension to $198K | MACD failure might lead to $100K retest |
| Fundamental | Corporate adoption accelerating (SpaceX, Square effects) | Altseason rotation draining BTC liquidity |
| Sentiment | Institutional products attracting $50B YTD inflows | Profit-taking at ATHs creates overhead supply |
Michael from the BTCC analysis team suggests: "The $180K year-end target appears achievable first, with $200K possible if corporate adoption becomes a trend rather than an outlier. Watch the $120K-$124K range - a weekly close above could confirm the next leg up."
Frequently Asked Questions
What's driving Bitcoin's current price action?
The current rally combines technical breakout momentum with fundamental institutional adoption. Corporations like SpaceX moving Bitcoin after years of dormancy signals growing mainstream acceptance, while technical indicators show strong support levels holding despite profit-taking.
How does this bull market differ from 2021?
Unlike 2021's retail-driven frenzy, this cycle features measured institutional accumulation. The derivatives market is more mature, with open interest at $45.4 billion showing sophisticated participation. Corporate treasury strategies (like MicroStrategy's) have created a new demand source.
What are the key levels to watch?
Critical support sits at $115,418 (20-day MA and Bollinger mid-band), while resistance clusters at $124,132 (upper Bollinger) and $129,000. A decisive break above $124K could open the path to $150K, while losing $115K might trigger a deeper correction to $100K.
Is now a good time to buy Bitcoin?
This article does not constitute investment advice. That said, the market shows characteristics of mid-cycle consolidation rather than a top. Dollar-cost averaging remains a prudent strategy for long-term investors, while traders might wait for confirmation above $124K or a pullback to support.
How reliable are the $200K price predictions?
While technical extensions suggest $198K is plausible if certain conditions are met, price targets should always be taken with caution. The $180K year-end consensus among analysts appears more grounded in current fundamentals. As always in crypto, expect volatility en route to any targets.
