Jupiter Primed for 35% Surge – Will Shattering $0.43 Spark a Crypto Frenzy?

Crypto's latest dark horse is charging. Jupiter's chart patterns scream bullish as it eyes a 35% rally—if it can smash through the $0.43 resistance wall.
The Make-or-Break Moment
Traders are glued to the $0.43 level like Wall Street bankers to their third espresso. A clean break could trigger algorithmic buy orders and FOMO inflows. Fail, and we're back to range-bound purgatory.
Liquidity Hunt
Market depth shows thin sell orders above $0.43—classic 'liquidity vacuum' setup. If Jupiter taps that zone, the move could accelerate faster than a VC dumping tokens on retail.
The Cynic's Corner
Of course, this assumes crypto markets still follow technicals—not just Elon Musk's latest tweet or a meme about 'quantum resistance.' Place your bets accordingly.
Why is Jupiter’s price rising?
Experts and analysts believe that the primary reason behind this continued upside momentum is JUP’s DEX trading volume.
On the 22nd of June, the Jupiter DEX shared a report revealing that its trading volume had surpassed $1 trillion, with 1.7 billion transactions.
This highlights Jupiter’s strong market presence within the DeFi ecosystem, which not only helped the platform reach the $1 trillion milestone but also led to a significant surge in revenue.
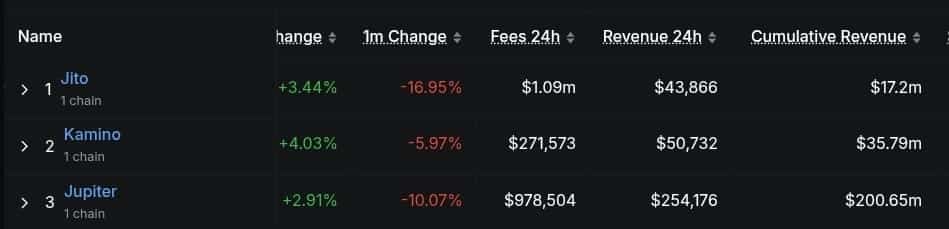
At press time, data from DeFiLlama showed that Jupiter DEX generated $254,176 in protocol revenue over the past 24 hours, bringing its cumulative revenue to an impressive $200.65 million.
Source: DeFiLlama
Price action and key technical levels
According to expert technical analysis, JUP appeared bullish and is on the verge of a significant upside move.
The daily chart revealed that the asset had recently broken out of a descending trendline, forming a bullish inverted head and shoulders pattern, which appeared on the verge of a breakout.
Based on recent price action and historical patterns, if the ongoing upside momentum continues and JUP breaks out above the neckline at the $0.43 level, there is a strong possibility that the price could soar by 35%.
Thus, price could reach the $0.55–$0.59 range in the near future.

Source: TradingView
This bullish outlook was further strengthened by the MACD, which crossed above the signal line following the recent rally.
Additionally, the MACD histogram bars have turned green and appeared to be growing in size, signaling a surge in bullish momentum and suggesting the potential for further upside in the coming days.
Traders’ eyes on the long positions
Given the current market sentiment, traders appeared to have a bullish outlook, as they were strongly betting on the upside, according to on-chain analytics firm CoinGlass.

Source: CoinGlass
Data shows that traders are over-leveraged at $0.391 on the lower side and $0.446 on the upper side.
At these levels, they have built $2.17 million worth of long positions and $612K worth of short positions, suggesting that the bulls are back and currently dominating the asset.
Subscribe to our must read daily newsletter
