Ethereum Bulls Spot Three Key Signals in ETH’s Liquidation Wall

Ethereum’s price action just flashed three unmistakable buy signals—buried in its liquidation data. Here’s what the charts won’t tell you.
Liquidation walls usually spell danger, but ETH’s current setup screams opportunity. Massive sell orders clustered at key levels? That’s not resistance—it’s a bear trap waiting to snap.
First signal: The ’wall’ isn’t as thick as it looks. Second: Whale accumulation patterns suggest smart money’s positioning for a breakout. Third: Funding rates haven’t spiked—retail’s still asleep at the wheel.
Wall Street analysts would call this ’risk management.’ Crypto traders call it free money. Either way, the math doesn’t lie—even if the suits still don’t get it.
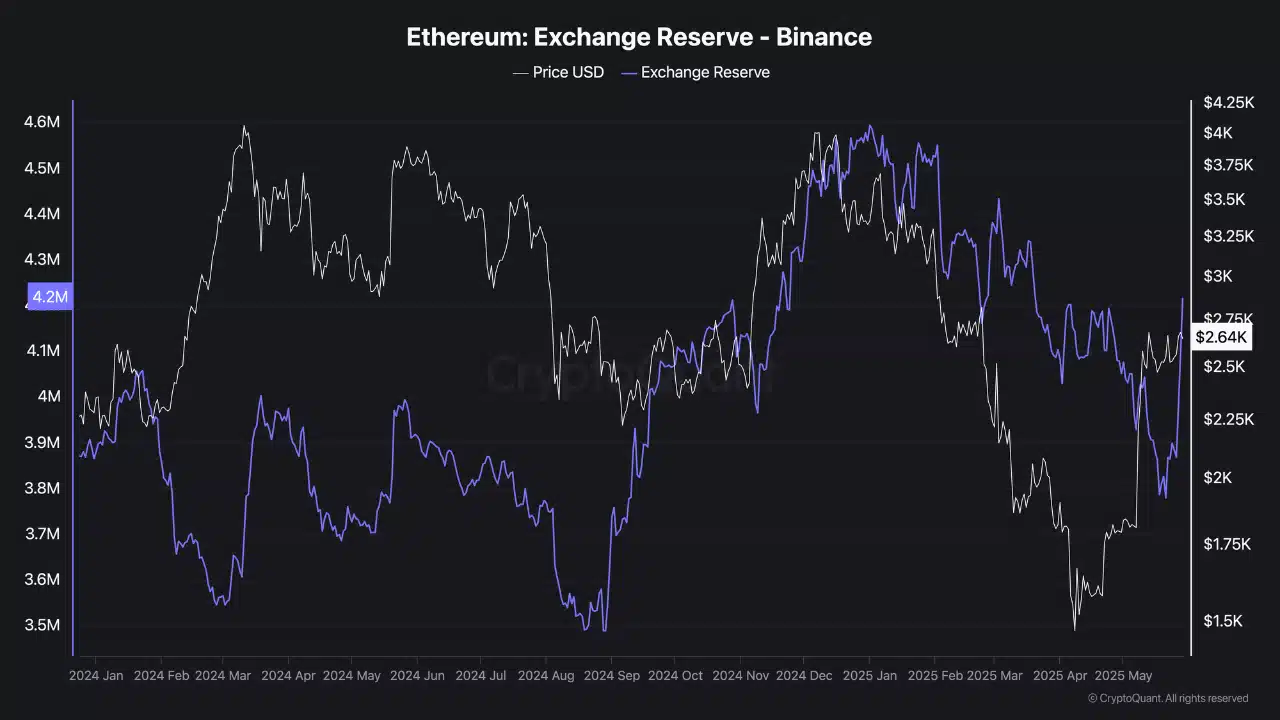
Source: CryptoQuant
Why do negative netflows persist despite sideways price action?
Ethereum’s Netflows remained firmly negative, with -248.83K ETH recorded over the last seven days and -60.9K ETH over 30 days.
While this typically suggests accumulation or investor withdrawal to cold storage, the flat price action implies these withdrawals follow heavy prior sell activity.
The 24-hour Netflow also showed a smaller decline of -4K ETH, reinforcing that capital outflows are steady, not accelerating.
Therefore, although the price holds above $2,600, this trend exposes underlying hesitation. Without renewed inflows or buyer confidence, the price may fail to sustain current levels.

Source: IntoTheBlock
Trader caution and liquidation barriers weigh heavily
Over the past 24 hours, Open Interest dropped sharply by 8.99% to $18.14 billion, as traders backed away from both sides of the market.
Lower OI typically signals a lack of conviction, and without aggressive positioning, volatility tends to compress before a breakout or breakdown.
However, what’s more concerning is Binance’s ETH/USDT Liquidation Heatmap, which shows dense liquidation walls stacked between $2,700 and $2,830.
These clusters have repeatedly triggered selling pressure, creating resistance zones that absorb bullish momentum. Each failed attempt to breach this region has led to sharp reversals, as seen on the 24-hour chart.

Source: CoinGlass
Unless ETH surges with substantial volume to clear these barriers, bulls may remain trapped below them. These liquidation zones act as a ceiling until market conviction shifts strongly in favor of buyers.
Ethereum’s sideways movement conceals deeper market weakness.
Declining OI, negative Netflows, and strong liquidation zones suggest that sell pressure is capping gains.
If bulls cannot reclaim $2,700 convincingly, the $2,480 support could come under pressure next. For now, caution remains warranted as ETH navigates a tight range with limited momentum.
Subscribe to our must read daily newsletter

Log in to Reply
Log in to comment your thoughtsComments
Related Articles
|Square
Get the BTCC app to start your crypto journey
Get started today Scan to join our 100M+ users