TRX Surges 10% as Tron Network Activity Explodes—8.4M Transactions Signal Bullish Momentum

Tron’s blockchain just hit hyperdrive—daily transactions doubled to 8.4 million, fueling TRX’s double-digit price surge. Here’s why traders are scrambling.
Network effect or hype cycle? The 10% rally smells like a classic crypto feedback loop—more users attract more speculation, which attracts... well, more users. Even Wall Street’s algo-traders would blush at this self-fulfilling prophecy.
Meanwhile, Bitcoin maximalists grumble into their proof-of-work forks. Sometimes adoption speaks louder than ideology.
What will drive growth?
A recent report from CryptoQuant shows that TRX is well-positioned to extend its gains based on transaction activity.
The 30-day moving average for Daily Transactions has nearly doubled, rising from 4.3 million to 8.4 million.
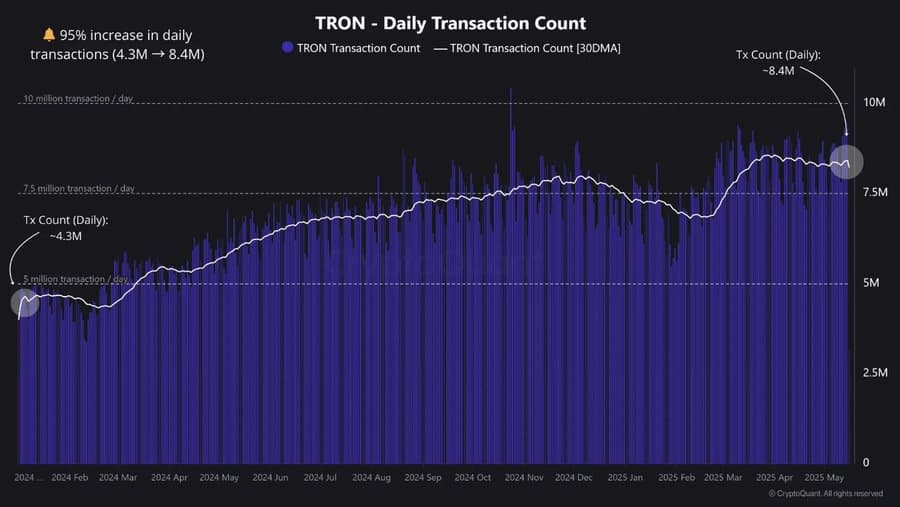
Source: CryptoQuant
This suggests growing adoption of the chain and, by extension, increased usage of TRX. However, this doesn’t clearly guarantee a MOVE to the upside.
To determine whether this activity will affect TRX, AMBCrypto analyzed user behavior across different protocols.
High liquidity inflow and retention
AMBCrypto examined the Total Value Locked (TVL), which measures the valuation of protocols on TRX by how much of the asset users have deposited.
Findings show that the TVL surged notably over the past 22 days since the 1st of May. During this period, the locked value ROSE from $5.19 billion to $6.824 billion.

Source: DeFiLlama
This implies that $1.634 billion worth of TRX has been added to these protocols and locked, signaling a long-term commitment.
At the same time, Stablecoin Supply on TRON hit a record high of $76.189 billion, per Artemis data.
This demand and usage of tron and its stablecoins can be directly linked to the blockchain’s fast transactions and low fees.
Together, these inflows show sticky capital rather than fleeting speculation.
What will be the effect on TRX?
A current look at TRX’s 4-hour chart shows the asset trading within a classic bullish pattern known as a symmetrical triangle.
A rally WOULD be confirmed once the asset breaches the upper resistance line of the pattern, a level it is currently testing.

Source: TradingView
Ideally, the rally should extend to $0.2801, the peak of the pattern, but new insights suggest further upside.
According to the Global In and Out of the Money (GIOM) metric, there’s no significant resistance ahead of TRX on the chart until the $0.30 region.

Source: IntoTheBlock
At that level, TRX is likely to face notable supply pressure, with 8.54 billion TRX—worth around $2.3 billion—potentially being sold. This downward pressure could slow price movement.
For now, TRX still holds a projection of a 10.11% increase, trading toward a new high of $0.30, a level last reached on the 9th of December.
Subscribe to our must read daily newsletter
