Ethereum’s Exchange Supply Hits 10-Year Low—Here’s Why It Matters

ETH’s liquidity crunch just hit a historic milestone—traders are hoarding instead of flipping. The last time reserves were this thin, gas cost pennies and DeFi was a glint in Vitalik’s eye.
Where did all the ETH go? Three culprits: staking locks it up, L2s siphon it off, and whales are playing the long game. Meanwhile, CEXs scrape the barrel like hedge funds at happy hour.
This isn’t just scarcity theater. Thin exchange supply turbocharges price swings—up or down. Next week’s ETF decision could turn this tinderbox into a rocket or a dumpster fire.
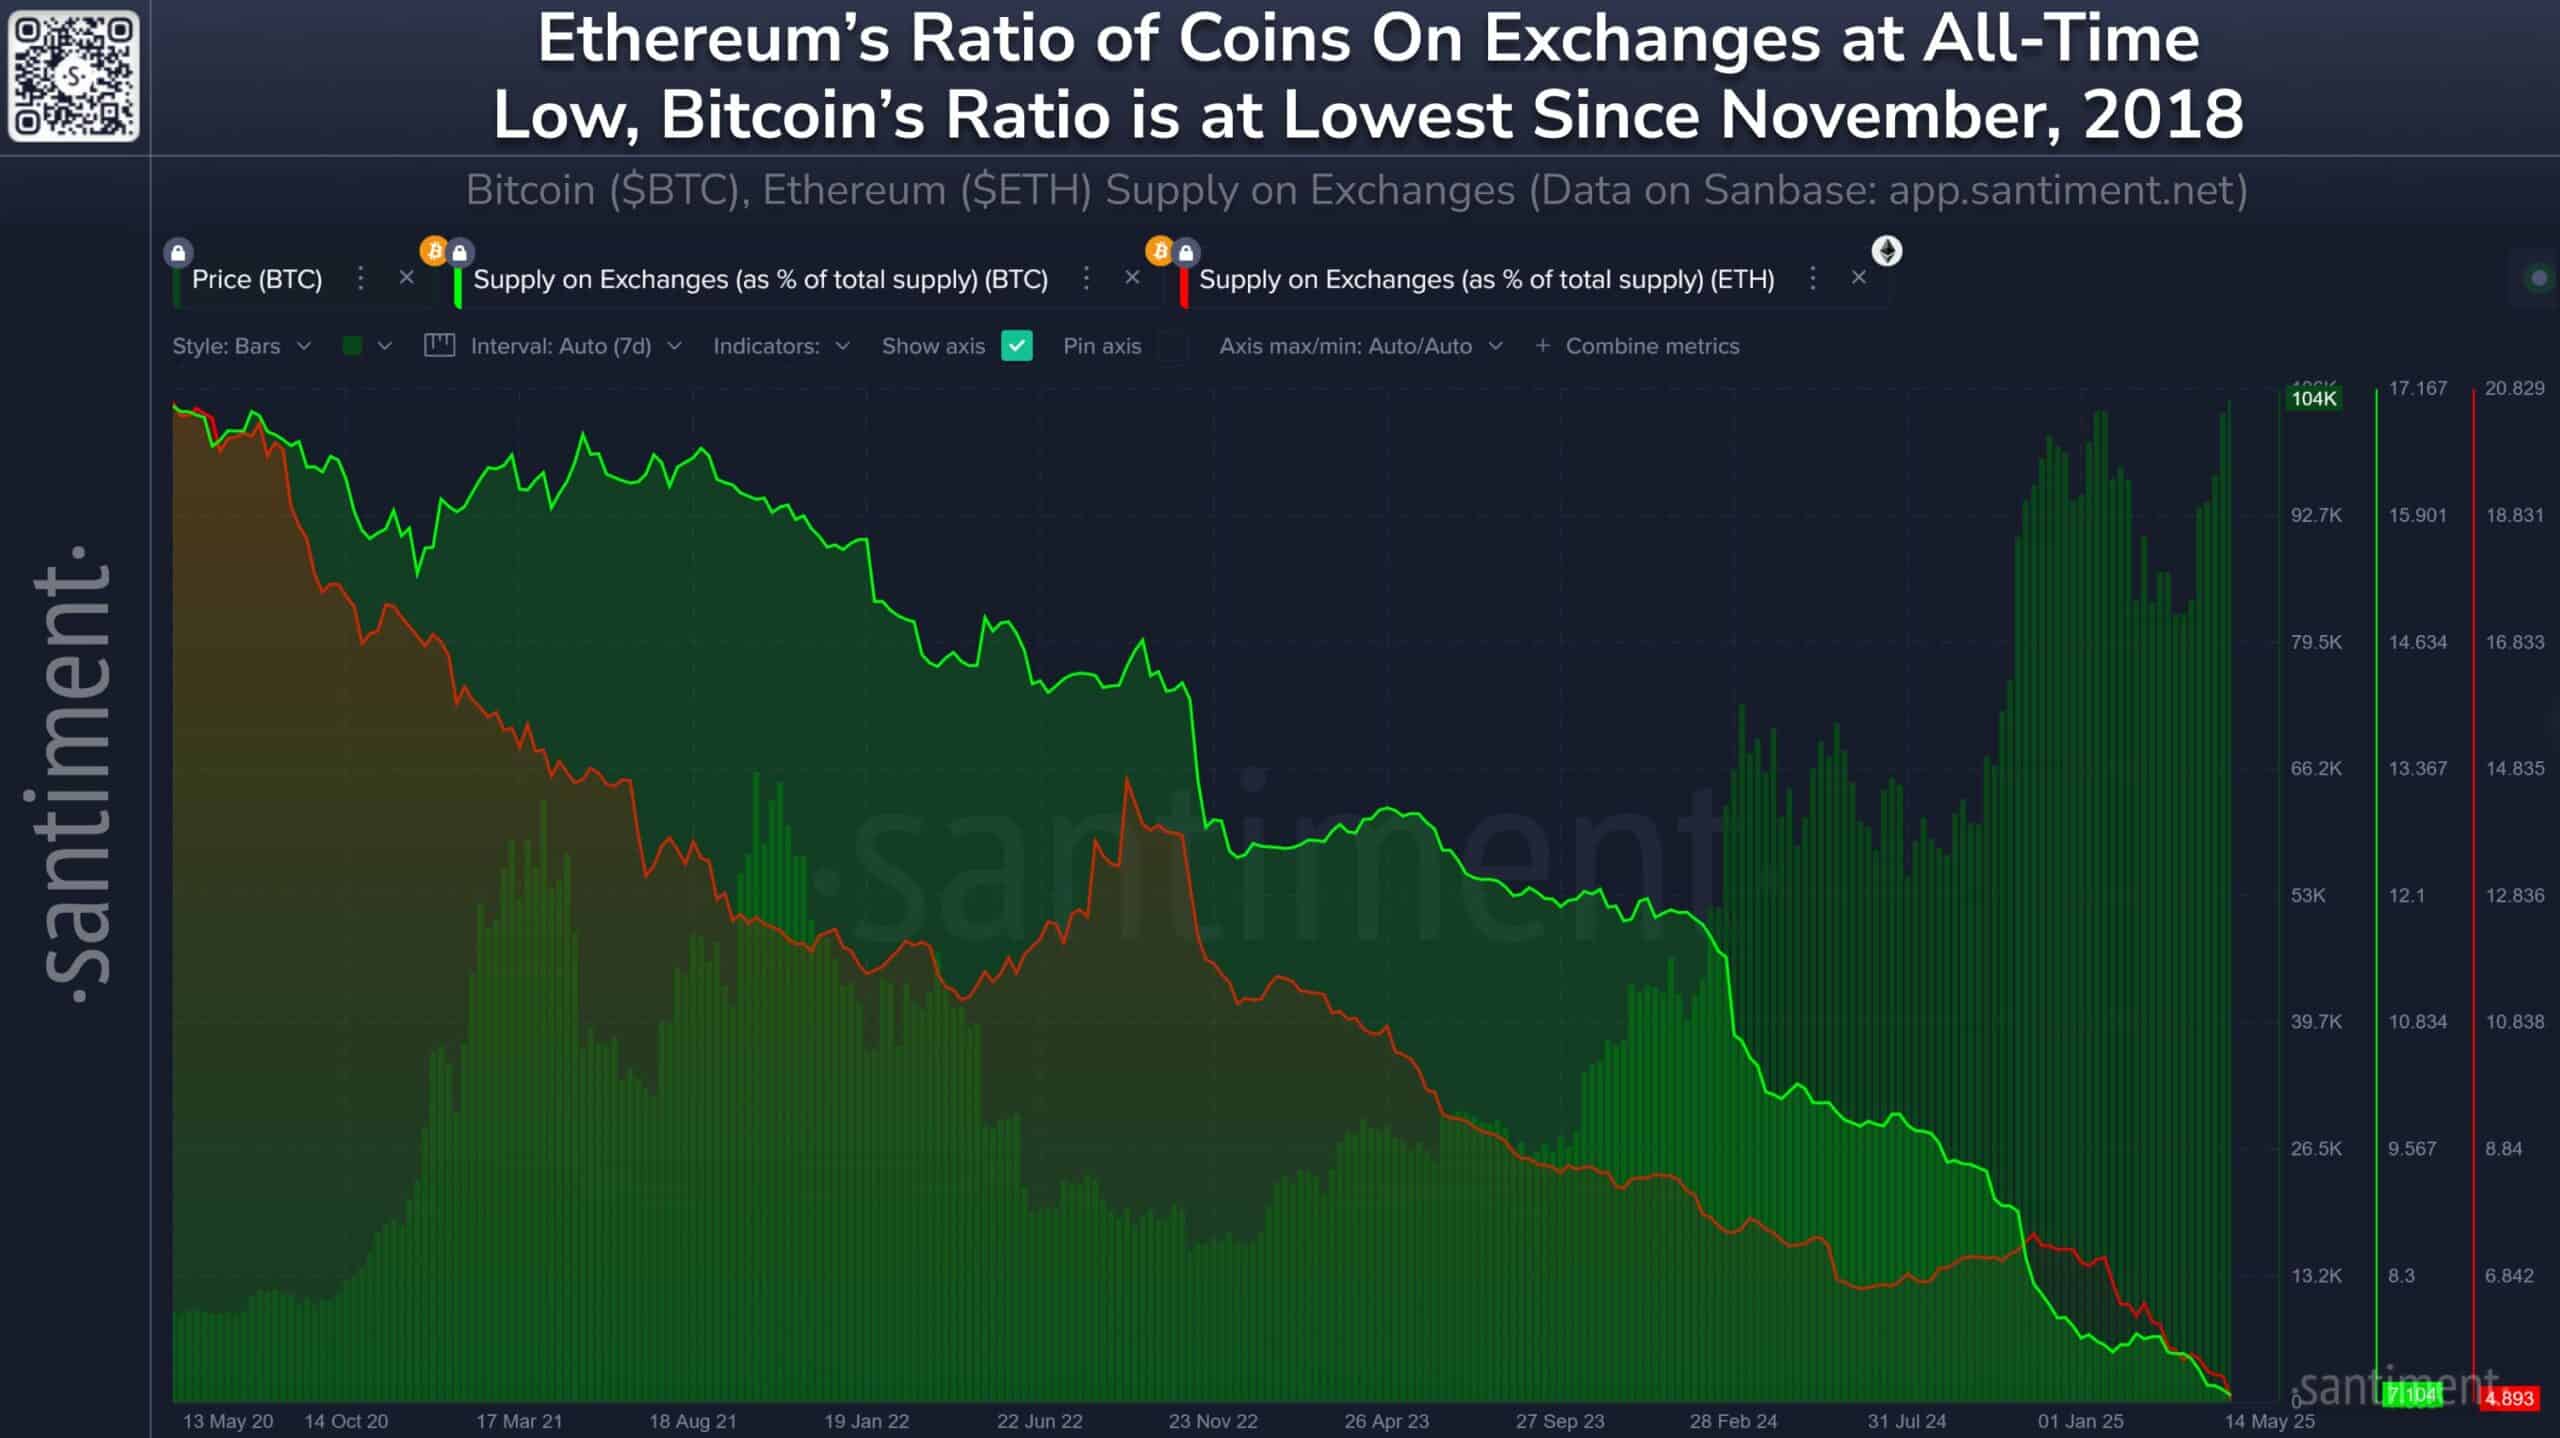
Source: Santiment
ETH’s user activity and whale transactions ignite fresh network momentum
Ethereum’s network activity has picked up notably, as shown by a 6.09% weekly increase in active addresses.
New addresses have also surged by 28.43% in the same period, signaling a growing number of participants joining the network. This spike often reflects a rise in retail user interest or the onboarding of fresh capital.
Historically, an increase in both active and new addresses tends to precede price expansions, particularly when combined with reduced exchange balances.

Source: IntoTheBlock
Ethereum’s transaction volume has expanded significantly across all tiers, with the most notable growth seen in larger transfers. Transactions in the $1 million–$10 million range have surged by 204.68%, while those exceeding $10M jumped 240.63%.
This whale activity typically reflects institutional or high-net-worth investor interest. Simultaneously, even lower-tier brackets like $1–$10 and $100–$1K recorded growth over 40% and 33%, respectively.
Ethereum: These metrics reinforce bullish conviction
Alongside rising transaction volume and active users, Ethereum’s OI has grown by 11.31%, reaching 16.59 billion.
This metric tracks the total value of open long and short positions across exchanges, and a consistent rise suggests growing speculative involvement.
Notably, this increase aligns with Ethereum’s recent price rebound and strong on-chain fundamentals. However, rising OI also indicates higher volatility ahead, especially if the price nears resistance levels.

Source: CryptoQuant
Ethereum’s MVRV ratio has climbed back to 27.19% after spending several weeks in negative territory.
This metric compares the market value to the realized value of held ETH and helps determine whether holders are in profit. A moderately positive MVRV often suggests a healthy market with minimal risk of mass profit-taking.
Technical analysis shows a descending channel breakout attempt
Ethereum recently attempted a breakout from its descending channel pattern, bouncing off the $2,314 support level.
The price now faces resistance at $2,571 and $2,622, corresponding to the 0.5 and 0.618 Fib retracement levels. A breakout above these zones could pave the way for a rally toward $2,747.52 and possibly the 1.618 extension at $2,991.88.
Additionally, at press time, the Stochastic RSI was hovering above 70, indicating bullish momentum but also nearing overbought conditions.
Therefore, Ethereum is at a pivotal point where further bullish confirmation could unlock significant upside.

Source: TradingView
Ethereum currently exhibits strong fundamentals supported by long-term accumulation, growing user activity, surging whale transactions, and rising OI.
The MVRV ratio’s recovery signals minimal sell pressure, while the technical setup suggests a potential breakout. If momentum continues, Ethereum could clear key resistances and advance toward the $2,750–$3,000 zone.
Therefore, current conditions favor a bullish continuation, provided volume and sentiment remain aligned.
Subscribe to our must read daily newsletter

Log in to Reply
Log in to comment your thoughtsComments
Related Articles
|Square
Get the BTCC app to start your crypto journey
Get started today Scan to join our 100M+ users