Bitcoin’s Make-or-Break Moment: Key Indicator Flashes Bullish—Again

That familiar green light just blinked back on. Bitcoin’s most reliable price predictor—the Pi Cycle Top indicator—just triggered its buy signal for the first time since the 2024 halving. Cue the institutional FOMO.
History says this could get wild. The last two times this happened? 300% and 600% rallies followed. But Wall Street’s ’risk managers’ will pretend they saw it coming—right after they finish shorting it.
One problem: macro headwinds. Fed rate cuts got delayed (again), and Tether’s printing press just jammed. Either BTC smashes through $100K by July, or we’re stuck range-bound until the suits ’discover’ the next narrative.
A surge in market confidence?
According to a recent CryptoQuant report, the Taker Buy/Sell Ratio has broken decisively above the 1.00 mark, hitting 1.02 – a level historically linked to breakout moments in Bitcoin’s price action.

Source: Cryptoquant
Similar spikes were recorded NEAR the $15K-$20K accumulation zone in late 2022 and just before the $30K breakout in October 2023.
With BTC now hovering near all-time highs, the return of aggressive buying shows growing conviction — but it also raises the stakes, as this threshold has previously preceded both rallies and sharp reversals.
Mega holders have paused
While overall accumulation trends remain bullish, a closer look reveals a subtle shift in behavior.
According to Glassnode, ultra-large whales holding over 10,000 BTC have cooled their buying activity, returning to a neutral accumulation score around 0.5.
In contrast, mid-sized cohorts — wallets holding between 1,000 and 10,000 BTC — remain active buyers, with scores near 0.9.
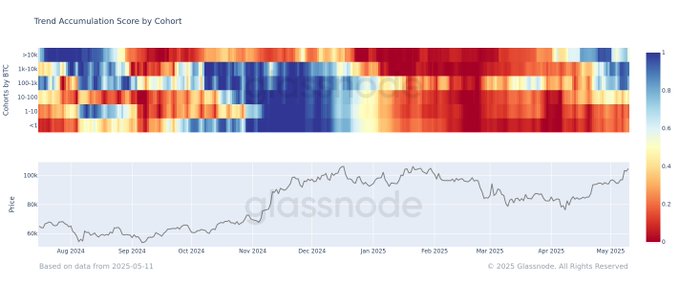
Source: Glassnode
Even smaller, institutional-sized wallets show continued strength. Retail, however, continues to distribute.
While bullish momentum persists, the rally is increasingly being driven by mid-tier whales rather than the deepest pockets.
Bitcoin shows signs of exhaustion
BTC traded just above $103,800 at press time after multiple failed attempts to clear $105K. While daily candles show consolidation, indicators suggested mixed signals.The RSI at 70.68 confirmed overbought conditions, often a precursor to local tops or minor corrections.
Also, the MACD remained bullish, with the MACD line above the signal line. However, momentum was flattening — reflecting cooling buying pressure.

Source: TradingView
Price remains range-bound despite earlier surges, hinting at potential exhaustion.
If BTC fails to break convincingly above $105K, a short-term pullback to $100K or lower support zones remains in play before any sustained breakout attempt.
Take a Survey: Chance to Win $500 USDT
