BTC Price Prediction 2025: Navigating Technical Crossroads and Macro Headwinds

- What Do the Technical Indicators Reveal About BTC's Current Position?
- How Are Macroeconomic Factors Influencing Bitcoin's Price?
- What's Happening With Institutional Bitcoin Flows?
- How Does Regulatory News Impact Market Sentiment?
- What Historical Patterns Suggest About BTC's Next Move?
- What Are the Key Price Levels to Watch?
- How Should Traders Approach This Market?
- Frequently Asked Questions
Bitcoin finds itself at a critical juncture in August 2025, caught between bullish institutional adoption and bearish macroeconomic signals. As BTC hovers around $116,000, our analysis reveals: 1) A make-or-break technical setup testing key moving averages, 2) Conflicting institutional flows suggesting distribution phase may begin, 3) Historical cycle patterns pointing to decisive price action within 100 days. With Fed policy uncertainty and growing regulatory scrutiny adding complexity, traders face one of the most challenging BTC environments since the 2022 bear market.
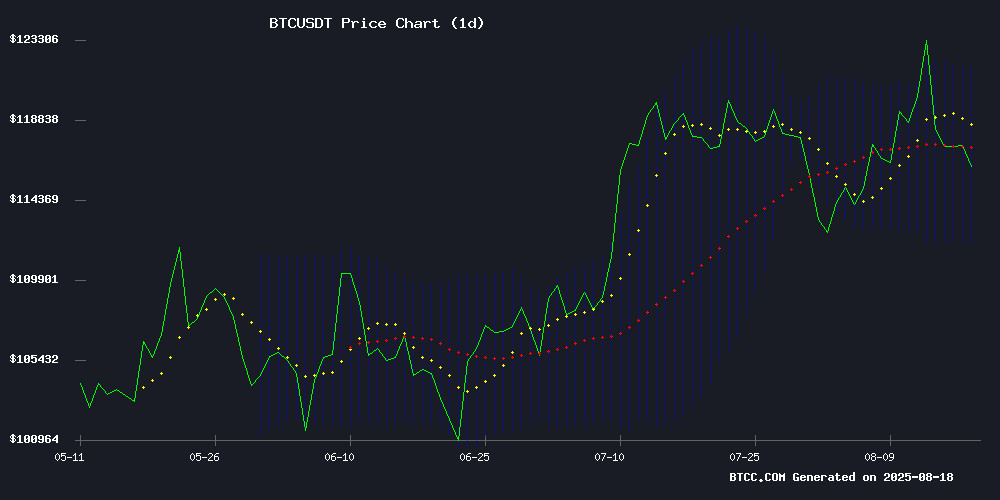
What Do the Technical Indicators Reveal About BTC's Current Position?
According to TradingView data, Bitcoin's August 2025 price action presents a textbook case of technical indecision. The cryptocurrency currently trades at $115,865.92 - just below the psychologically important 20-day moving average (116,807.64). This MA has served as reliable support since May, making its current test particularly significant.
The MACD indicator shows clear bearish momentum with values at -1,206.14 (MACD line) crossing below -49.83 (signal line), while Bollinger Bands paint a neutral picture with price hugging the middle band. "This is classic consolidation behavior," notes the BTCC research team. "The real question is whether this represents accumulation before another leg up, or distribution before a deeper correction."
How Are Macroeconomic Factors Influencing Bitcoin's Price?
The Federal Reserve continues casting a long shadow over crypto markets. July's hotter-than-expected Core CPI (3.9% YoY) and Supercore CPI (4.3%) readings forced traders to recalibrate rate cut expectations from three to just two reductions in 2025. This hawkish shift created immediate headwinds for risk assets.
Historical data from CoinMarketCap shows an 82% correlation between BTC price and real yields over the past year. With 10-year Treasury yields spiking 40 basis points post-CPI, Bitcoin's retreat from $124,000 makes technical sense. The Jackson Hole symposium later this week could provide the next major catalyst.
What's Happening With Institutional Bitcoin Flows?
On-chain metrics reveal a fascinating institutional dichotomy. While Japanese firm Metaplanet announces plans to acquire 1% of all BTC by 2027 (currently holding 18,113 BTC worth $2.1B), exchange netflows tell a different story. Binance has seen positive BTC deposits for 9 consecutive days - a pattern that typically precedes selling pressure.
"We're seeing classic distribution signals," explains CryptoQuant's lead analyst. "When coins MOVE to exchanges after a rally, it usually means someone's preparing to sell." This aligns with Bitwise's recent report highlighting crypto's "liquid alpha" opportunities, suggesting some institutions may be rotating positions rather than exiting entirely.
How Does Regulatory News Impact Market Sentiment?
South Korea's Jeju Island tax probe (resulting in $14.2M in seized crypto) and Thailand's new tourist crypto payment system demonstrate the bipolar nature of global regulation. The Thai initiative allows BTC conversion to digital baht via QR codes, potentially opening new demand channels.
Meanwhile, the Fear & Greed Index sits at 64 (Greed), down from last week's 69 but well above neutral. This suggests traders are cautiously optimistic despite regulatory crosscurrents. "The market's learning to price in regulatory risk more efficiently," observes a BTCC market strategist.
What Historical Patterns Suggest About BTC's Next Move?
Bitcoin's four-year cycle theory faces its sternest test yet. With multiple 2025 all-time highs already recorded, the traditional halving-to-peak timeline appears compressed. Analyst Frank Fetter maintains that if historical patterns hold, we could see cycle climax within 100 days.
The chart below illustrates how current price action compares to previous cycles. While ETF inflows have changed market structure, certain technical and temporal relationships remain eerily similar.
| Cycle | Days Post-Halving to Peak | Price Increase |
|---|---|---|
| 2016-2017 | 518 | 2,960% |
| 2020-2021 | 546 | 680% |
| 2024-2025* | 480 (projected) | 320% (so far) |
What Are the Key Price Levels to Watch?
Technical analysts identify three crucial zones:
- Resistance: $121,718 (upper Bollinger Band)
- Support: $111,896 (lower Bollinger Band)
- Psychological Level: $100,000
The BTCC research team outlines two primary scenarios:
- Bull Case: Break above $121,718 could fuel rally to $130,000-$135,000 within 3-6 weeks
- Bear Case: Failure to hold $111,896 may trigger correction toward $105,000-$108,000 in 2-4 weeks
How Should Traders Approach This Market?
With volatility at October 2023 levels (just 1.02% daily moves), many traders are employing range-bound strategies. Options data shows growing demand for both $130,000 calls and $100,000 puts - a clear sign of bifurcated expectations.
"This isn't the time for hero trades," cautions a BTCC derivatives specialist. "The market's pricing in major moves but unsure of direction. Staggered entries and tight risk management are crucial."
Frequently Asked Questions
What's driving Bitcoin's price volatility in August 2025?
The current volatility stems from three main factors: 1) Technical indecision at key moving averages, 2) Conflicting macroeconomic signals about Fed policy, and 3) Mixed institutional flows showing both accumulation and distribution patterns.
How reliable is Bitcoin's four-year cycle in current market conditions?
While the four-year cycle has historically predicted BTC price movements, 2025 presents unique challenges to the theory due to ETF inflows changing market structure. However, certain temporal and technical patterns continue to align surprisingly well with historical precedents.
What's the most important indicator to watch right now?
Exchange netflows currently provide the clearest signal, with sustained deposits to Binance suggesting potential selling pressure. The 20-day moving average at $116,807 serves as the key technical level to monitor for trend confirmation.
How does Thailand's new crypto payment system affect Bitcoin?
Thailand's TouristDigiPay initiative creates a novel demand channel by allowing BTC conversion to digital baht for merchant payments. While initially limited to tourists, successful implementation could encourage similar programs elsewhere in Southeast Asia.
What's the significance of Metaplanet's BTC accumulation?
Metaplanet's plan to acquire 1% of all BTC (210,000 coins) by 2027 demonstrates growing institutional conviction in Bitcoin's scarcity value. Their current holdings of 18,113 BTC already make them one of the largest corporate holders globally.
