TRX Price Prediction 2025: Can Tron Outperform Ethereum and Reach New Highs?

- What Are the Current Technical Indicators Saying About TRX?
- How Strong Are Tron's Network Fundamentals in 2025?
- What's Driving Tron's USDT Dominance and How Does It Affect Price?
- What Price Levels Could TRX Test in 2025?
- Frequently Asked Questions
Tron (TRX) is showing bullish technical signals as we approach mid-2025, trading above key moving averages while network fundamentals reach record levels. With Tron recently surpassing ethereum in transaction fees and maintaining dominance in stablecoin transfers, analysts are watching for potential price breakouts. This analysis examines TRX's technical setup, network growth metrics, and historical patterns that could influence its price trajectory through 2025.
What Are the Current Technical Indicators Saying About TRX?
As of July 24, 2025, TRX is trading at 0.3045 USDT, slightly above its 20-day moving average of 0.3032 - a potentially bullish signal. The MACD histogram shows minimal negative values (-0.000373), suggesting weakening downward pressure. Bollinger Bands analysis reveals price hovering NEAR the middle band with potential to test the upper band at 0.3270 if momentum continues.
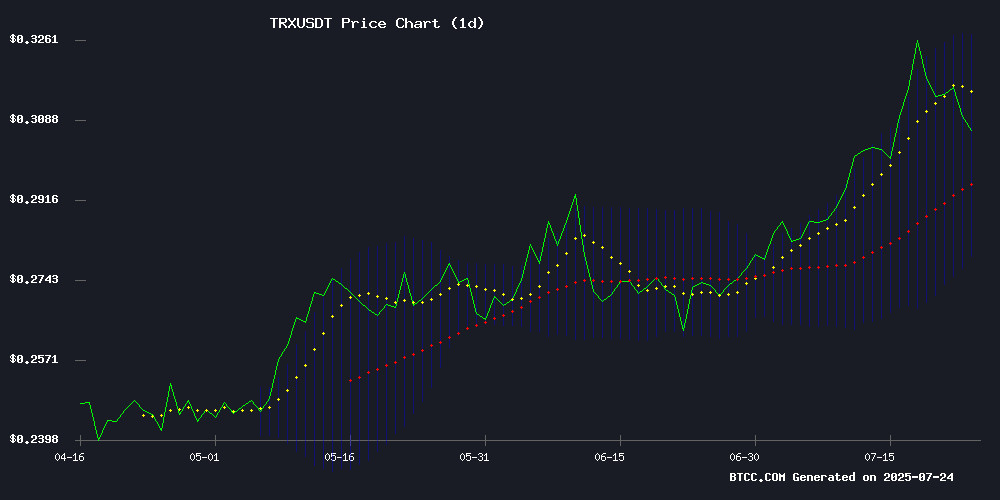
Source: BTCC Trading Platform
"The technical setup shows TRX is building a base for potential upside," notes a BTCC market analyst. "A sustained break above the 20-day MA could trigger movement toward the upper Bollinger Band."
How Strong Are Tron's Network Fundamentals in 2025?
Tron's H1 2025 performance has broken multiple records, with the network recently surpassing Ethereum in monthly average fees ($1.29 vs Ethereum's $1.15). This fee parity with Bitcoin underscores Tron's growing revenue generation capacity and marks a significant evolution from its previous position as a low-cost alternative.
Key network developments include:
- 40% year-to-date surge in stablecoin supply (now 51% of all circulating USDT)
- Successful GreatVoyage-v4.8.0 upgrade implementation
- Gas-free USDT transfer capabilities
- USDD 2.0 stablecoin upgrade
What's Driving Tron's USDT Dominance and How Does It Affect Price?
The Tron-Ethereum USDT rivalry reveals fascinating correlations with Bitcoin's market cycles. Tron's USDT supply ratio surged from 0.3 in 2019 to over 1.0 by 2022-2023, fueled by lower transaction fees. However, recent data shows the ratio declining as bitcoin surpasses $100,000, suggesting investors may prioritize Ethereum's security during bull markets despite higher costs.
| Year | Tron USDT Supply | Bitcoin Price |
|---|---|---|
| 2019 | $60B | $3,200 |
| 2021 | $72B | $64,000 |
| 2025 | $80B | $100,000+ |
What Price Levels Could TRX Test in 2025?
Based on current technicals and network activity, TRX could test several key resistance levels:
| Price Level | Significance |
|---|---|
| 0.3270 | Upper Bollinger Band (immediate target) |
| 0.3500 | Psychological resistance |
| 0.3800 | 2025 yearly high retest |
"The combination of strong on-chain metrics and improving technicals suggests TRX could see 7-15% upside in the near term," says the BTCC analyst. However, they caution that "macro crypto market conditions remain a key variable."
Frequently Asked Questions
What is the current TRX price prediction for 2025?
Based on technical analysis and network fundamentals, TRX could potentially test resistance levels at 0.3270 (upper Bollinger Band), 0.3500 (psychological resistance), and 0.3800 (2025 yearly high) in the coming months. However, these projections depend on maintaining current network growth and favorable market conditions.
Why is Tron surpassing Ethereum in transaction fees significant?
Tron's fee parity with Ethereum (and even Bitcoin) marks a major shift in network dynamics, indicating increased utility and value capture. Historically a low-cost alternative, Tron's ability to command higher fees while maintaining activity suggests growing demand for its blockchain services.
How does USDT distribution affect TRX price?
The movement of USDT between Tron and Ethereum has shown correlation with Bitcoin's market cycles. Tron typically gains USDT market share during bear markets (due to lower fees) while Ethereum regains during bull markets (due to perceived security). These stablecoin flows can indicate broader market sentiment that impacts TRX price.
What are the key technical indicators to watch for TRX?
Traders are watching the 20-day moving average (currently at 0.3032), MACD histogram trends, and Bollinger Band positioning. A sustained break above the 20-day MA with confirmation from other indicators could signal continued upside potential.
