Ethereum Price Grinds to a Halt: Is Geopolitical Turmoil Freezing Crypto Markets?

Ethereum''s momentum hits a wall as global tensions escalate—traders brace for volatility.
Technical indicators flash caution: ETH''s sideways crawl defies bullish expectations.
When rockets fly, charts lie? How macro chaos trumps crypto fundamentals (again).
Bonus jab: Wall Street''s ''risk-off'' mode strikes again—because nothing says ''safe haven'' like algorithmic stablecoins.
Ethereum Price: Does TA Work During Global Instability?
(ETHUSD)
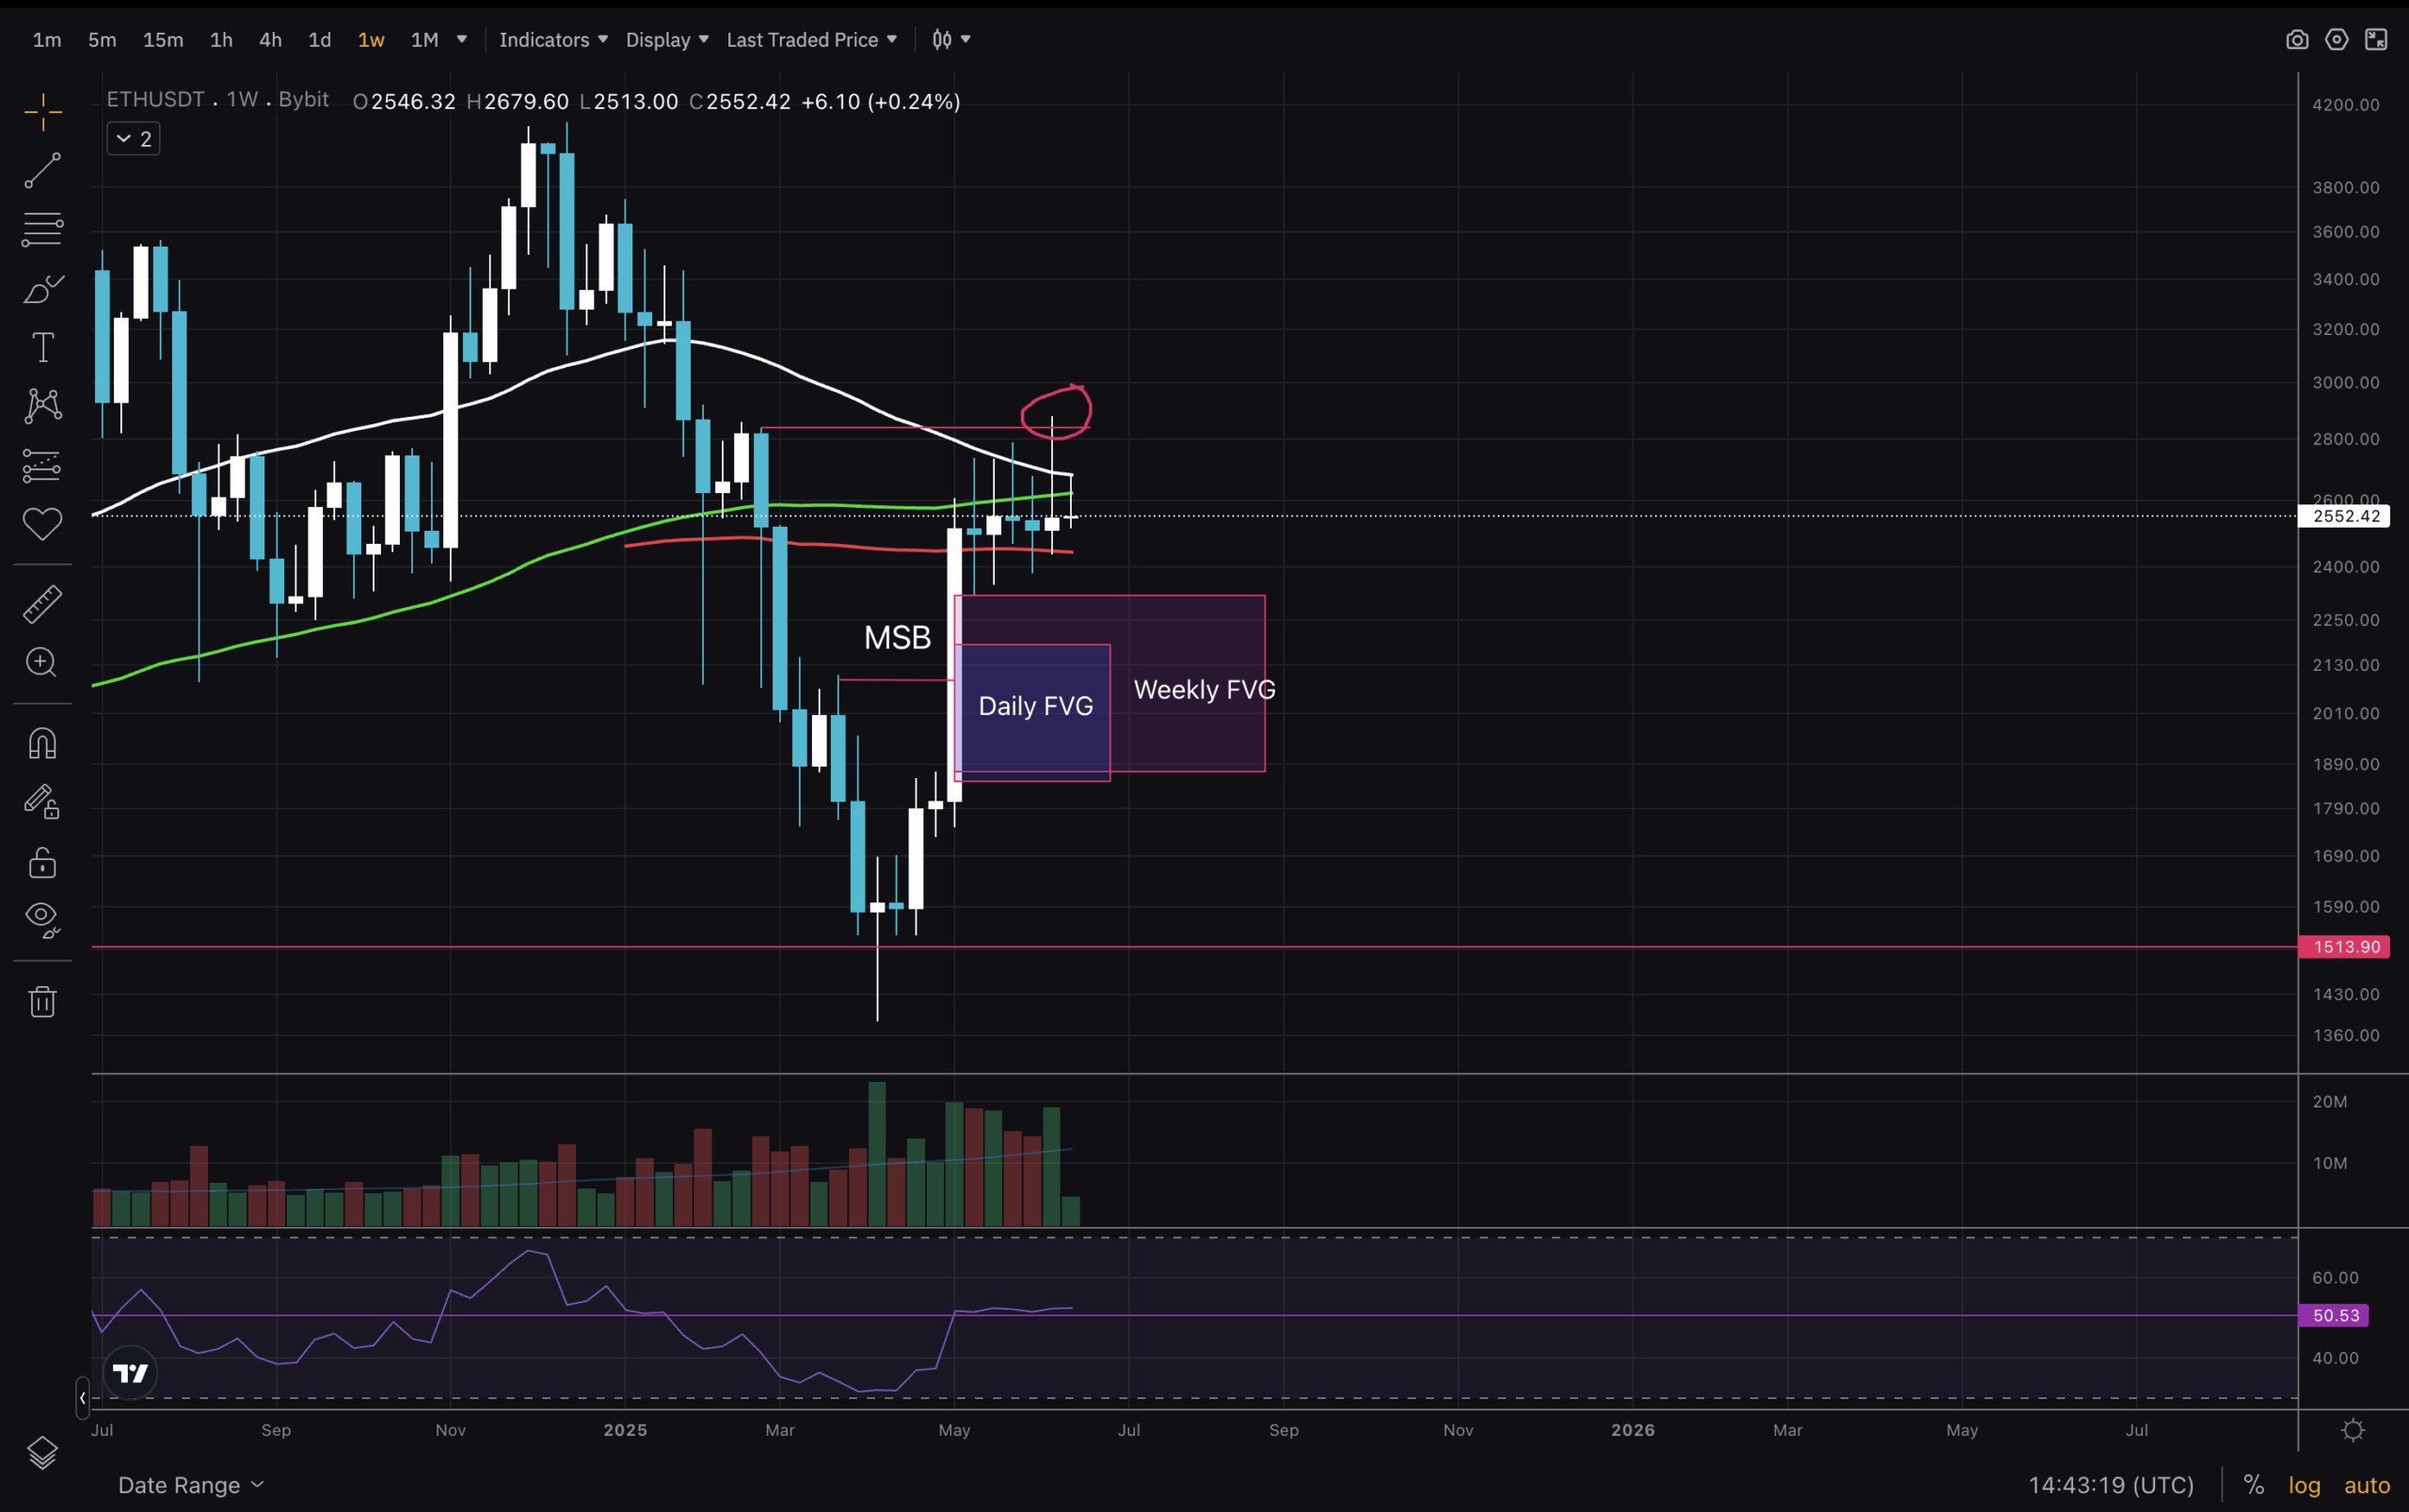
Let’s begin with a higher timeframe – the Weekly. Wild chart to be honest! A 100% increase in ethereum price within 2 months. Just a month followed by a long crab walk. Market structure could be considered broken, though some analysts would want cleaner price action to make such a claim.
For example, the previous high that was tested last week. We are still below MA50 and MA100, though above MA200! And we have 5 doji candles! Doji’s usually mean market uncertainty. The next area I’ll be watching is the weekly FGV.
(ETHUSD)
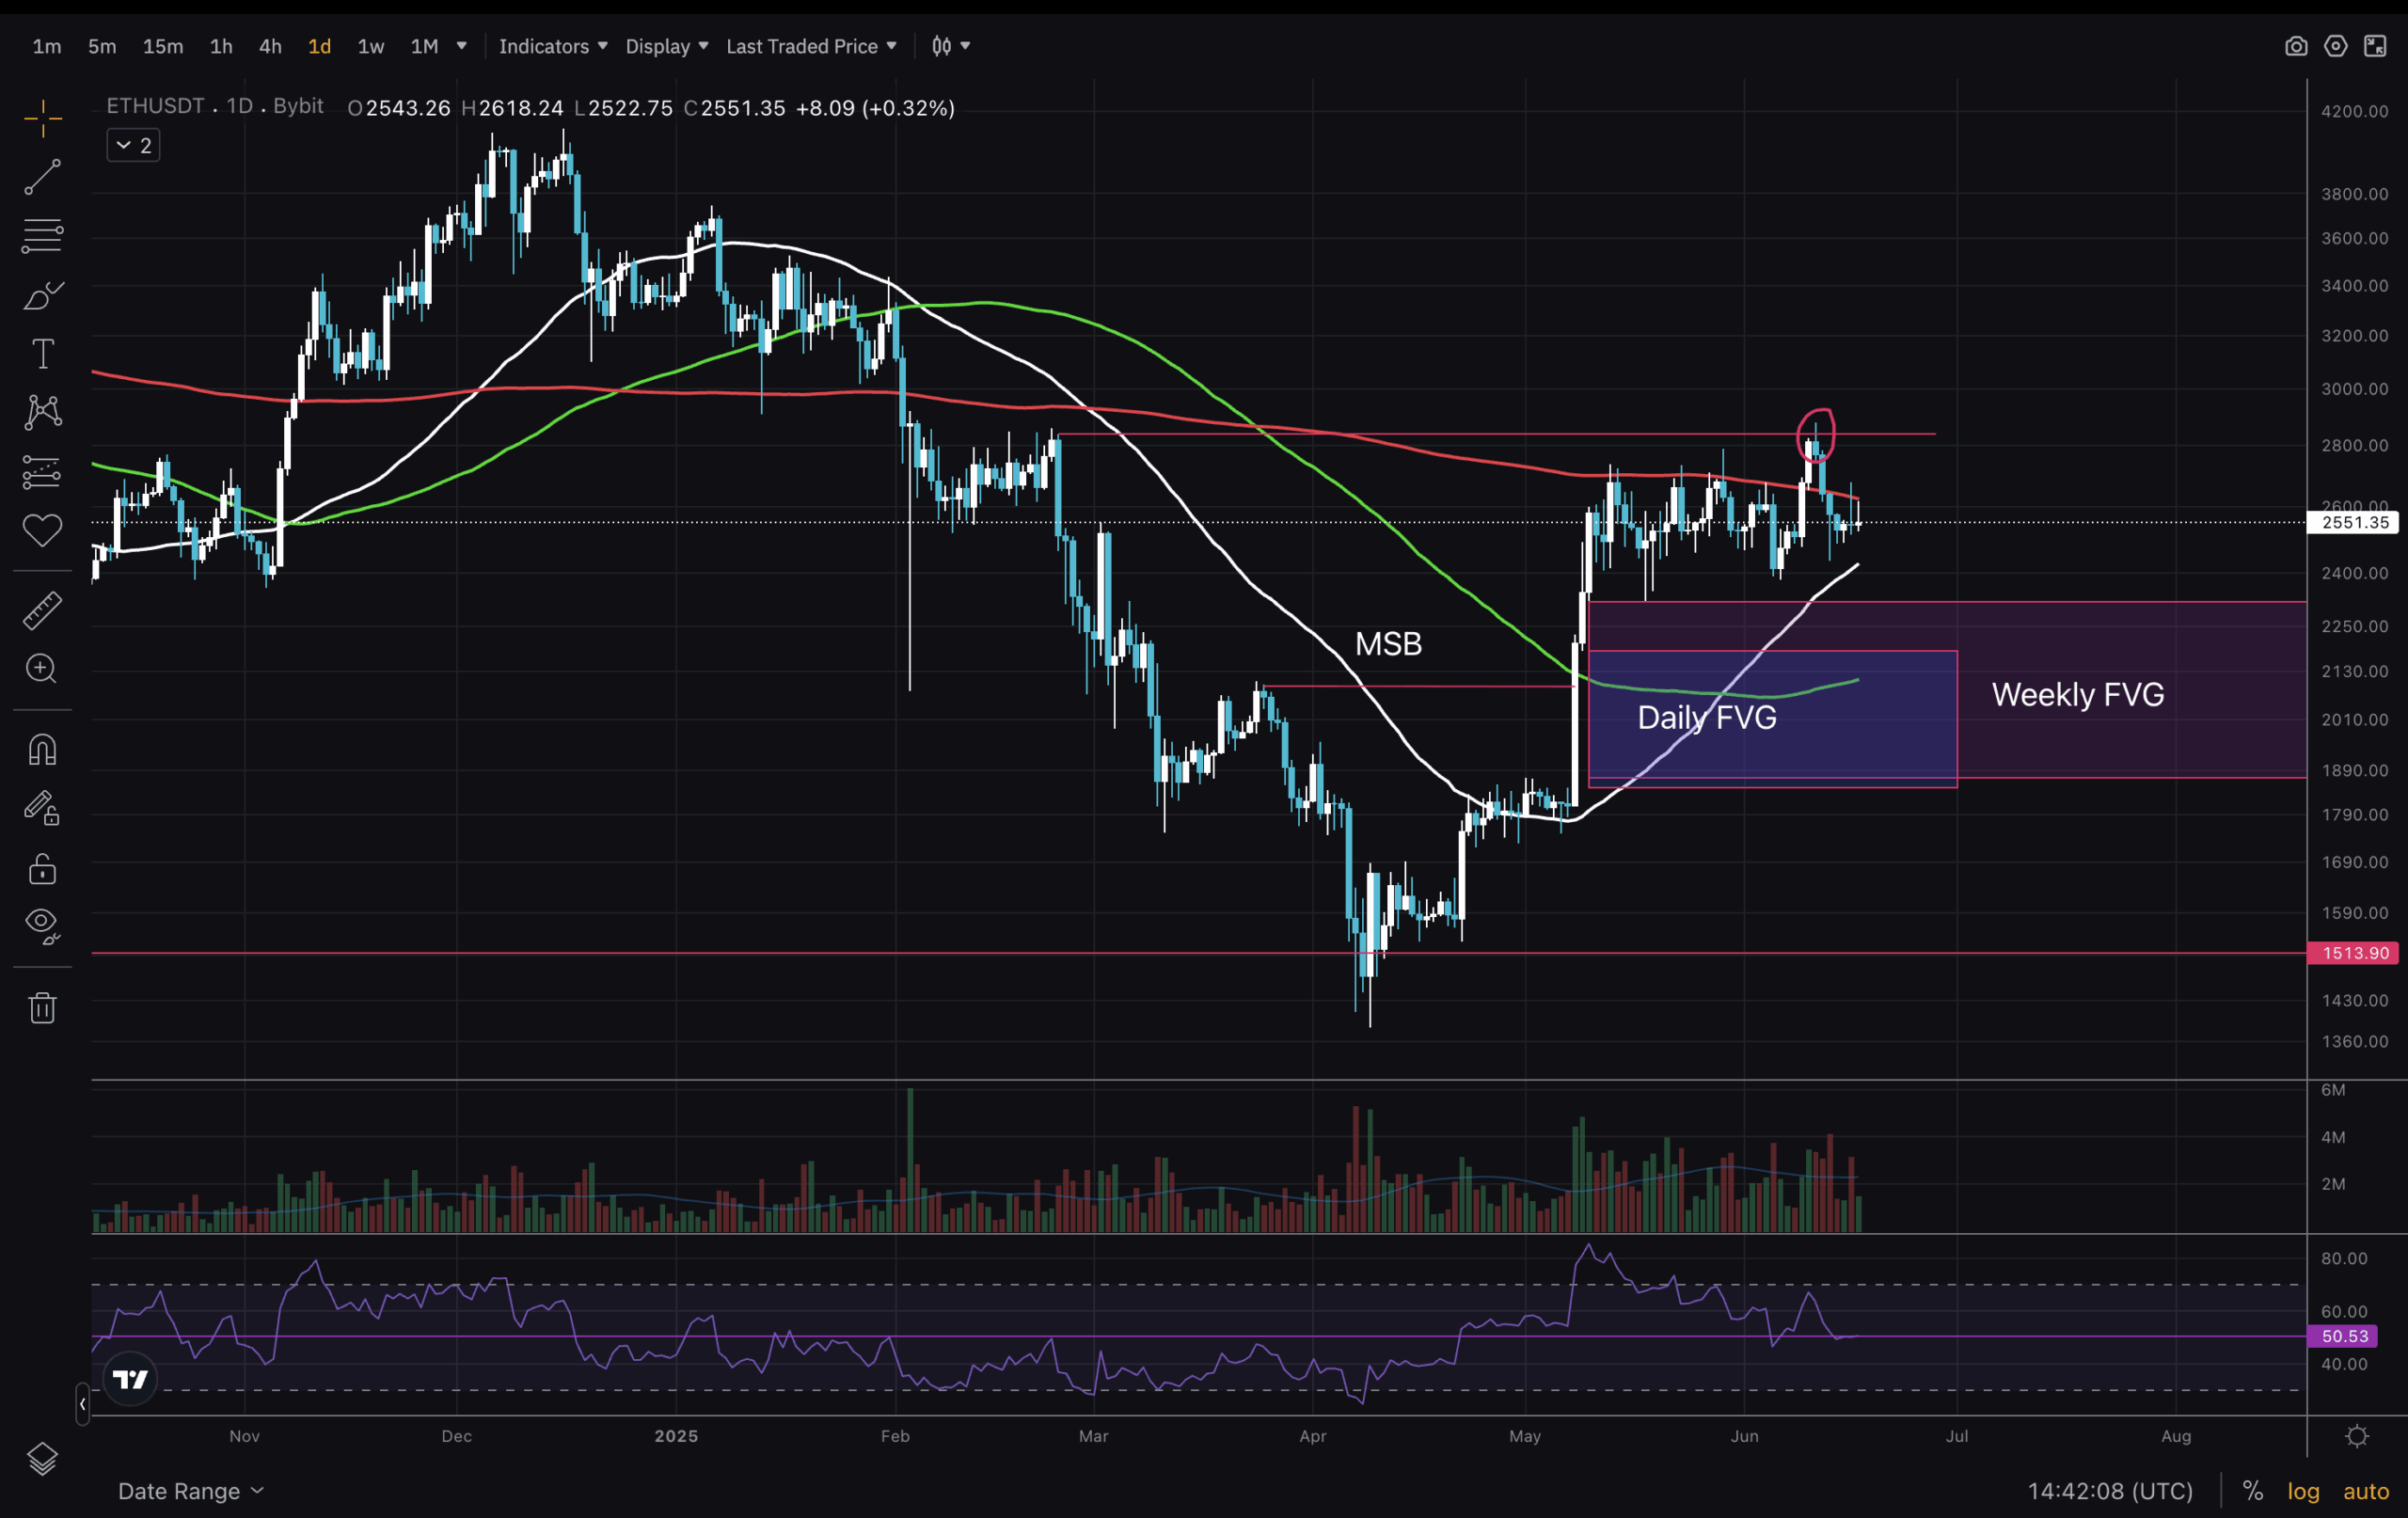
The next timeframe to focus on is the Daily. The MSB here is a bit more believable. We also have prices that deviate above MA200 for a bit and drop below, followed by a retest and rejection. The deviation also looks a bit like the evening star candlestick pattern. Not great, but expected, after such a strong pump. RSI shows a bearish deviation at the moment.
There is also a daily FVG that fits MA100. Will price fill the weekly FVG and front-run the daily? I’d say TA does work for now.
(ETHUSD)
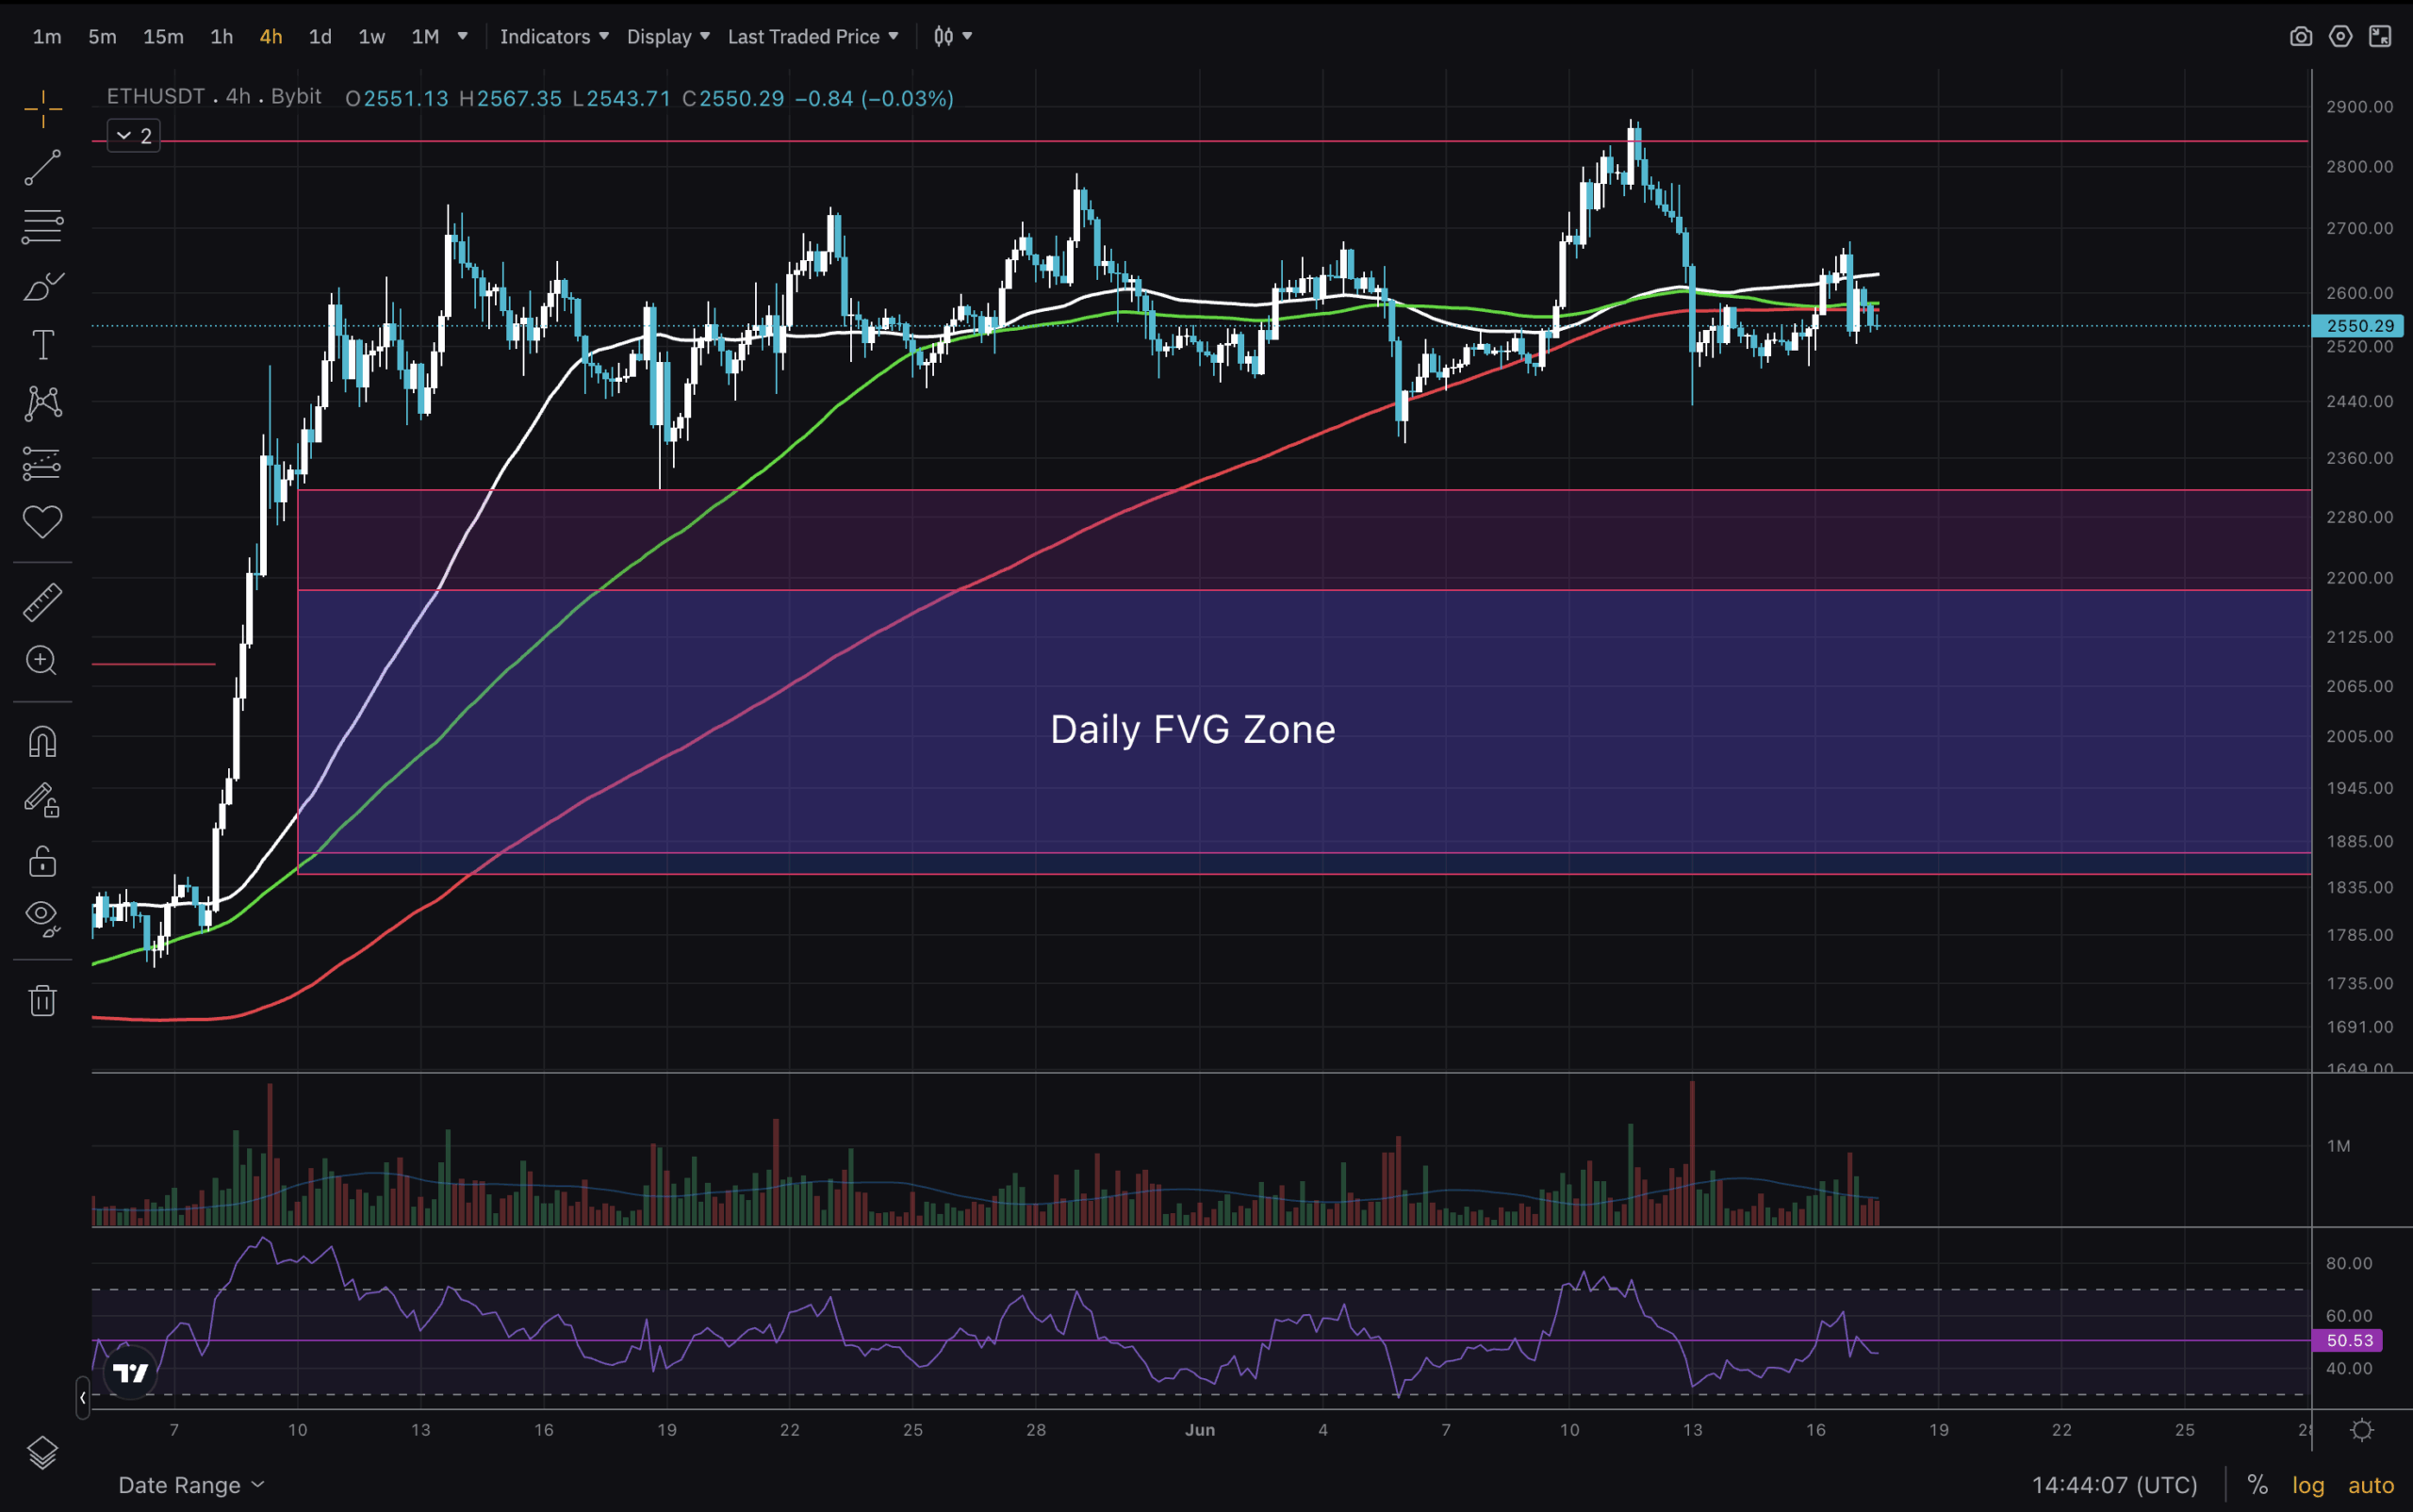
In conclusion, let us dive into a shorter 4H timeframe. There is a lot of confluence on the higher time frames, pointing toward a retrace. It is to be seen how deep it will go, though my preference is somewhere in the Daily FVG zone. Then the structure will look more efficient and the market can peacefully, hopefully accompanied by a peace agreement in the East, MOVE above those MAs.
In the 4H timeframe, the price exceeded all MAs, which is another sign of weakness. One can always be surprised, though! Therefore, always manage your risk.
Join The 99Bitcoins News Discord Here For The Latest Market Update
Ethereum Price Stalls: Technical Analysis During Political Conflict?
- Market structure remains bullish
- RSI shows hidden bearish divergence on 1D timeframe
- Price rejected by MA200 on 1D – current resistance
- Needs to break and close above MA200 on 1D for alt season.
