Bitcoin Smashes Resistance – Is $100K the Next Stop? May 2025 Price Outlook

After months of sideways action, BTC just ripped through its previous all-time high—traders are now eyeing six figures as the next psychological battleground.
Key drivers: Spot ETF inflows hit $12B this month alone, while the Fed’s dovish pivot sends institutional FOMO into overdrive. Retail? Still stacking sats like it’s 2021.
Watch the $75K level: A clean hold here could trigger the mother of all short squeezes. But let’s be real—Wall Street will front-run the rally, then dump the top on retail (again).
Bottom line: The charts scream bullish, but remember—crypto moves fast. Today’s ATH party could be tomorrow’s ’congrats, you played yourself’ moment.

Must know something. pic.twitter.com/58njcvR4e7
— Gordon (@AltcoinGordon) May 15, 2025
As Gordon’s tweet shows, long-term holders were selling between October 2024 and January 2025. The selling started when the price ranged between $60,000 and $70,000 and grew in November as it went up to $100,000. They accumulated again in February ($97,000) and April ($75,000). Now, the amount they hold is back to the September – October high. Was it a smart move, though? I’m not so sure.
Bitcoin Price Analysis Insights for May 2025
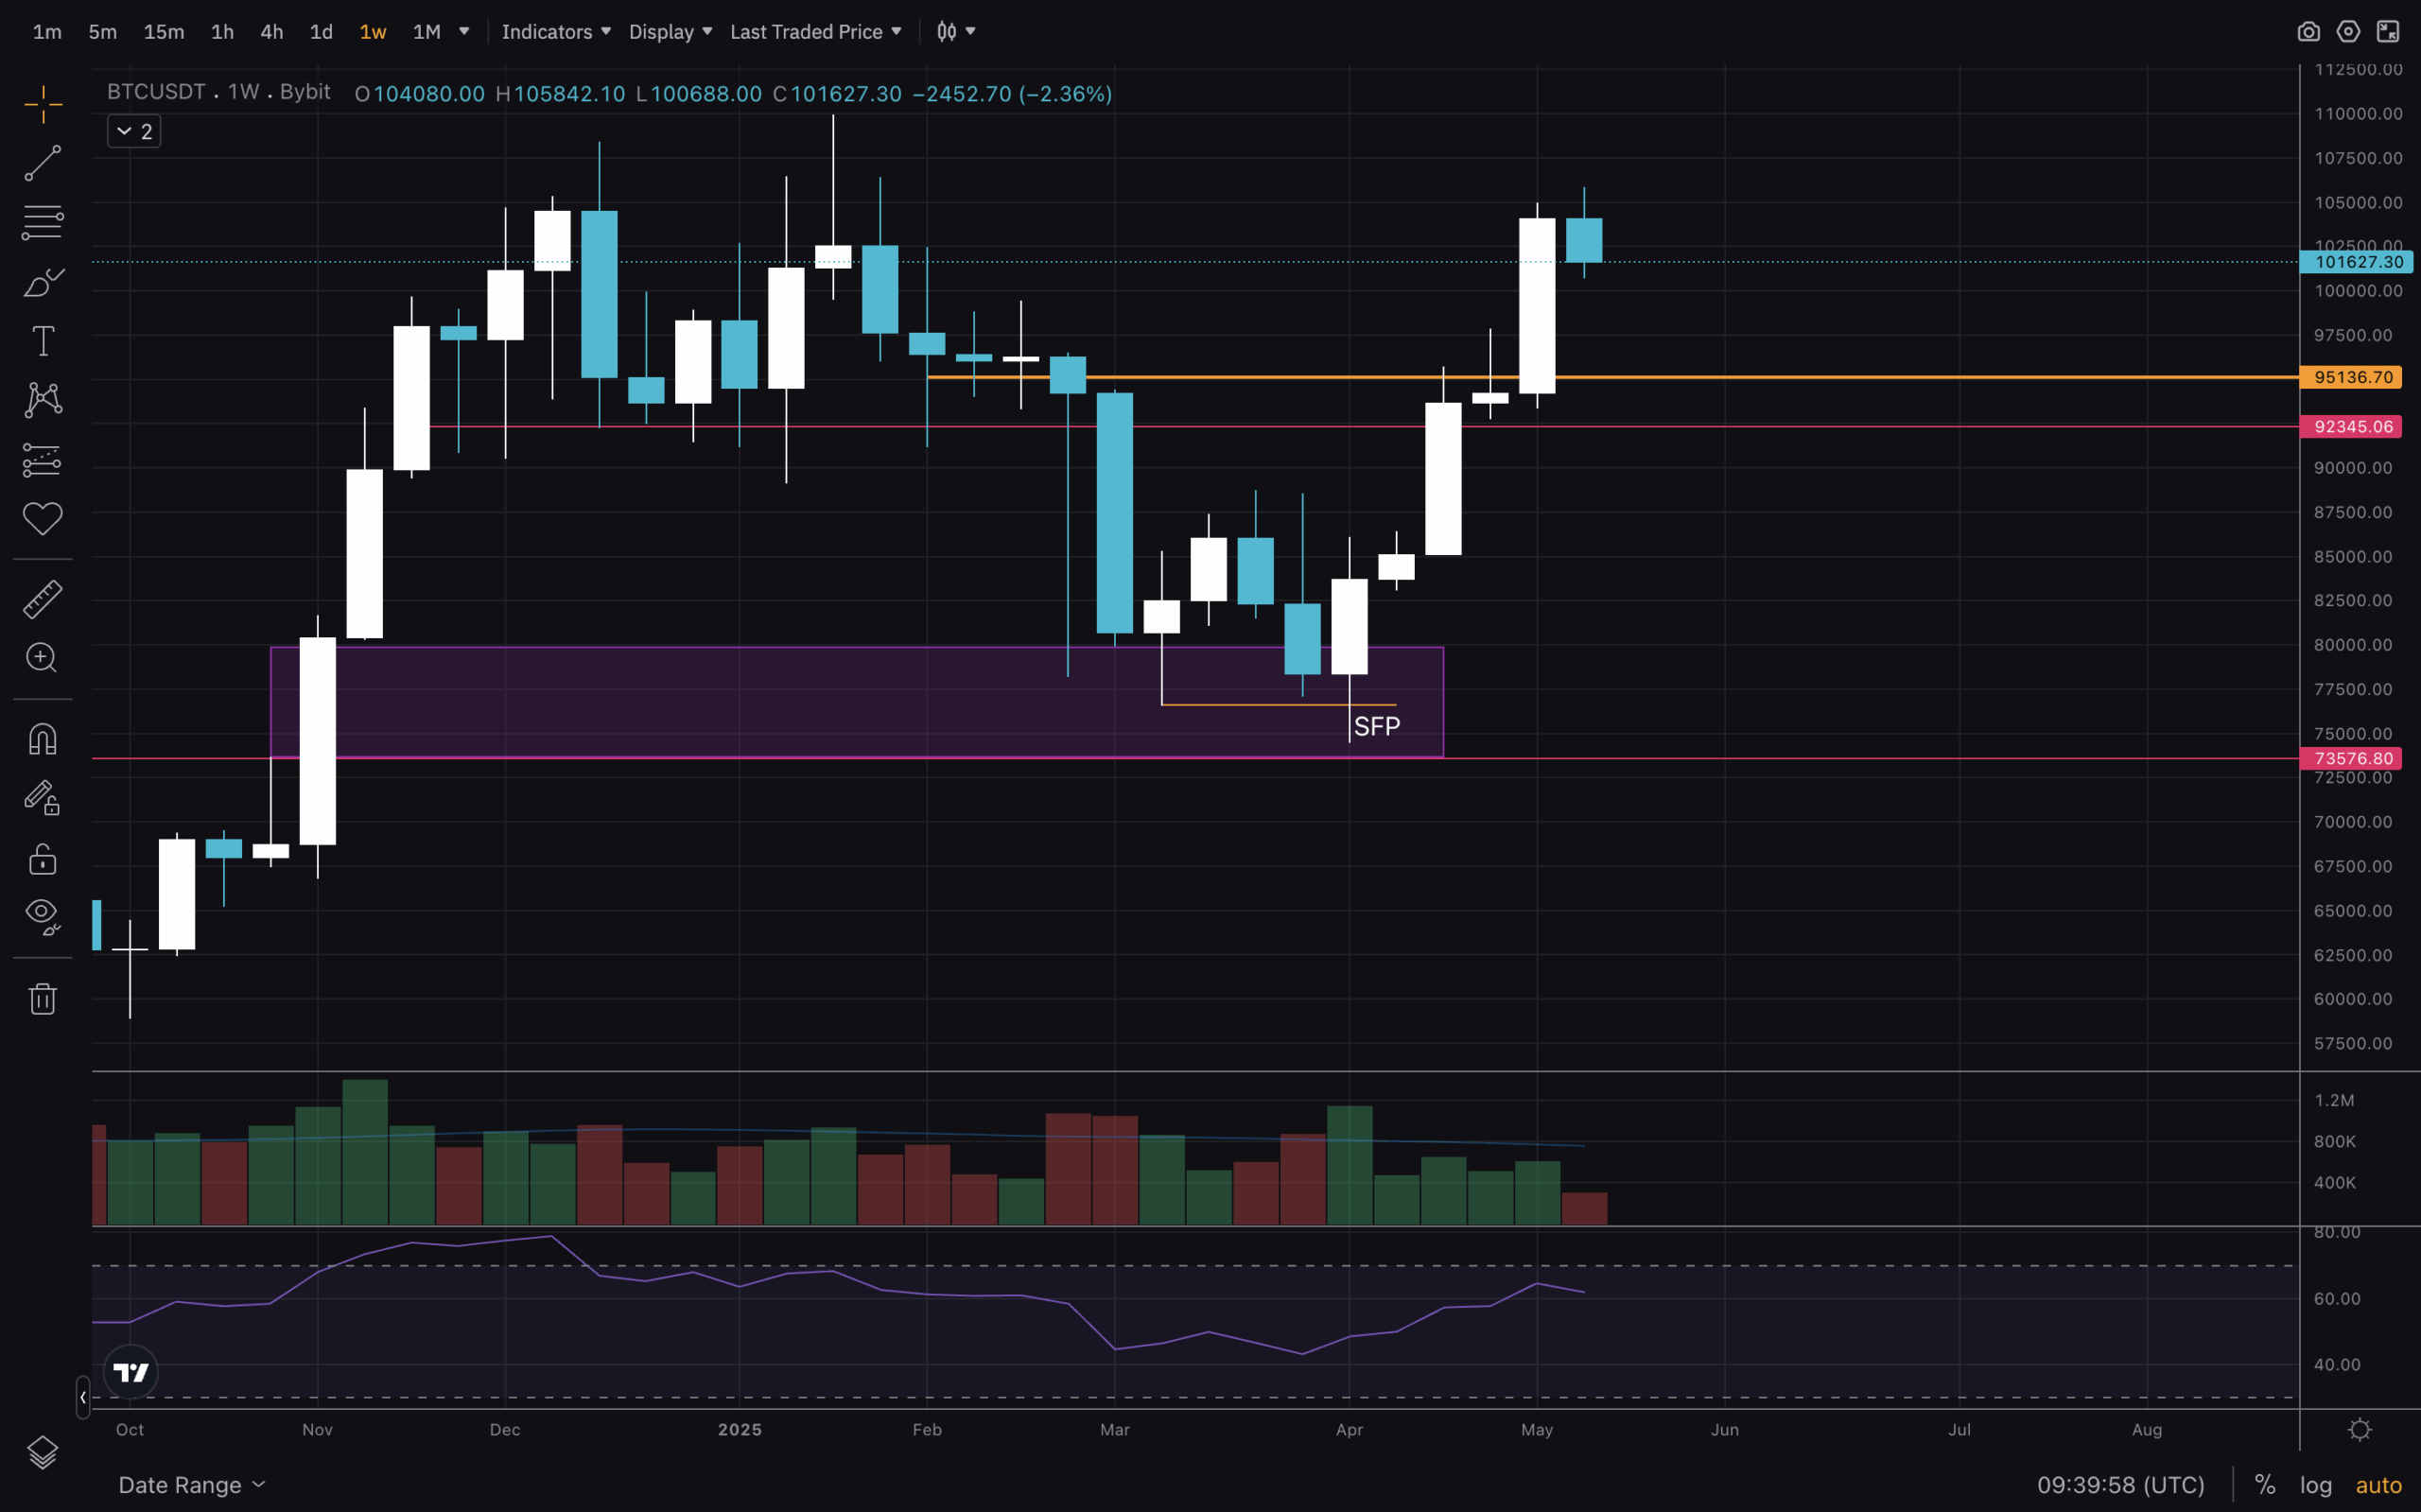
(BTCUSD)
The chart gives us plenty of information, starting with the 1W timeframe. $73k is 2024’s high—a level we wanted to see as support. It got a front run, which was to be expected. The purple zone explored in last month’s article was an FVG gap and an area of interest where the market found new liquidity. And we witnessed an SFP.
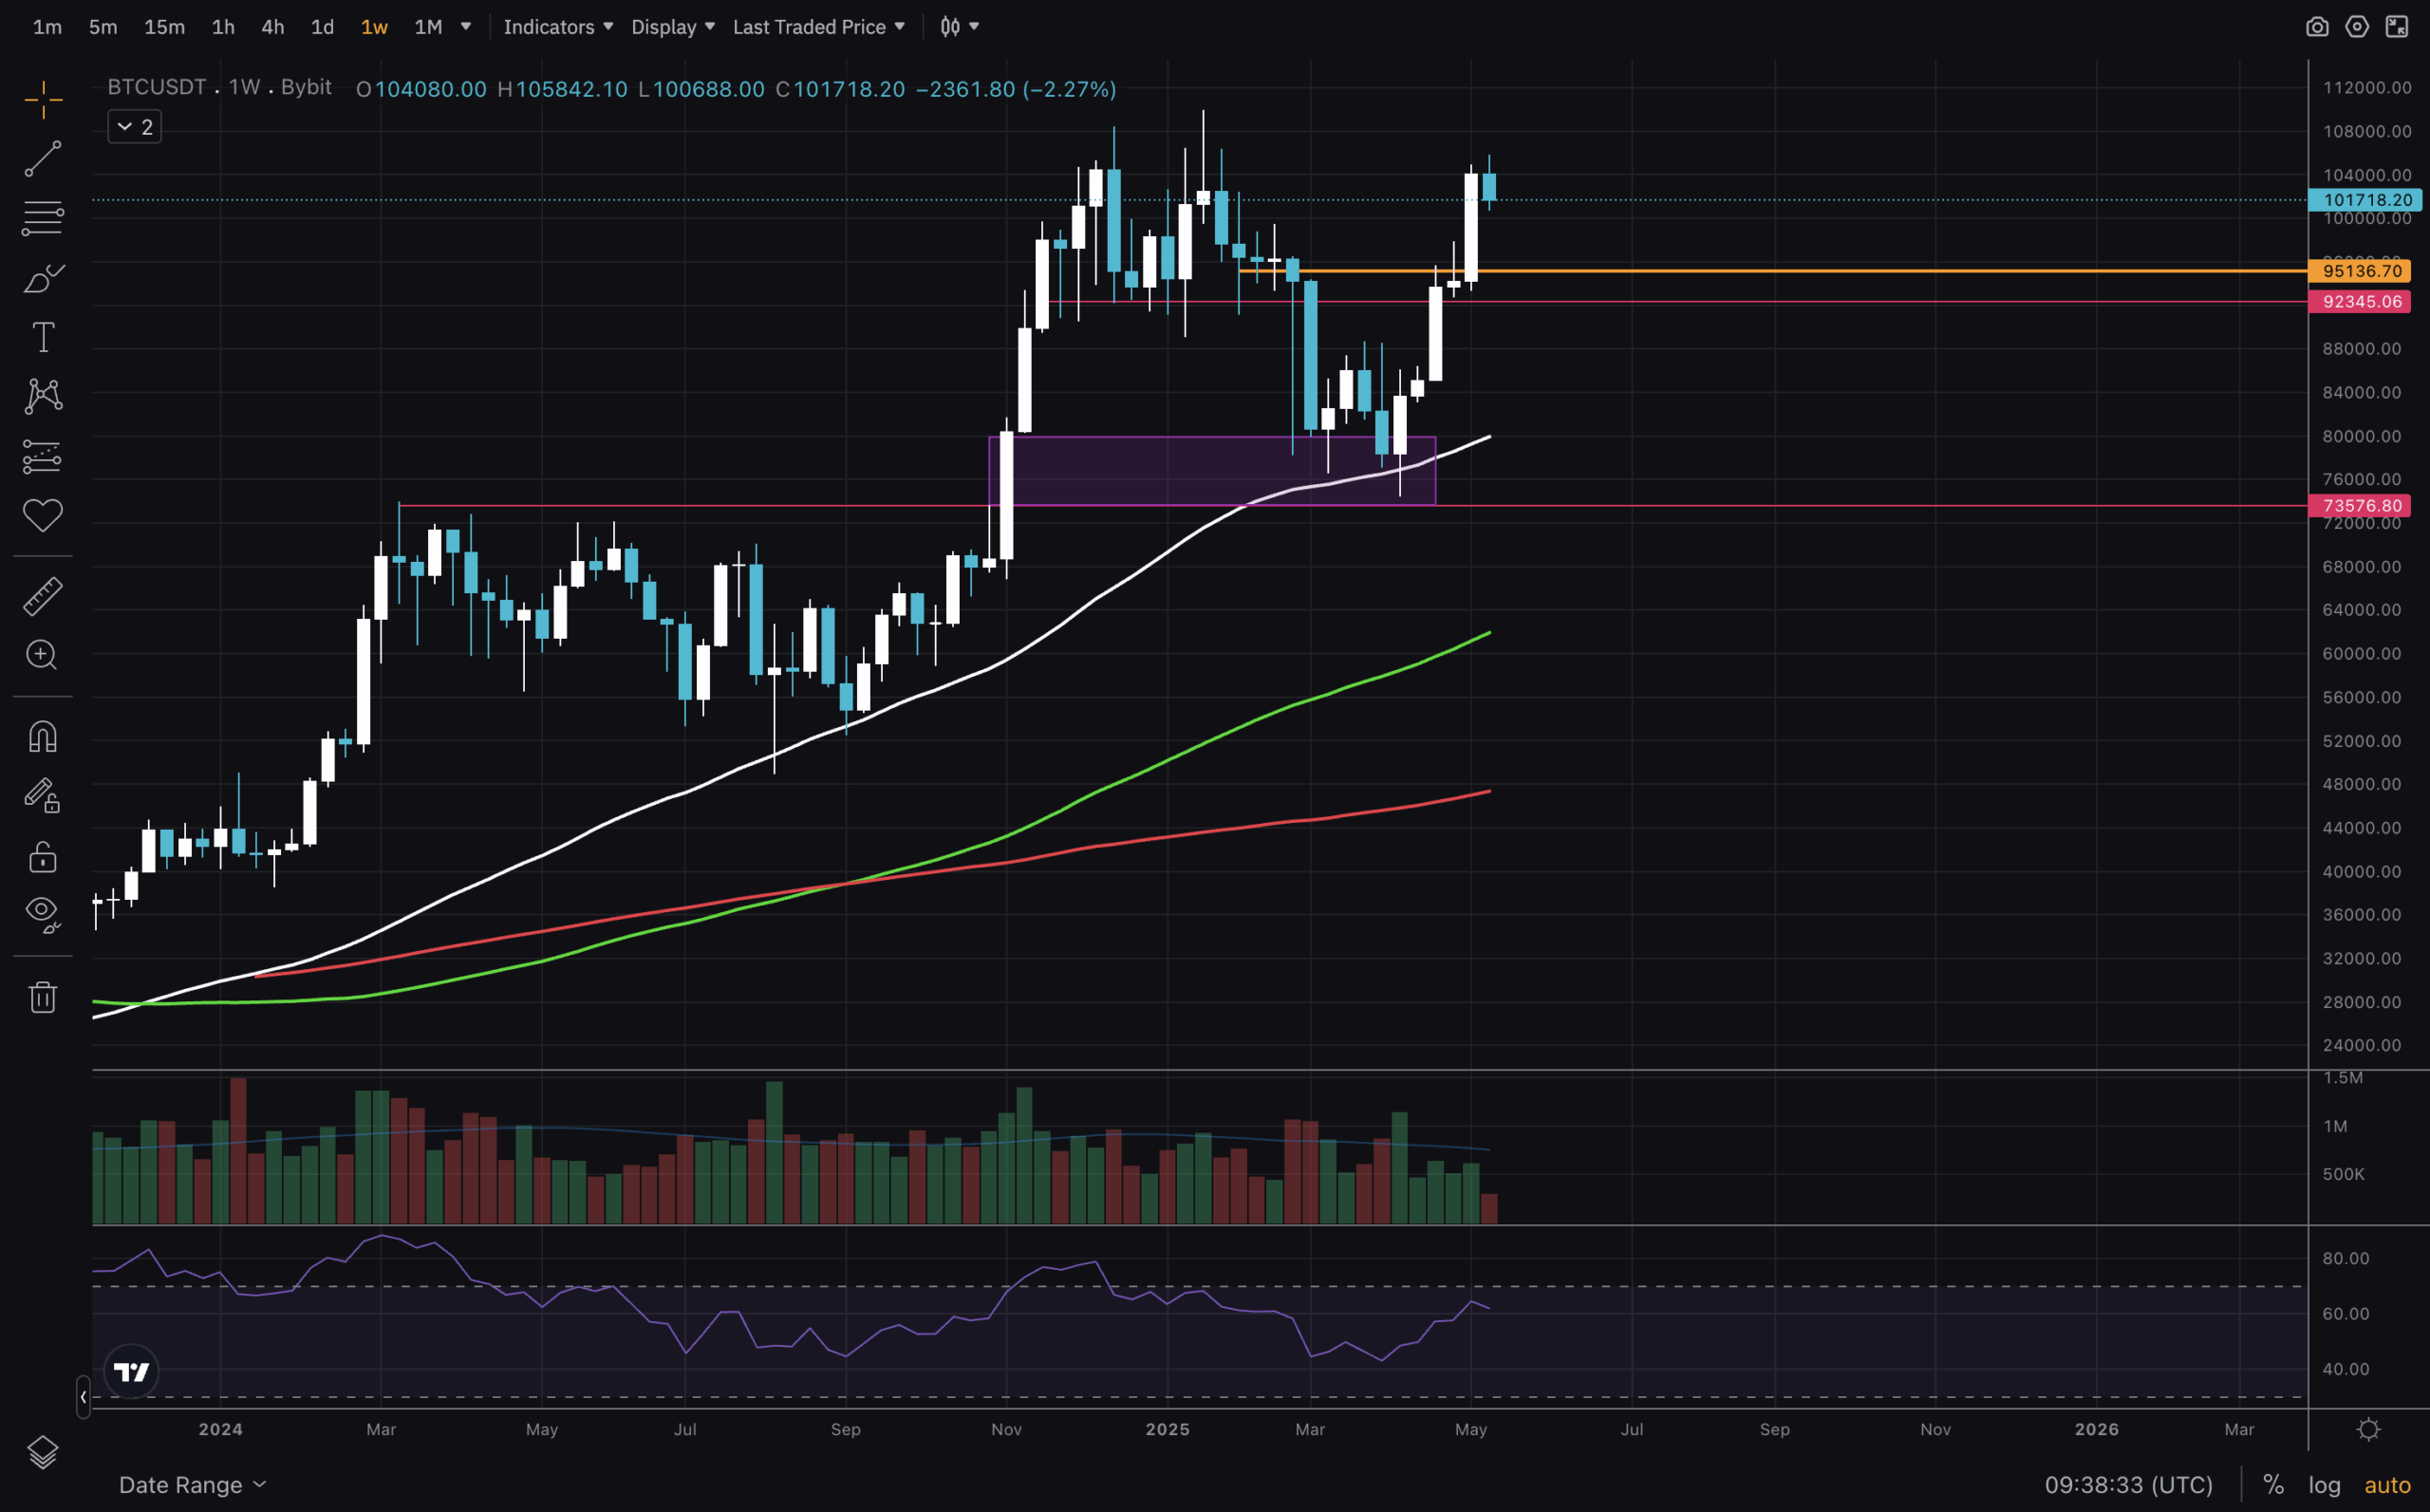
(BTCUSD)
Adding the MAs on the weekly chart, we see a perfect retest and close above MA50, followed by this month long pump. The structure remains bullish and has not been broken! Ideally, we’d see price test the $92,000-$95,000 zone. And if it goes down further, we don’t want to see it close below $80,000. If that happens – market structure is broken.
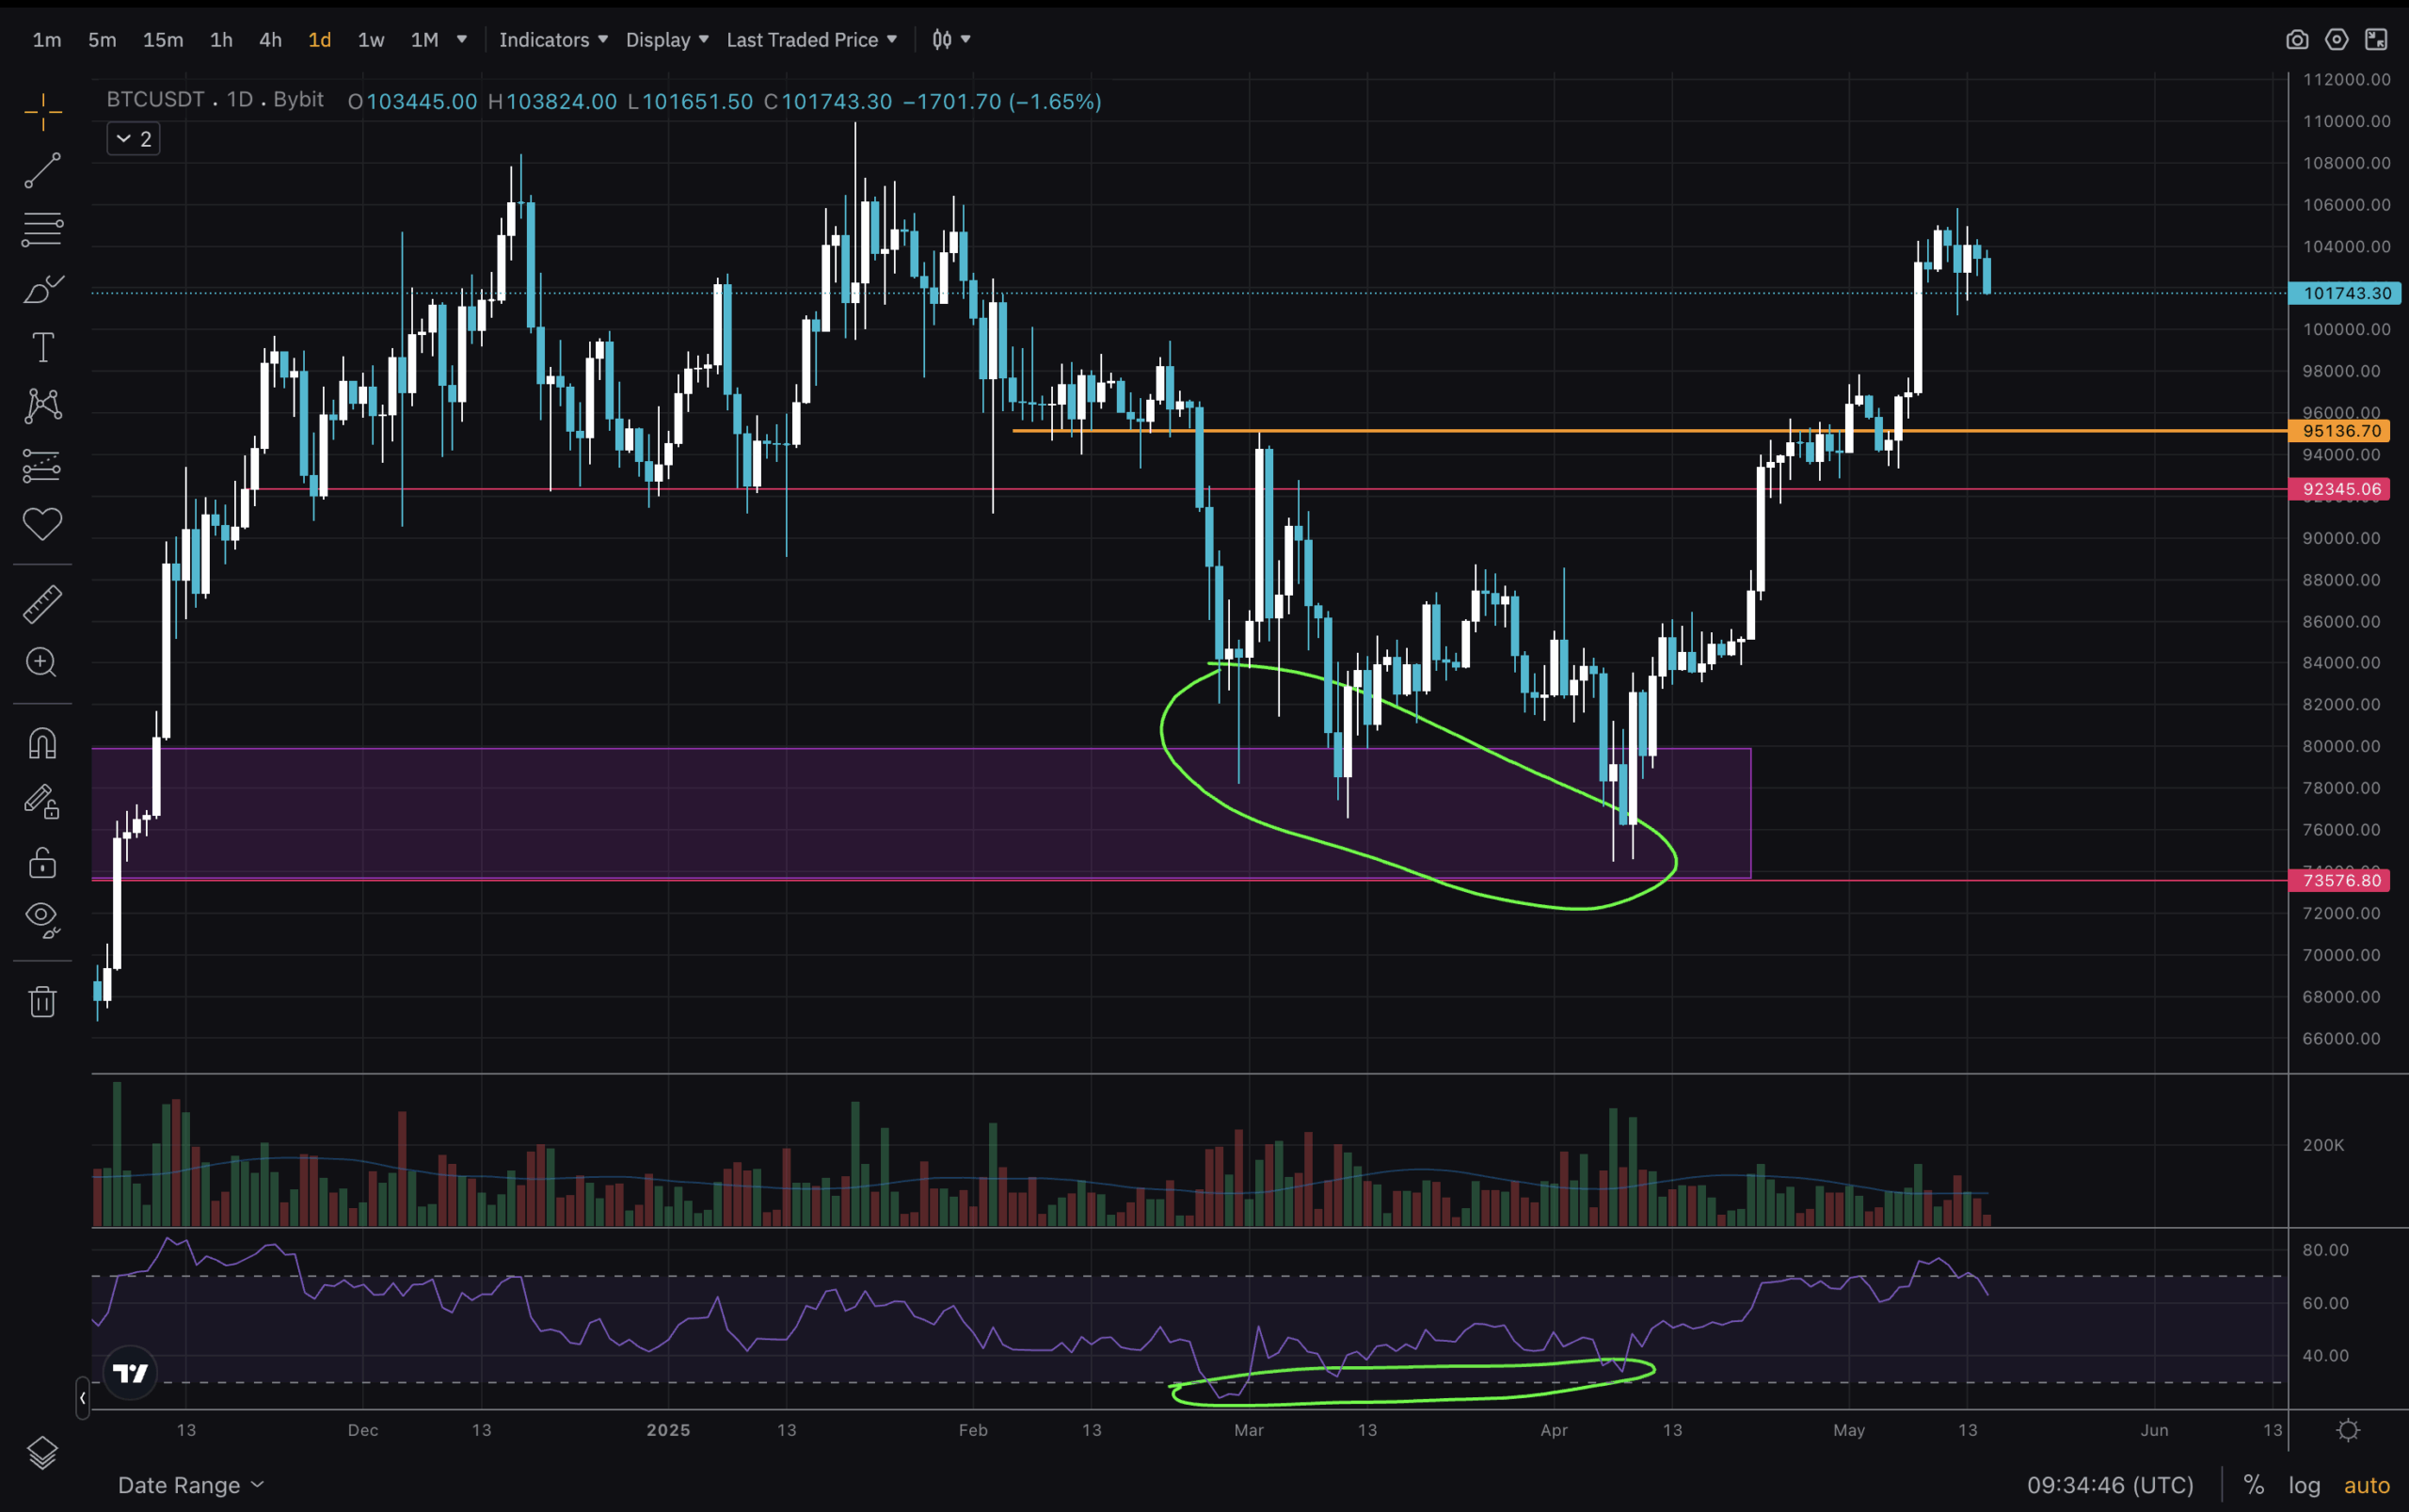
(BTCUSD)
Next, we’ll analyse the Daily timeframe. The RSI divergence discussed in the previous article played out perfectly, and this large MOVE up with very little resistance in the $90k area was unexpected. A great sign of strength, though! Now, as the downtrend has been broken, the price will likely look to form a lower high.
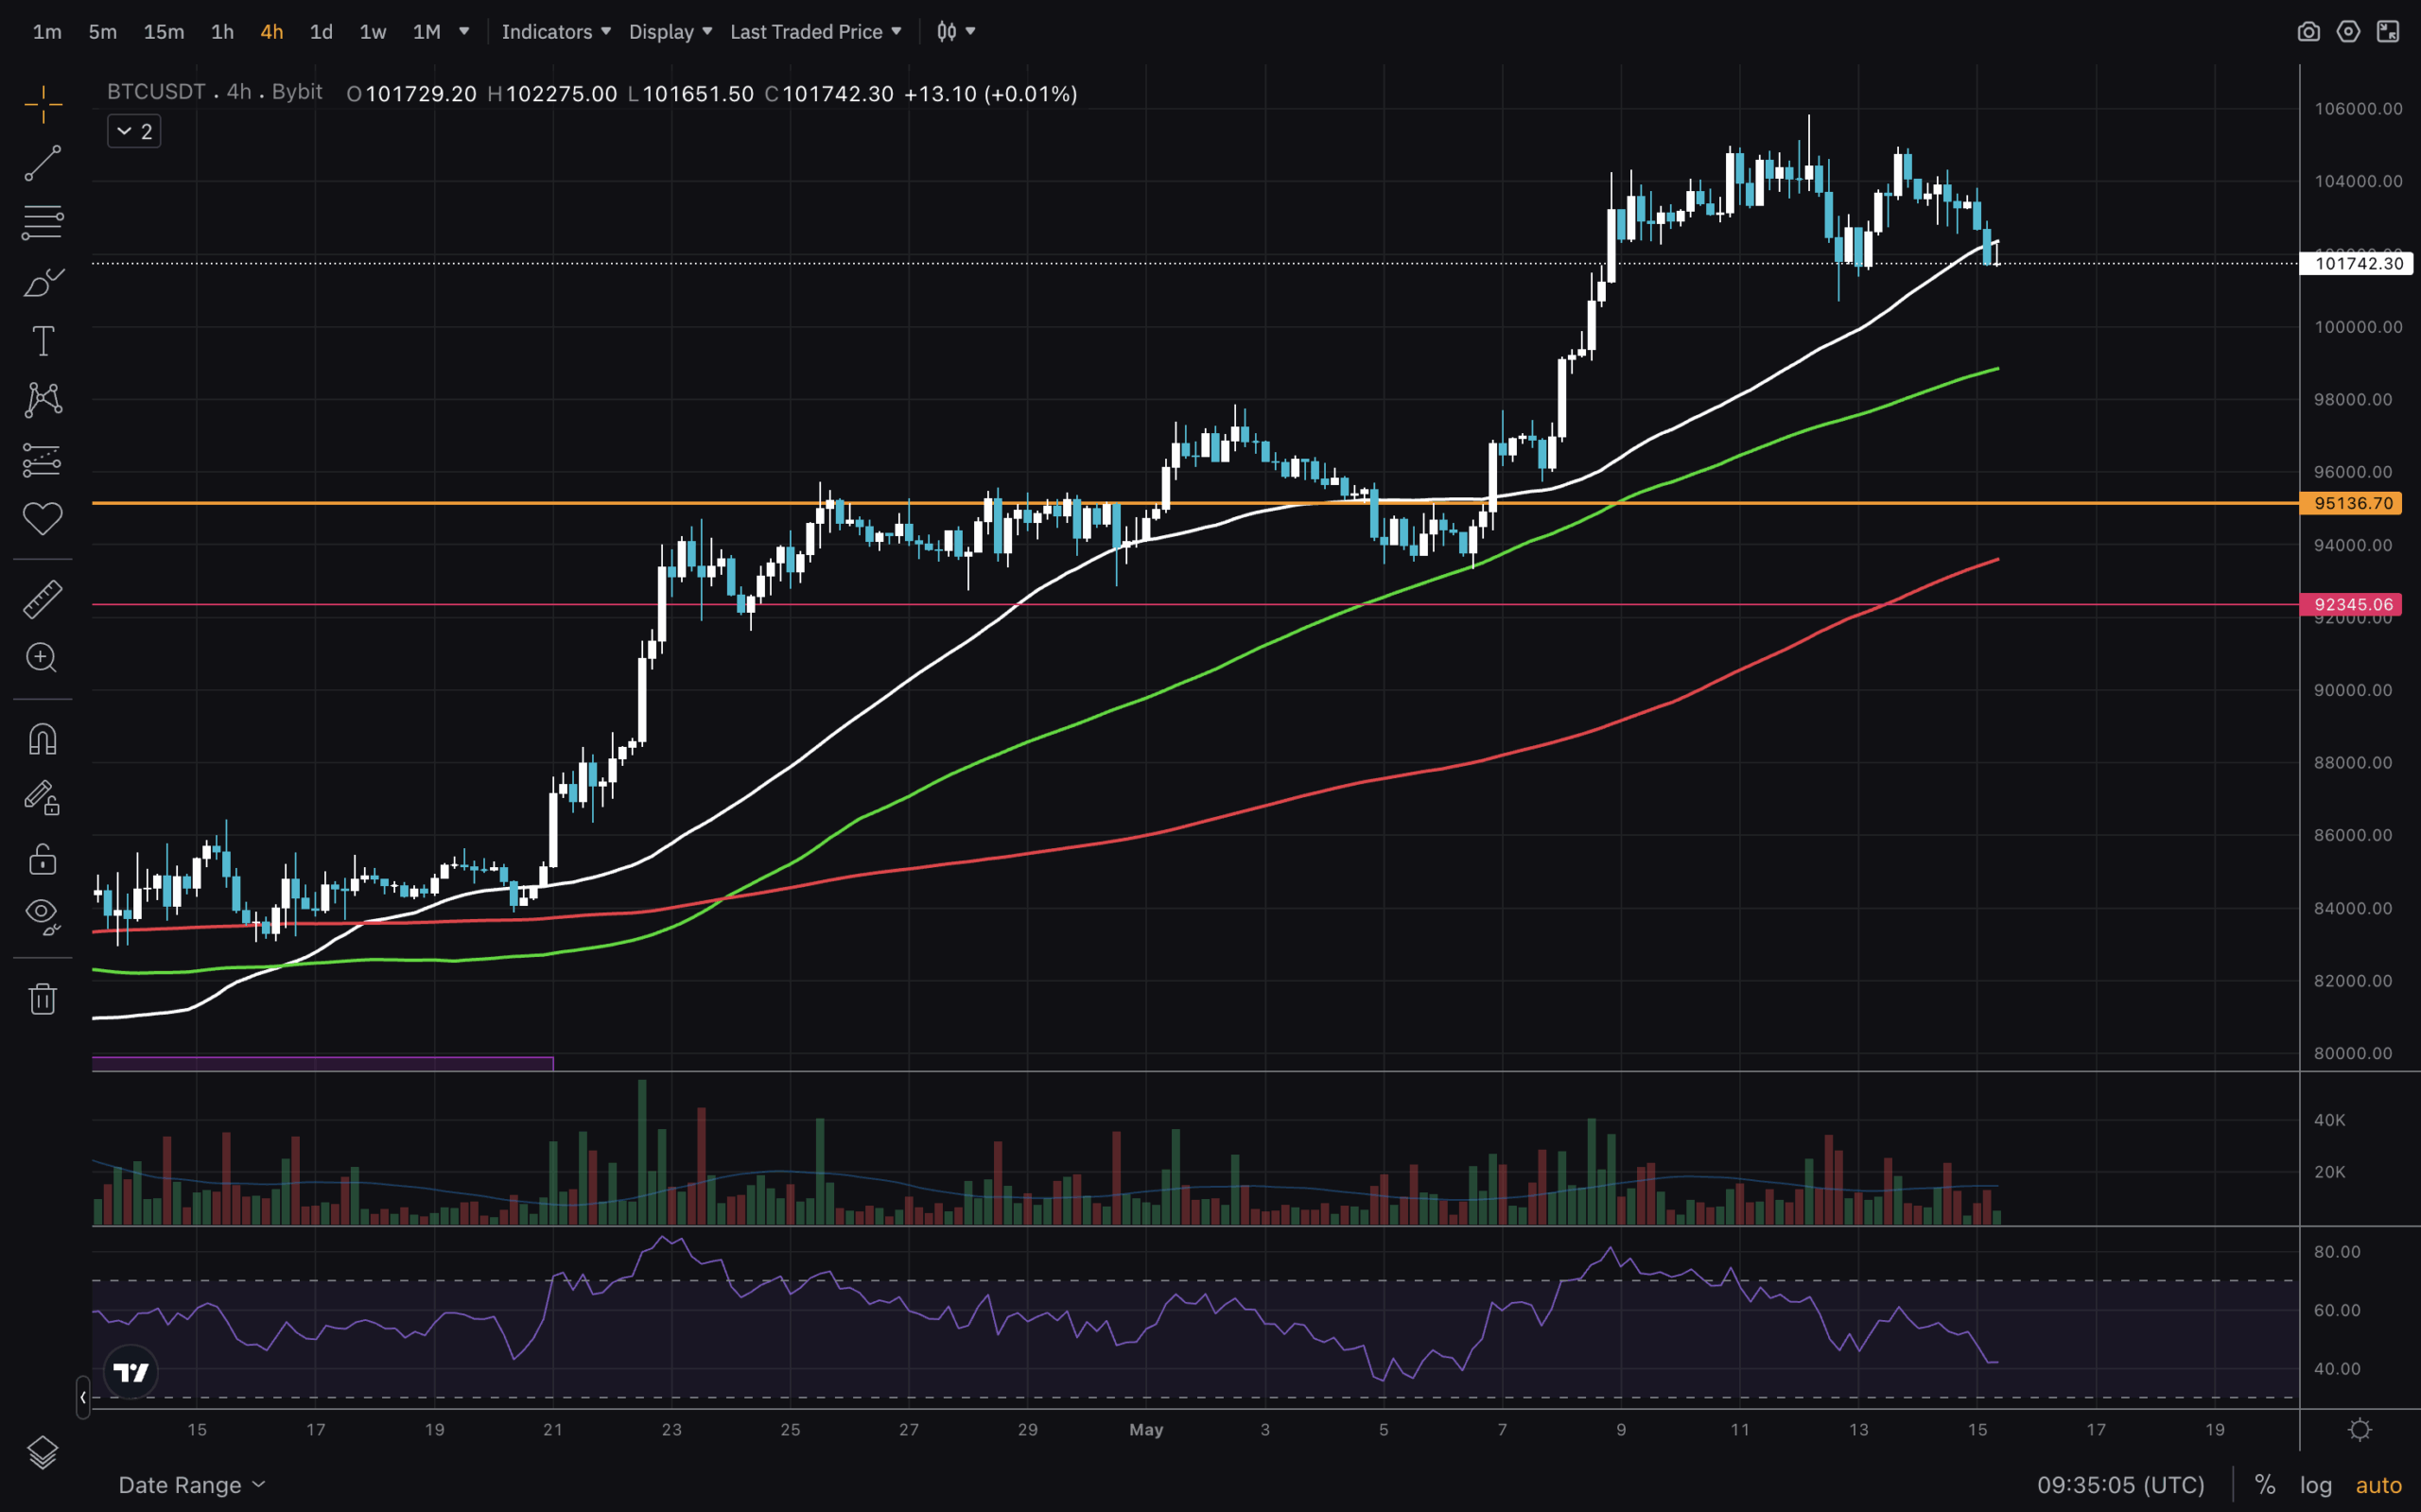
(BTCUSD)
A possible long entry WOULD be the MA200 on the 4H timeframe, which currently sits between the $92-$95k mentioned above. RSI also needs to cool down and reset. The 1D MAs are also above $90k, so that would be my level to watch. It’s a great psychological level as well.
Join The 99Bitcoins News Discord Here For The Latest Market Updates
Bitcoin Price Analysis for May 2025: We Are So Back!
- Key levels to retest are $90,000 – $95,000
- 1D Trend is up again, looking for a lower high to form
- Price grew 40% in a month – bullish!
