SUI USD Rocket Fuel: Bulls Primed for Lunar Mission or Grounded Reality?

SUI's price trajectory sparks heated debate among crypto enthusiasts—moon mission or temporary hype?
Technical indicators flash mixed signals
Chart patterns show bullish formations while volume metrics suggest cautious optimism. The token dances between resistance and support levels, keeping traders on edge.
Market sentiment divided
Crypto veterans recall similar patterns that either launched assets into orbit or left them stranded on the launchpad. One analyst quipped, 'Another day, another crypto promising the moon while Wall Street bankers laugh all the way to their actual banks.'
The only certainty? Volatility remains the constant companion in this high-stakes space race.
$SUI found solid support from the summer lows.
Once we see a reclaim of the support that was wicked through during the recent market crash (a little over $3.00), still expect this to accelerate and send out of the range it's been accumulating in all of 2025. pic.twitter.com/oy1kVH74iJ
— K A L E O (@CryptoKaleo) October 20, 2025
Kaleo’s chart is one good reason why diagonal lines are not so accurate. Horizontal lines, such as the green zone he drew, tend to be respected more often by market makers. Will his bullish thesis come true, though?
SUI USD On The Verge Of Parabolic Run! Or Not?
(Source – Tradingview, SUIUSD)
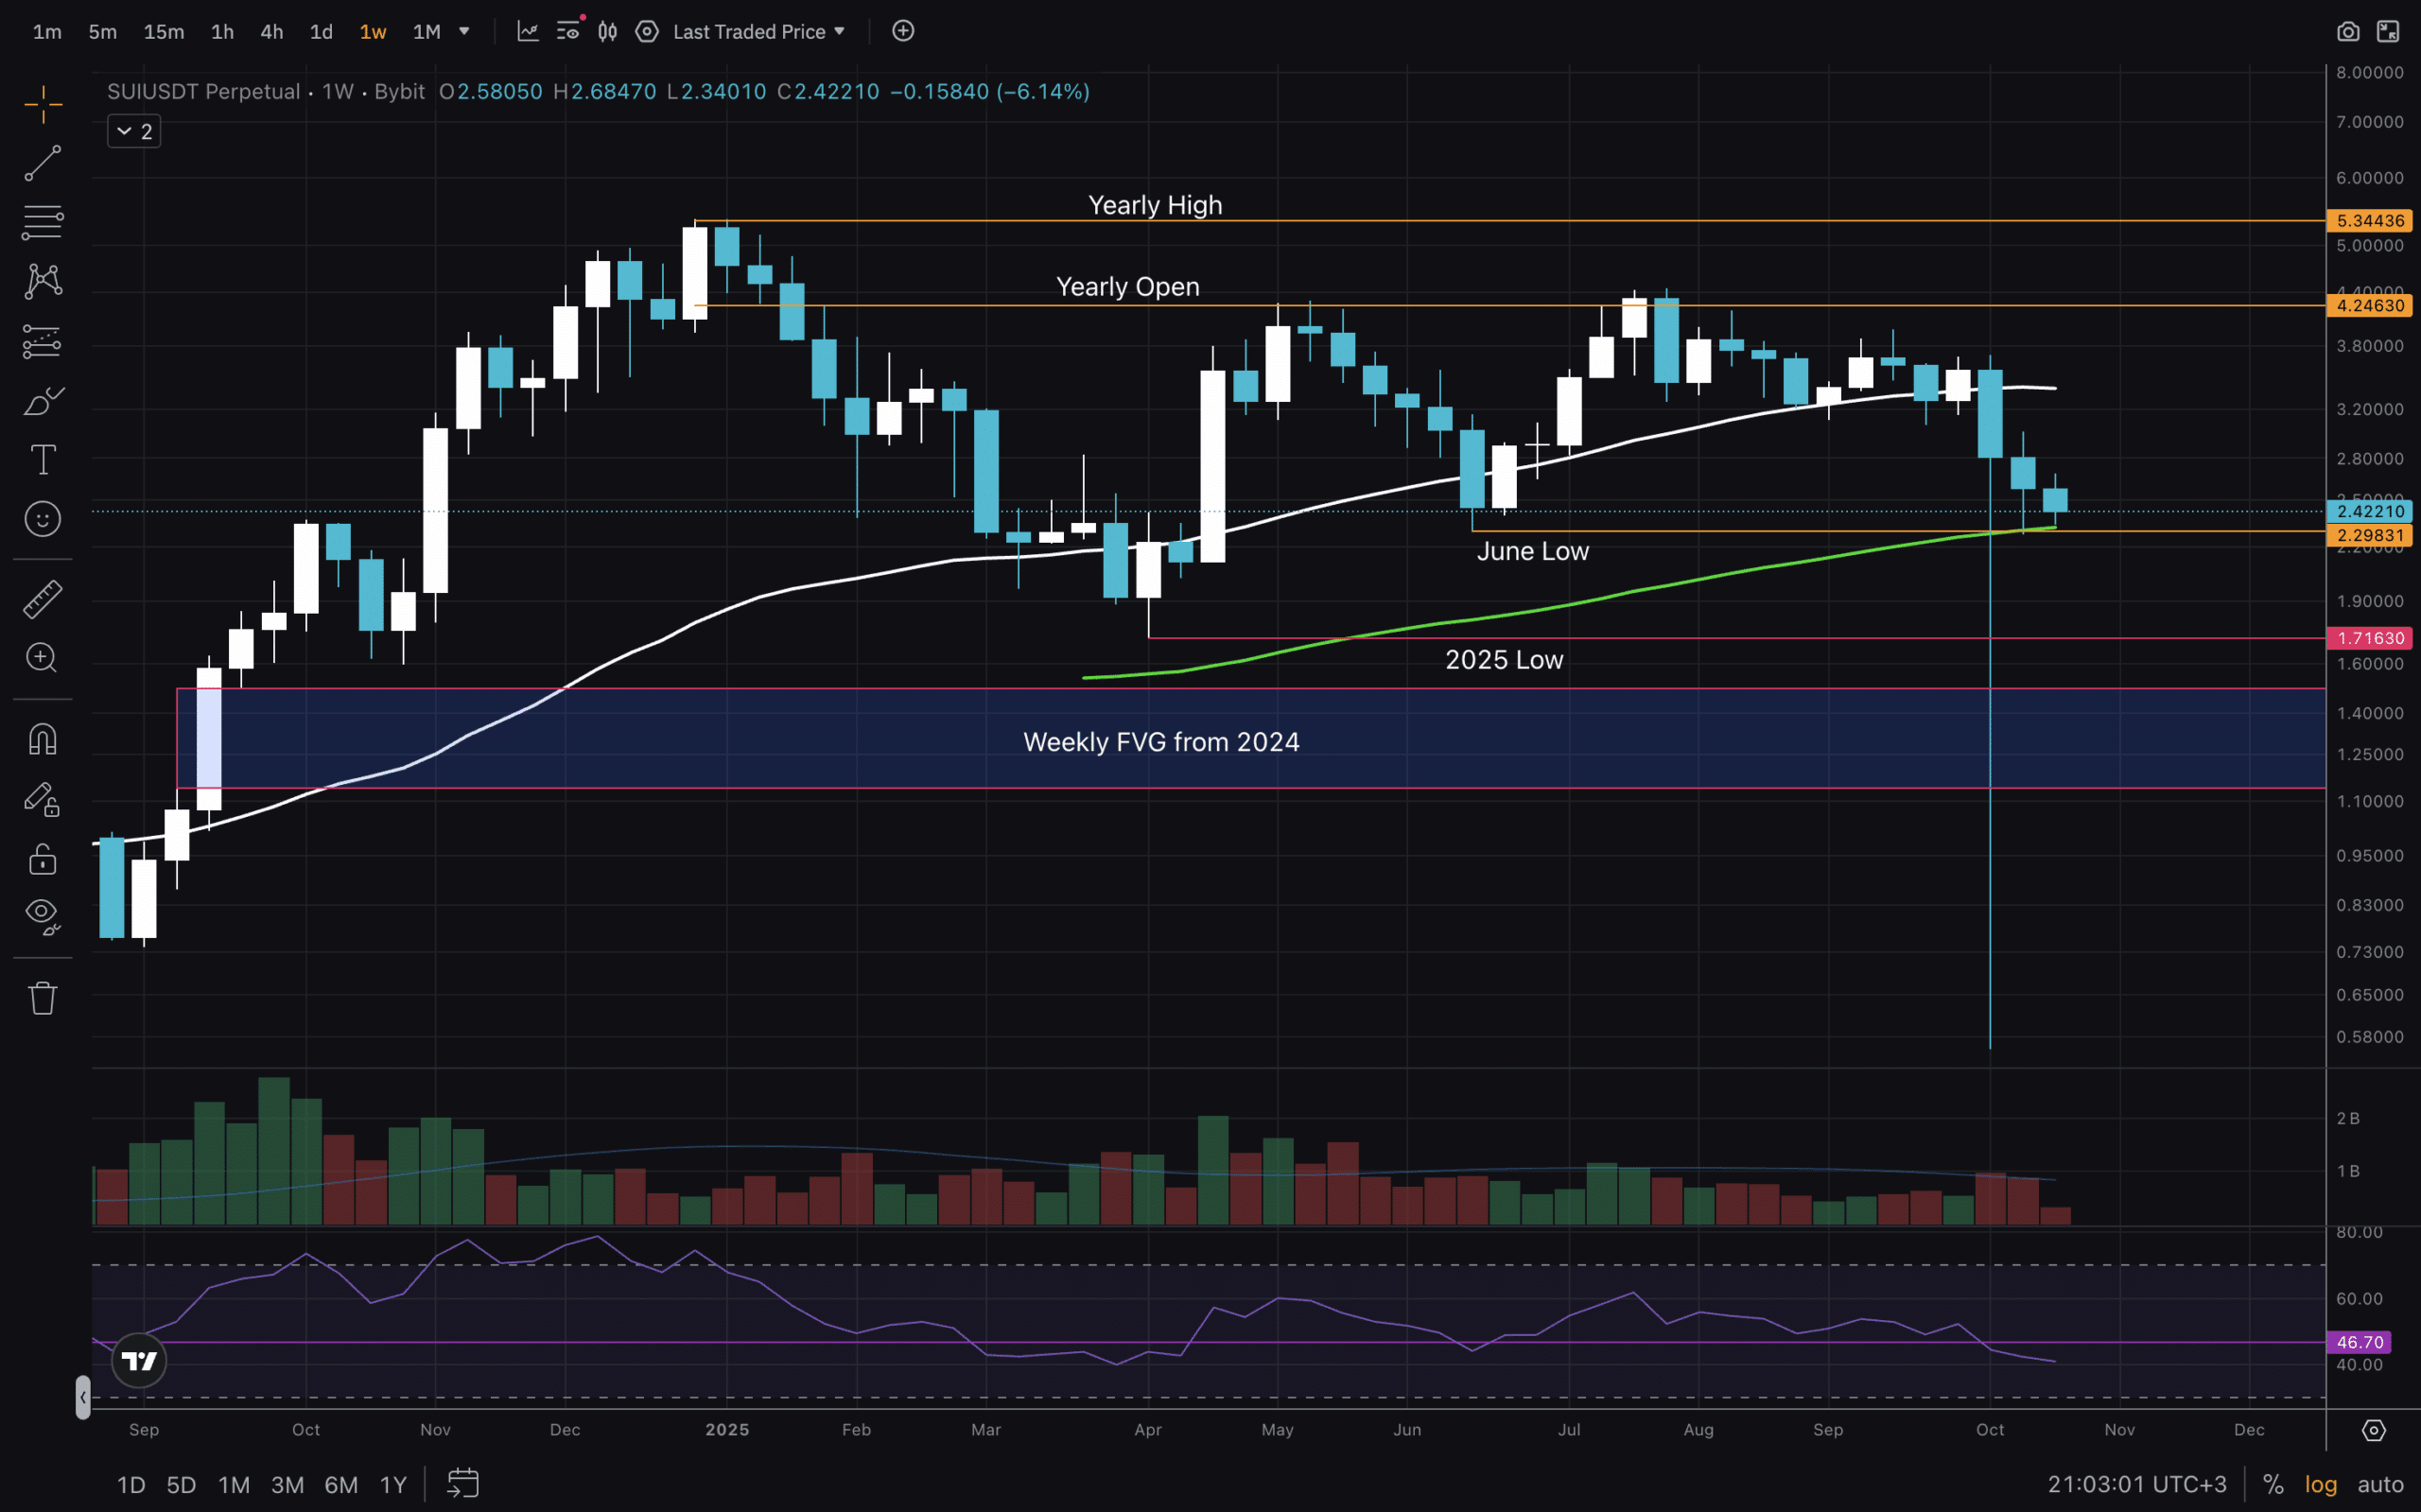
Let’s look at the charts, starting with the Weekly timeframe. We have the Weekly FVG from 2024, which, to say it got filled, is going to be a stretch. We should not count Black Swan events in these fills. Therefore, we can say it was not filled. And it likely won’t be, because sui USD first needs to break the support at the 2025 low, or $1.70. RSI has been in accumulation mode for the whole year so far, and we have yet to see it go into oversold like it did at the end of 2024. MA100 is currently acting as support.
(Source – Tradingview, SUIUSD)
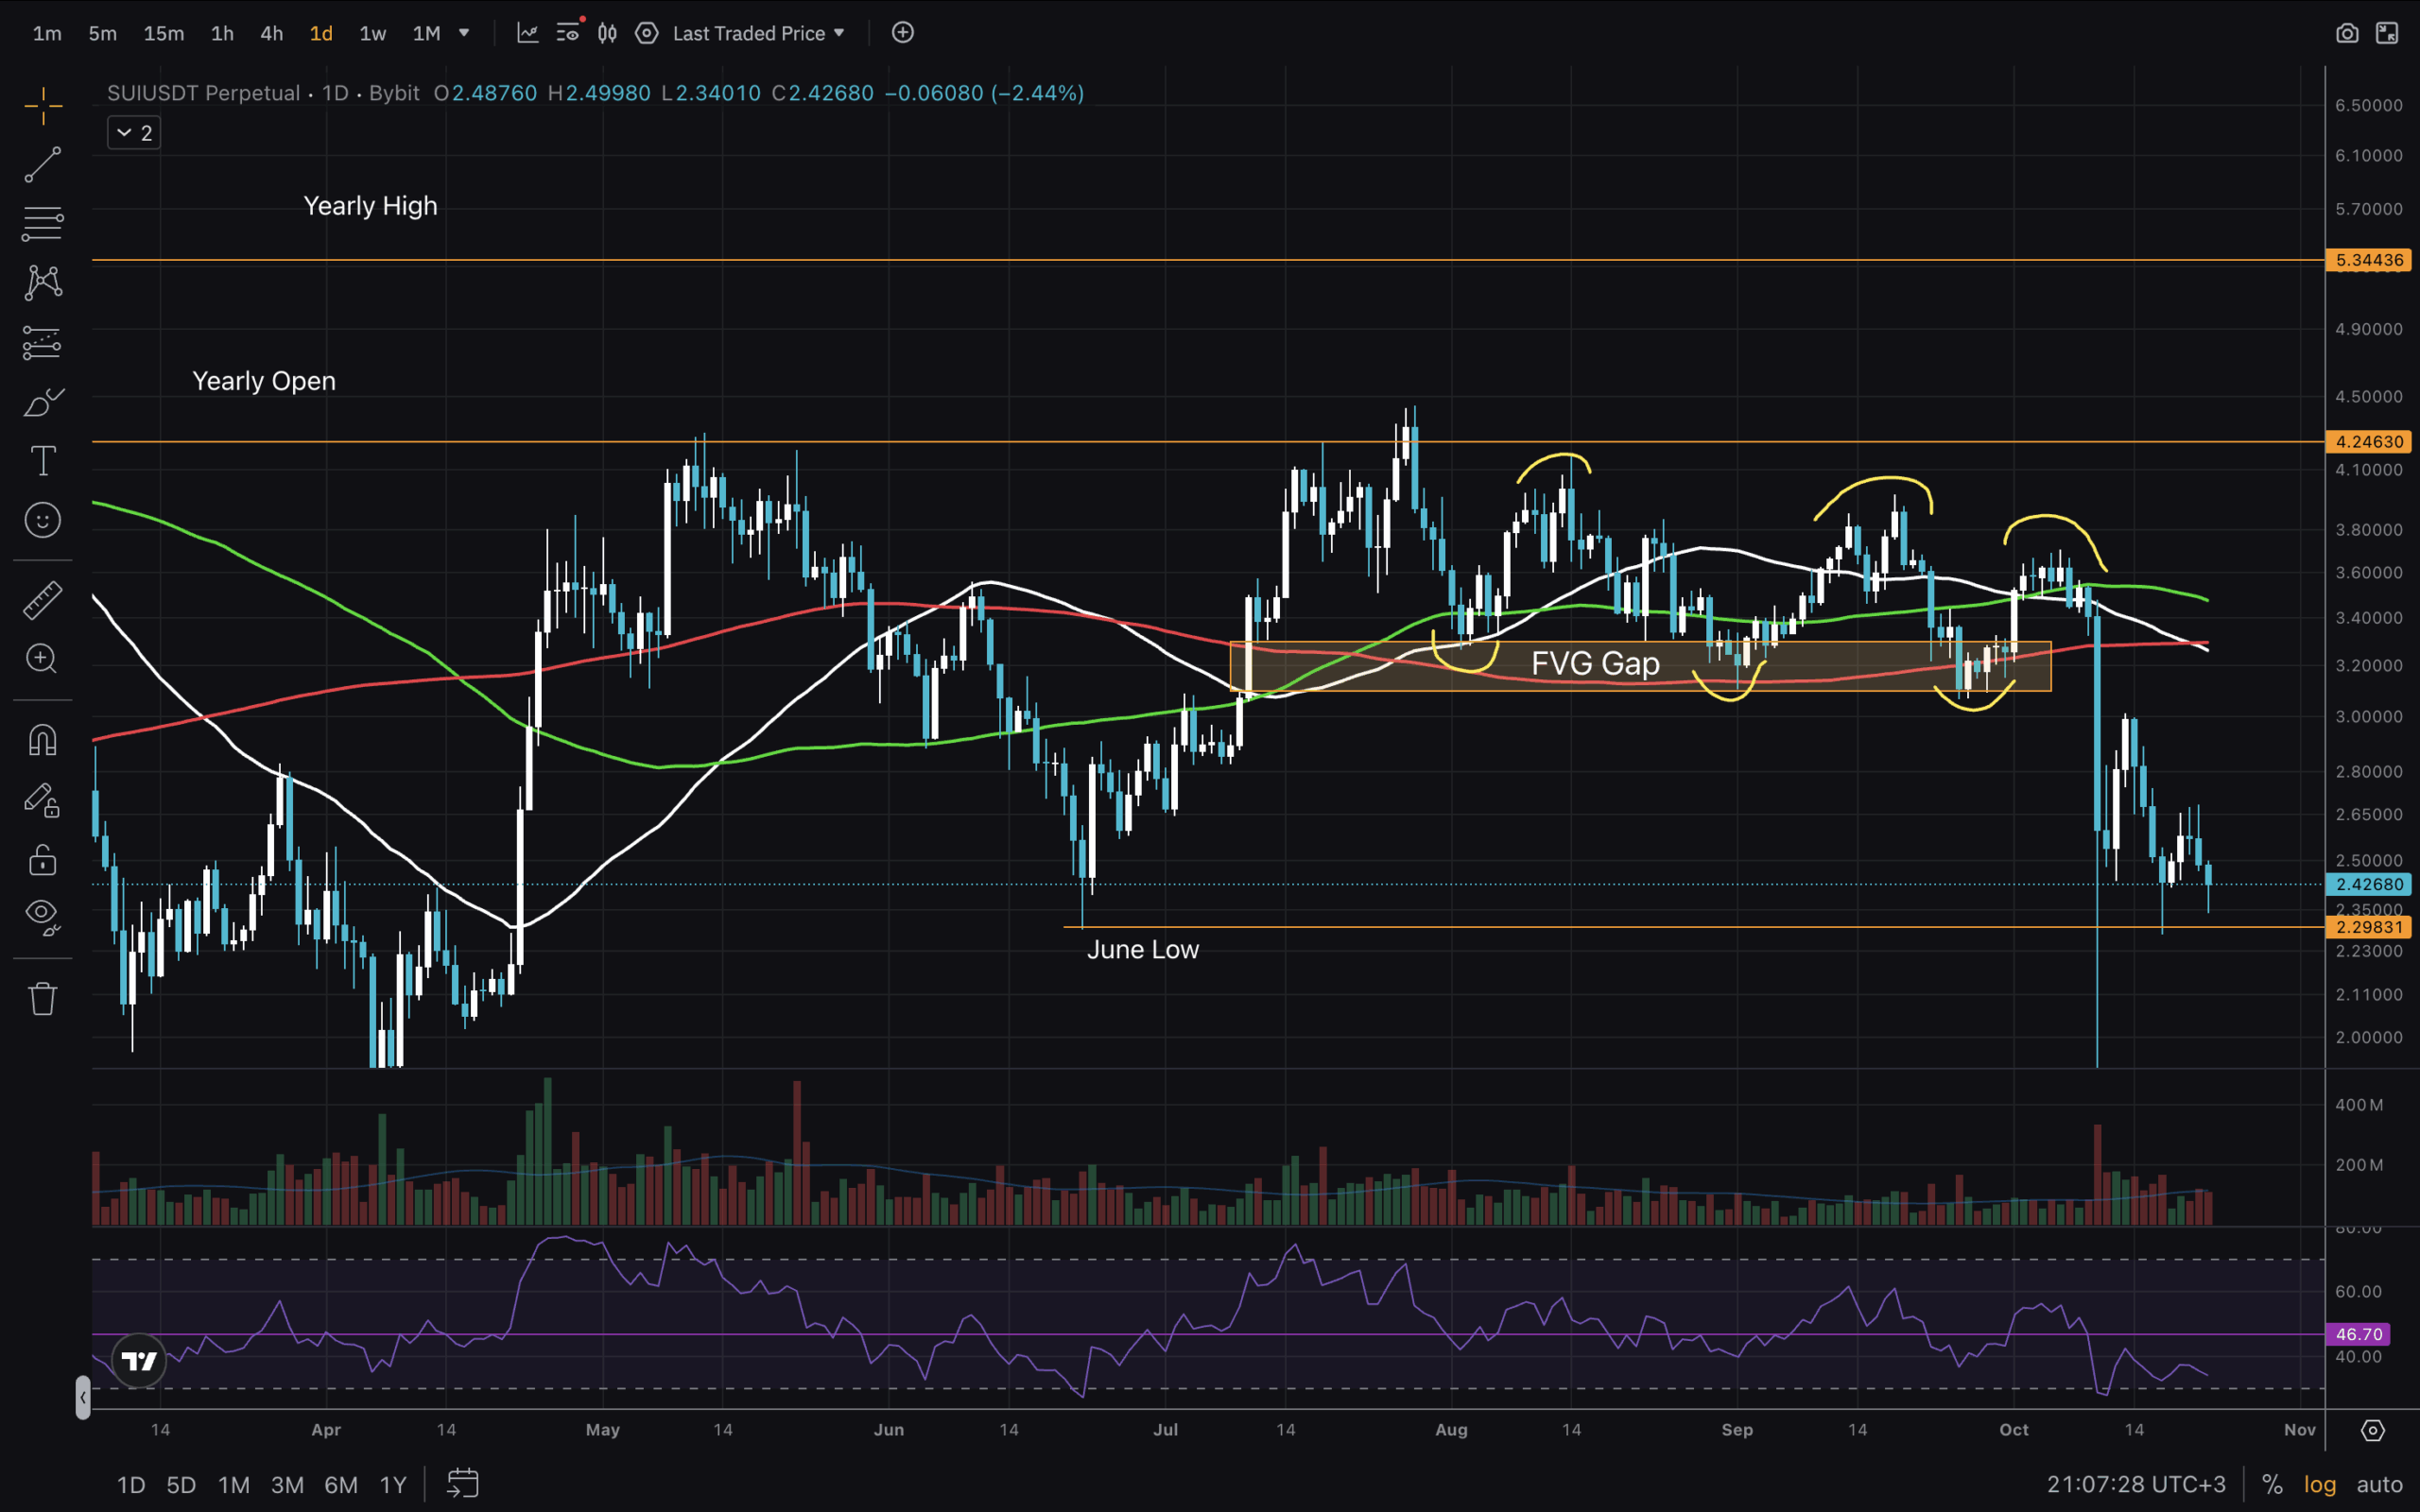
On the Daily, we have the FVG Gap, which acted as support three times, as price was actually making lower lows and lower highs. MA50 and then MA200 provided support in confluence with the gap, providing great long entries with good R:R. Once we saw price break below MA200 again, it took the elevator down before settling above the June Low. That $2.30 level is now acting as support, and bulls want it to hold. RSI is in the bottom half of its range; thus, we have plenty of space for price growth. MAs need to be reclaimed again!
Conclusions On The Low Timeframes
(Source – Tradingview, SUIUSD)
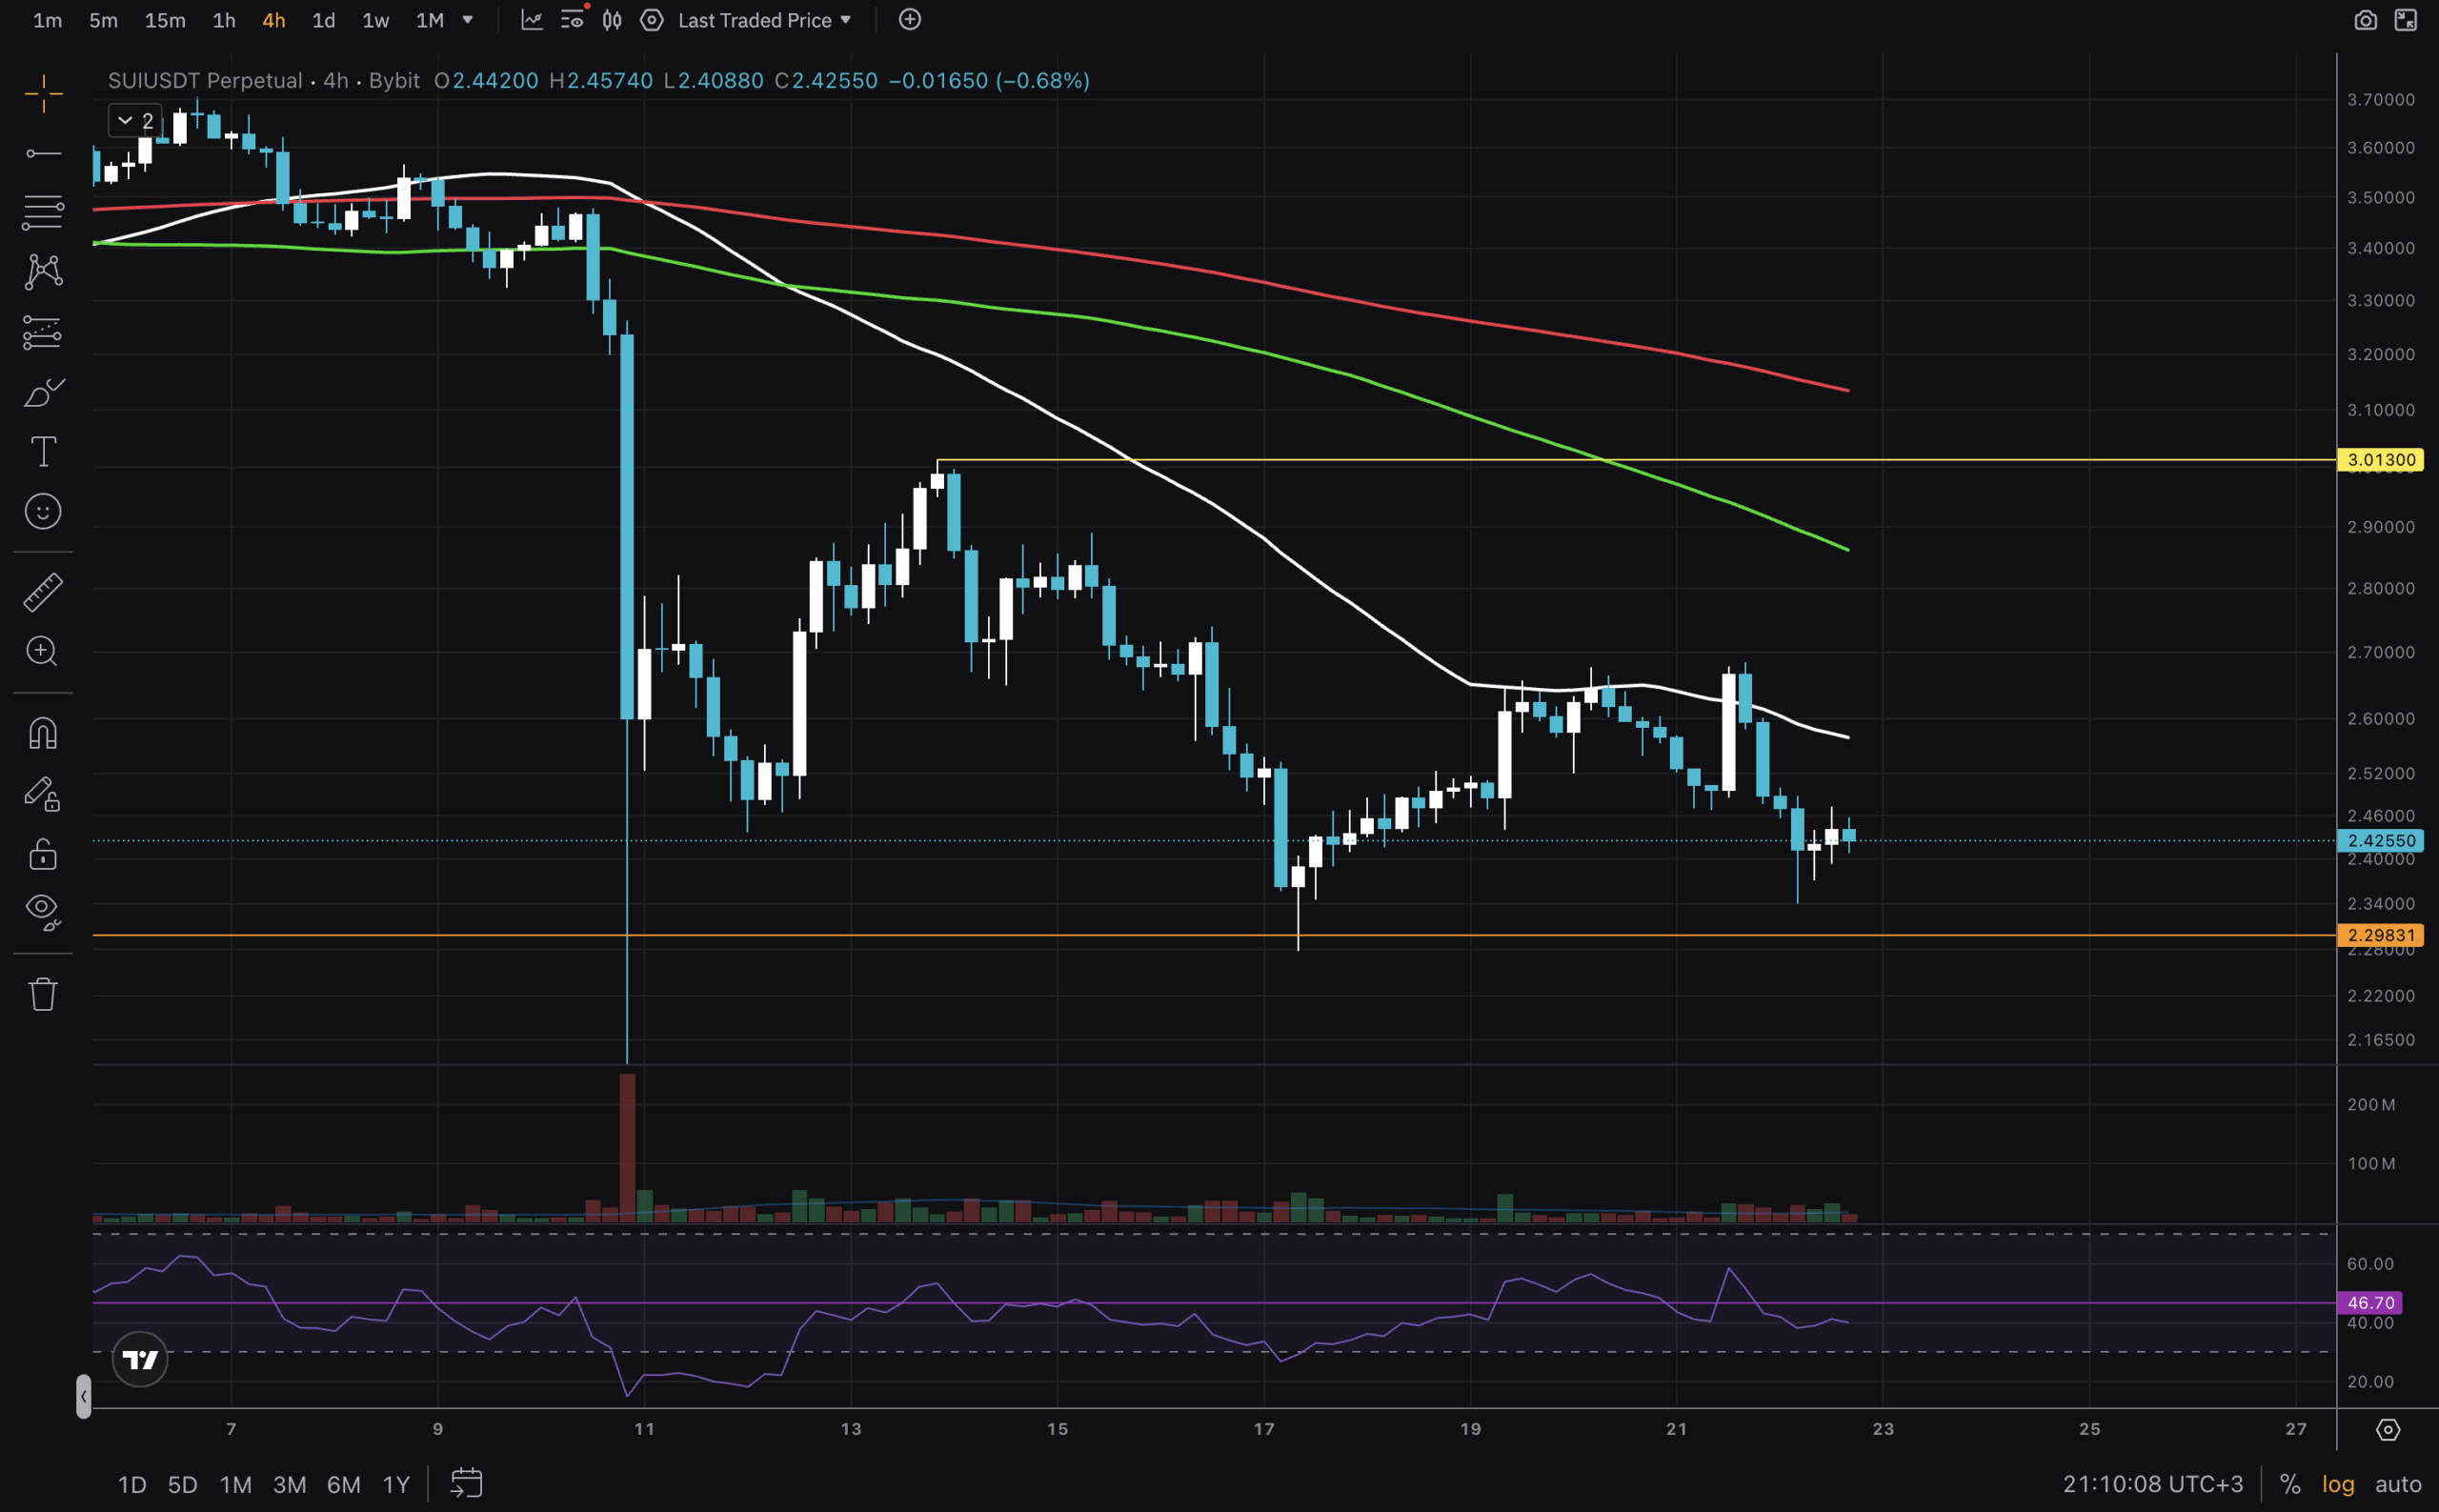
As we come to the end of today’s analysis, we look at our last chart – the 4H timeframe. Here, SUI USD is below all Moving Averages, still battling to reclaim the MA50. It can take days or even weeks until Sui gains enough strength to trade above the MAs. For us, what matters now is that RSI is growing, indicating buyers stepping in. With that, we see some Bullish Engulfing candles. Though what traders really care about is seeing that $3 level broken and reclaimed as support. Once that happens, then it is go time! Until then, we probably range between the orange and yellow lines.
Trade with good risk management and stay safe!
Join The 99Bitcoins News Discord Here For The Latest Market Update
SUI USD Going To Send Bulls To The Moon? Yes, No, Maybe.
- Sui price sees $2.30 as a comfy support so far.
- RSI on 1D and on 1W is low enough for another run up.
- LTF (4H) Range is between $2.30 – $3.00. We need to break and reclaim $3.00!
- Fundamentals remain strong, and MAs on Weekly are still in an uptrend.
