Ethereum Price Prediction for March: Is the Rally Just Beginning?
Ethereum Price Prediction: ETH price rallied above the $1,700 resistance zone. The price might correct lower and test the $1,650 support level before rising again.
- ETHstarted a significant increase above the $1,650 resistance zone.
- The price is standingabove $1,650 and the 100 hourly simple moving average.
- There is a major bullish trend line forming with support near $1,690 on the hourly chart of ETH/USD.
- The pair could correct lower, but dips might be limited below the $1,650 support.
Ethereum Price Eyes More Gains
Ethereum price started a major increase above the $1,600 resistance zone. ETH even cleared the key $1,700 resistance zone to move further into a positive zone, similar to bitcoin.
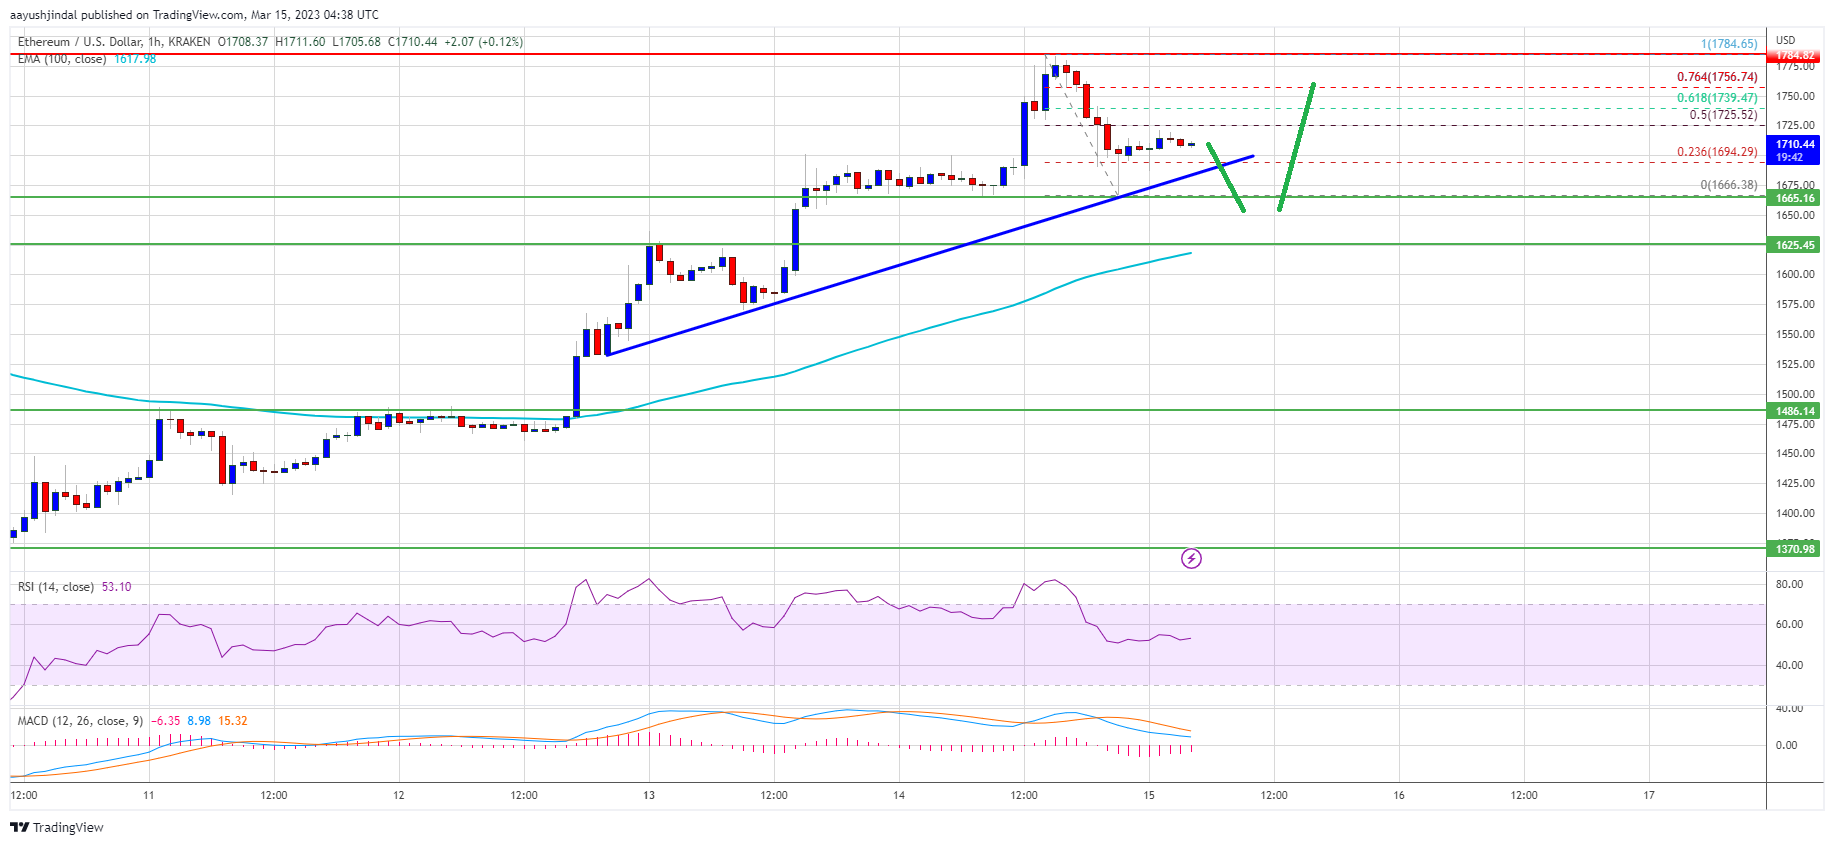
Finally, the price spiked above the $1,740 resistance and traded close to $1,800. A high was formed near $1,784 before there was a downside correction. There was a sharp decline below the $1,700 level. The price tested the $1,665 support zone and traded as low as $1,666.
Ether price is now trading above $1,650 and the 100 hourly simple moving average. There is also a major bullish trend line forming with support near $1,690 on the hourly chart of ETH/USD.
On the upside, the price is facing resistance near the $1,725 zone. It is near the 50% Fib retracement level of the recent decline from the $1,784 swing high to $1,666 low. The first major resistance is near the $1,740 and $1,750 levels.
The 76.4% Fib retracement level of the recent decline from the $1,784 swing high to $1,666 low is also near $1,750. The next major resistance is near the $1,800 level. A close above the $1,800 resistance zone might start another major increase.
In this case, the price may perhaps rise towards the $1,880 resistance level. Any more gains might send the price towards $2,000.
Ethereum Price Prediction: Dips Supported in Ethereum?
If ETH fails to clear the $1,740 resistance, it could start another decline. An initial support on the downside is near the $1,690 level and the trend line.
The next major support is around $1,650. If it falls below $1,650, the price could fall towards $1,600. Any more losses could call for a test of the $1,550 level.
Technical Indicators
Major Support Level – $1,650
Major Resistance Level – $1,740
Read More:
Will Pi Network Ever Launch? What Stage is Pi Network Now?
Is Pi Network Legit Or Scam: Pi Cryptocurrency Real Or Fake?
Pi Network Launch Date: When Will Pi Coin Enter The Market?
Pi Coin Price Prediction: Will Pi Ever Be Worth Money?
Luna Classic Price Prediction: Will Luna Classic Reach $1?
XRP Price Prediction $500: Can XRP Reach $500 Dollars?
HBAR Price Prediction 2025, 2030
Ethereum Price Prediction 2025-2030
Blur Price Prediction 2023, 2025, 2030
Sandbox Price Prediction 2025, 2030
Will Shibarium Burn Remove 111 Trillion SHIB Annually?
Wild Cash App by Hooked Protocol: Answer Quiz to Earn $HOOK
ChargePoint Stock Forecast for 2023, 2025, 2030
Sofi Stock Price Prediction for 2023, 2025, 2030
Gasoline Price Prediction 2023-2030: What Will It Be in Five Years?
ADA Cardano Price Prediction 2025, 2030
Hooked Protocol Price Prediction 2023, 2025, 2030
Related articles
- Ethereum (ETH) Price Prediction 2024, 2025, 2030: How High Can ETH Go in 2024?
 Price Prediction 2024, 2025, 2030: How High Can ETH Go in 2024?")
- Ethereum Price Prediction: Can ETH Rally Back to $1800?

- Ethereum Price Predictions: Can ETH Reach New Heights with a Bitcoin ETF?

- A Million Wallets Receive the New Solana Meme Coin “WEN” via Airdrop

- Best Cryptos to Buy Amid Higher Likelihood of Spot ETH ETF Approvals – Pepe, Arbitrum, Uniswap

- Ethereum Price Prediction – What’s Next for ETH as SEC Approves Ethereum ETFs


Quick Links
Risk warning: Digital asset trading is an emerging industry with bright prospects, but it also comes with huge risks as it is a new market. The risk is especially high in leveraged trading since leverage magnifies profits and amplifies risks at the same time. Please make sure you have a thorough understanding of the industry, the leveraged trading models, and the rules of trading before opening a position. Additionally, we strongly recommend that you identify your risk tolerance and only accept the risks you are willing to take. All trading involves risks, so you must be cautious when entering the market.
The world’s longest-running cryptocurrency exchange since 2011 © 2011-2025 BTCC.com. All rights reserved