


Glassnode: Bitcoin Rally Stalls at Resistance; Can Weakening Sell Pressure Drive a Breakout?
 chaincatcher
Author: Glassnode
Compiled by: Jiahua, ChainCatcher
Key Takeaways
Bitcoin has rallied to the edge of a resistance zone, with cost-basis data, liquidation charts, and institutional breakeven lines all pointing to the same resistance level. Yet as price approaches this zone, sell pressure is at its lowest level this year. Realized inflation data is at a two-year low, while yields are at cycle highs. From a macro perspective, the case against rate hikes is clearly stronger than the case for them.
- Bitcoin rose 23% over the past 21 trading days, while equities were roughly flat over the same period, though Bitcoin remains down 10% year-to-date.
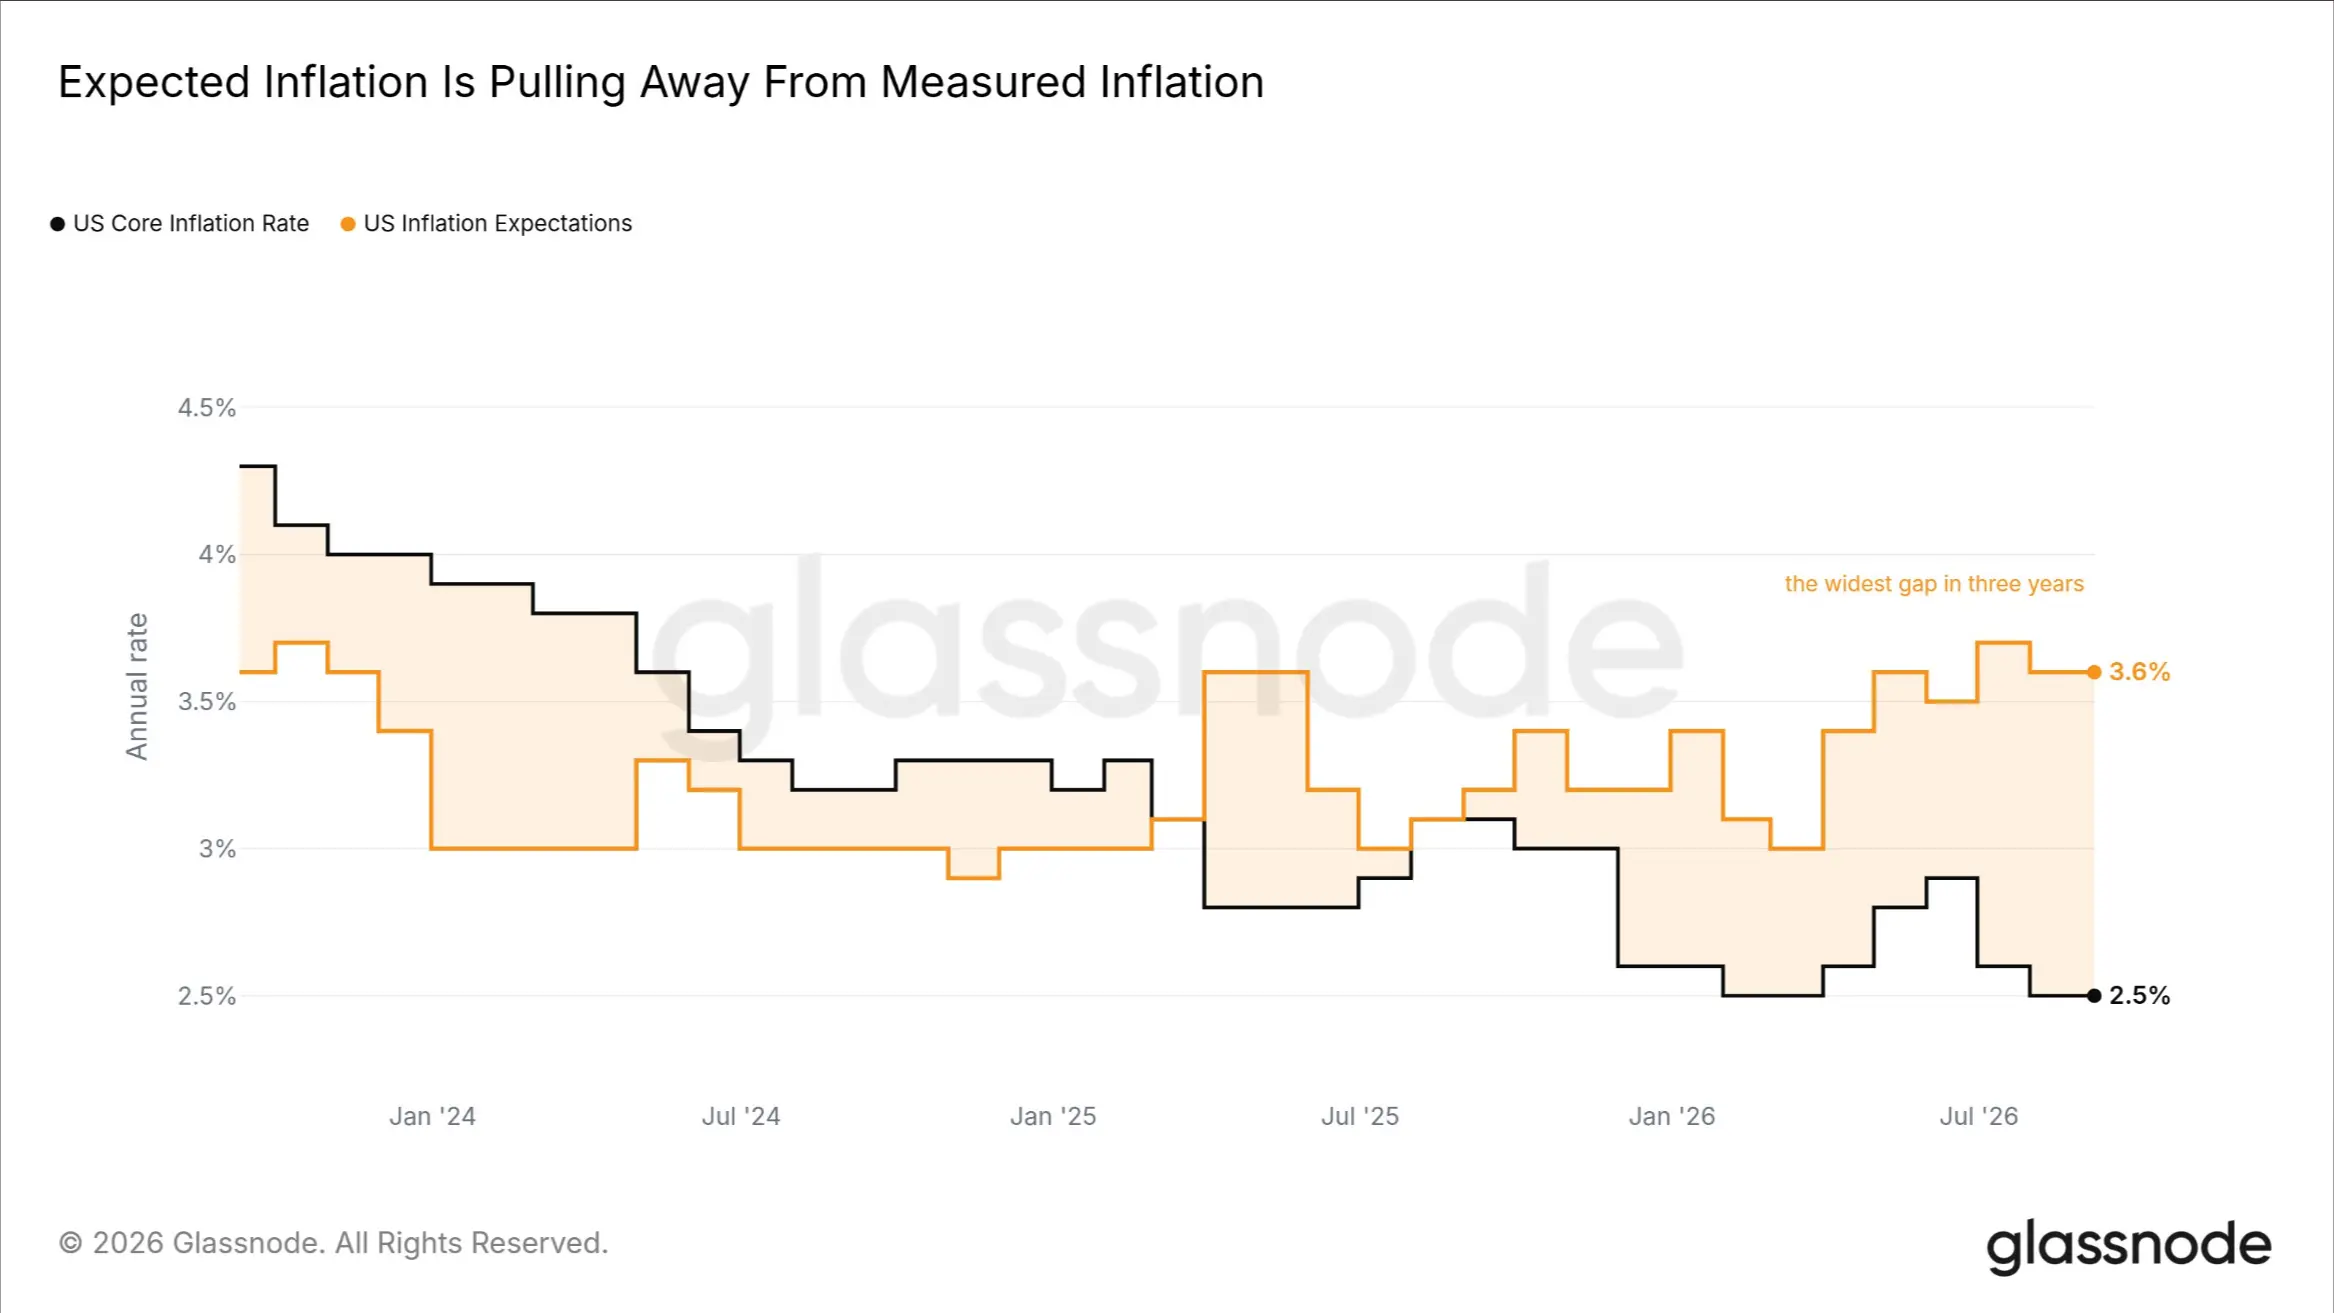
- Core inflation has fallen to a two-year low of 2.5%, while inflation expectations remain at 3.6%, the widest gap in three years.
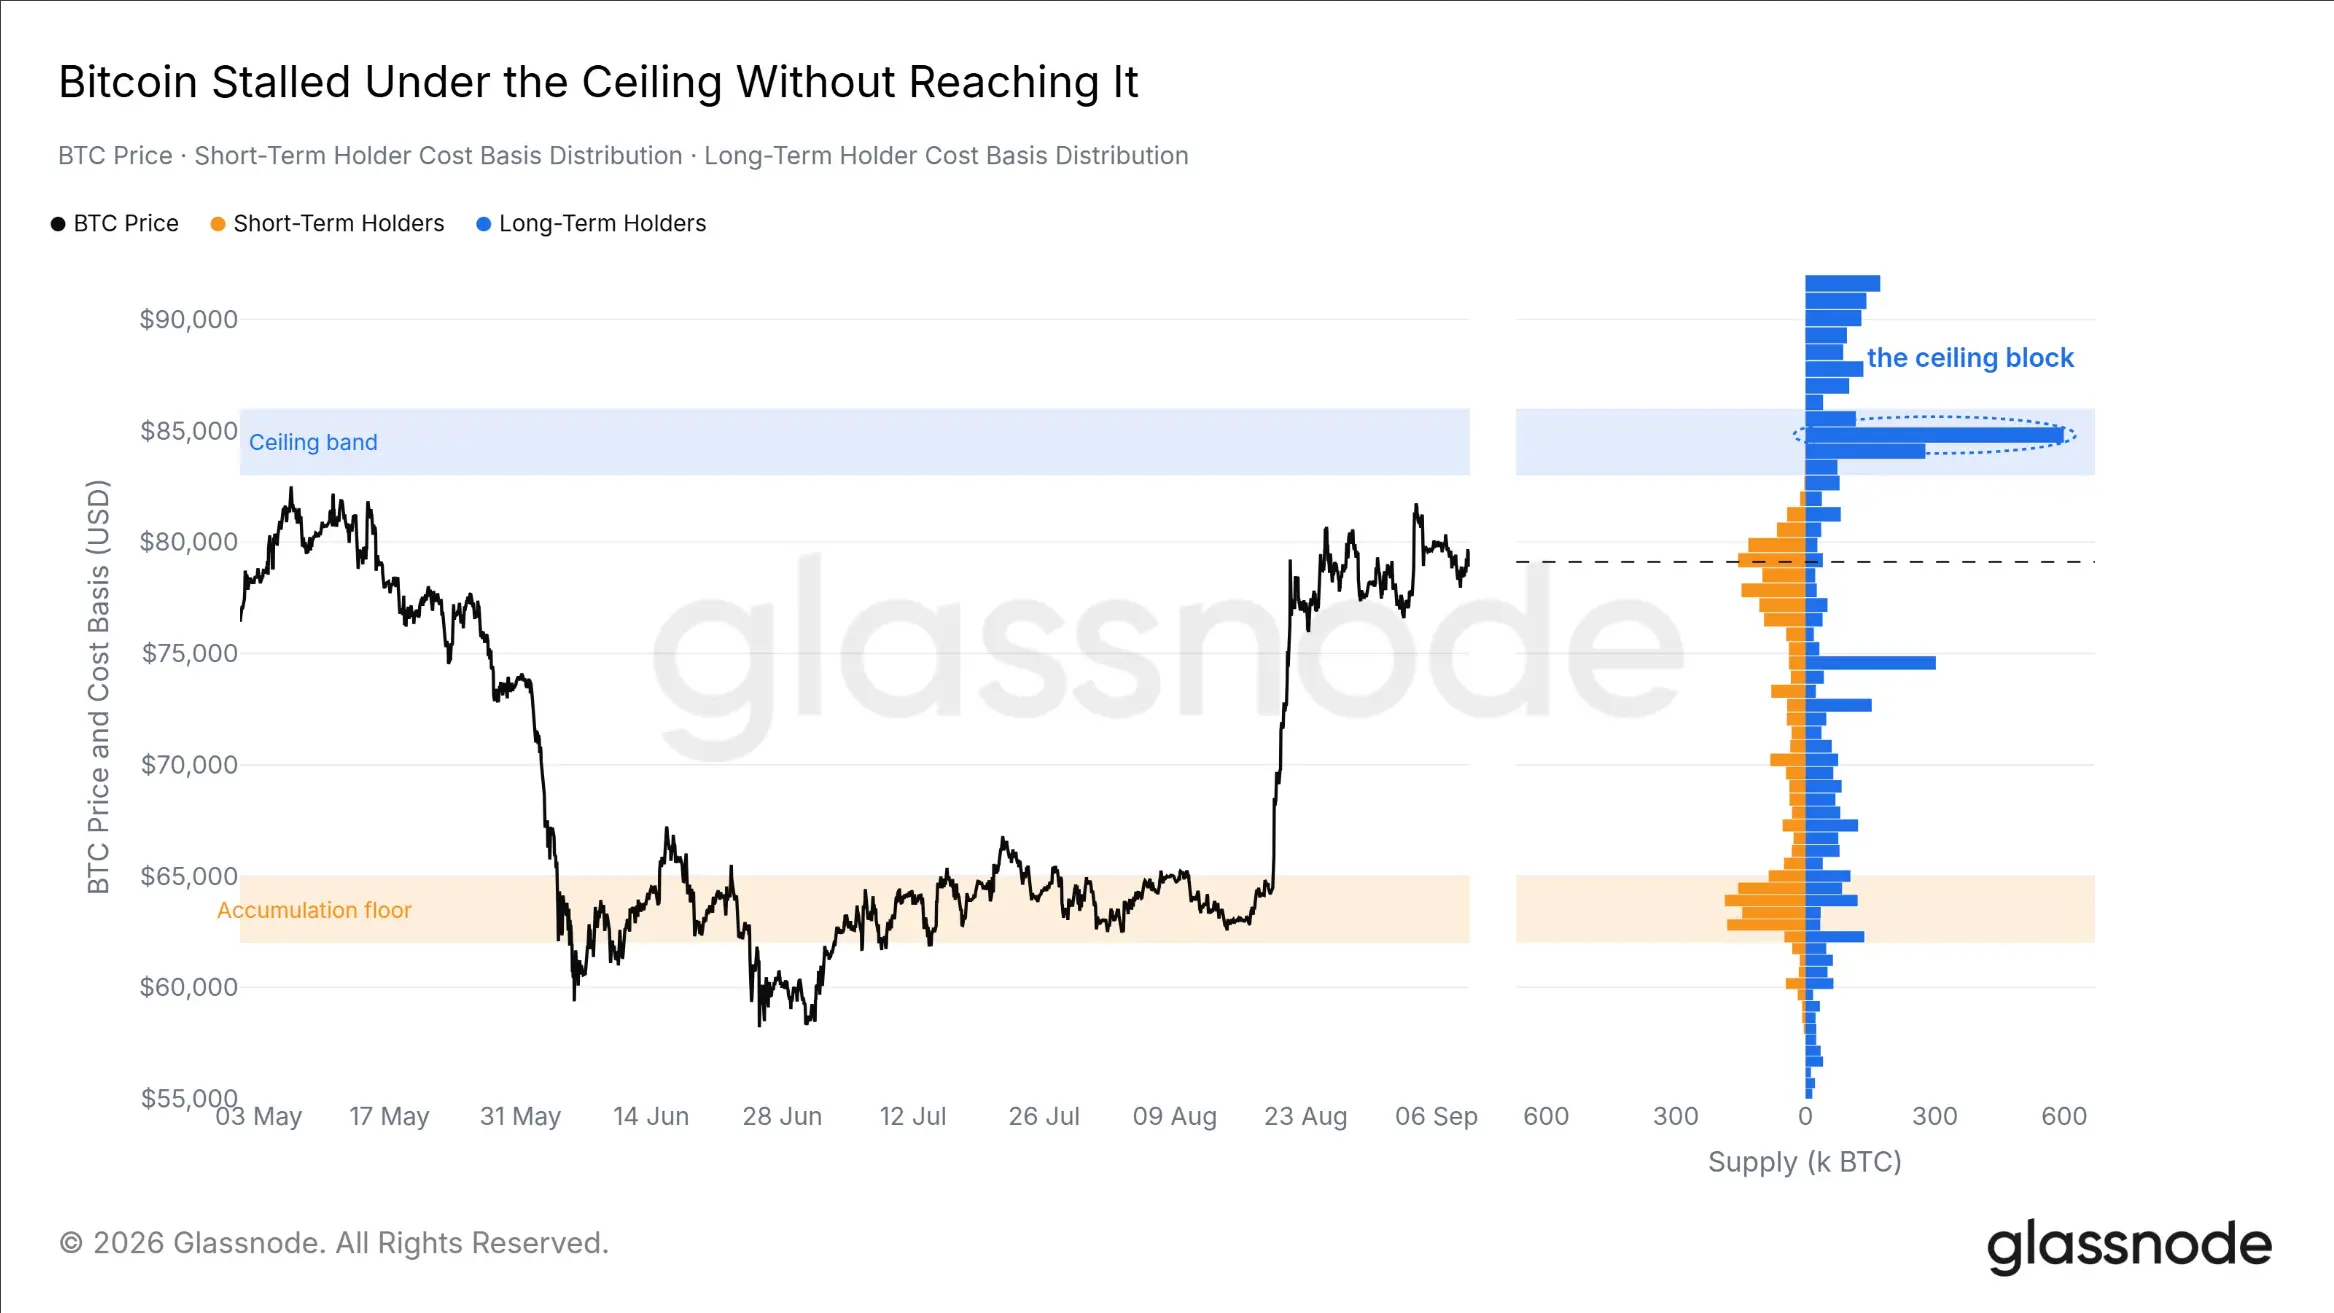
- Long-term holder cost basis, liquidation distribution, and ETF breakeven lines all point to resistance between $83,000 and $86,000; spot price came within 1.5% of the lower bound of this zone.
- As Bitcoin approaches the upper range, selling velocity is less than half of August's peak, and long-term holders have not participated in selling during this rally.
- Bottom indicators have formed a clear confluence for months and have largely exited the extreme weakness zone; altcoins are not taking market share from Bitcoin as they did before previous cycle tops.
Bitcoin, Lagging Year-to-Date, Is Catching Up from the Bottom
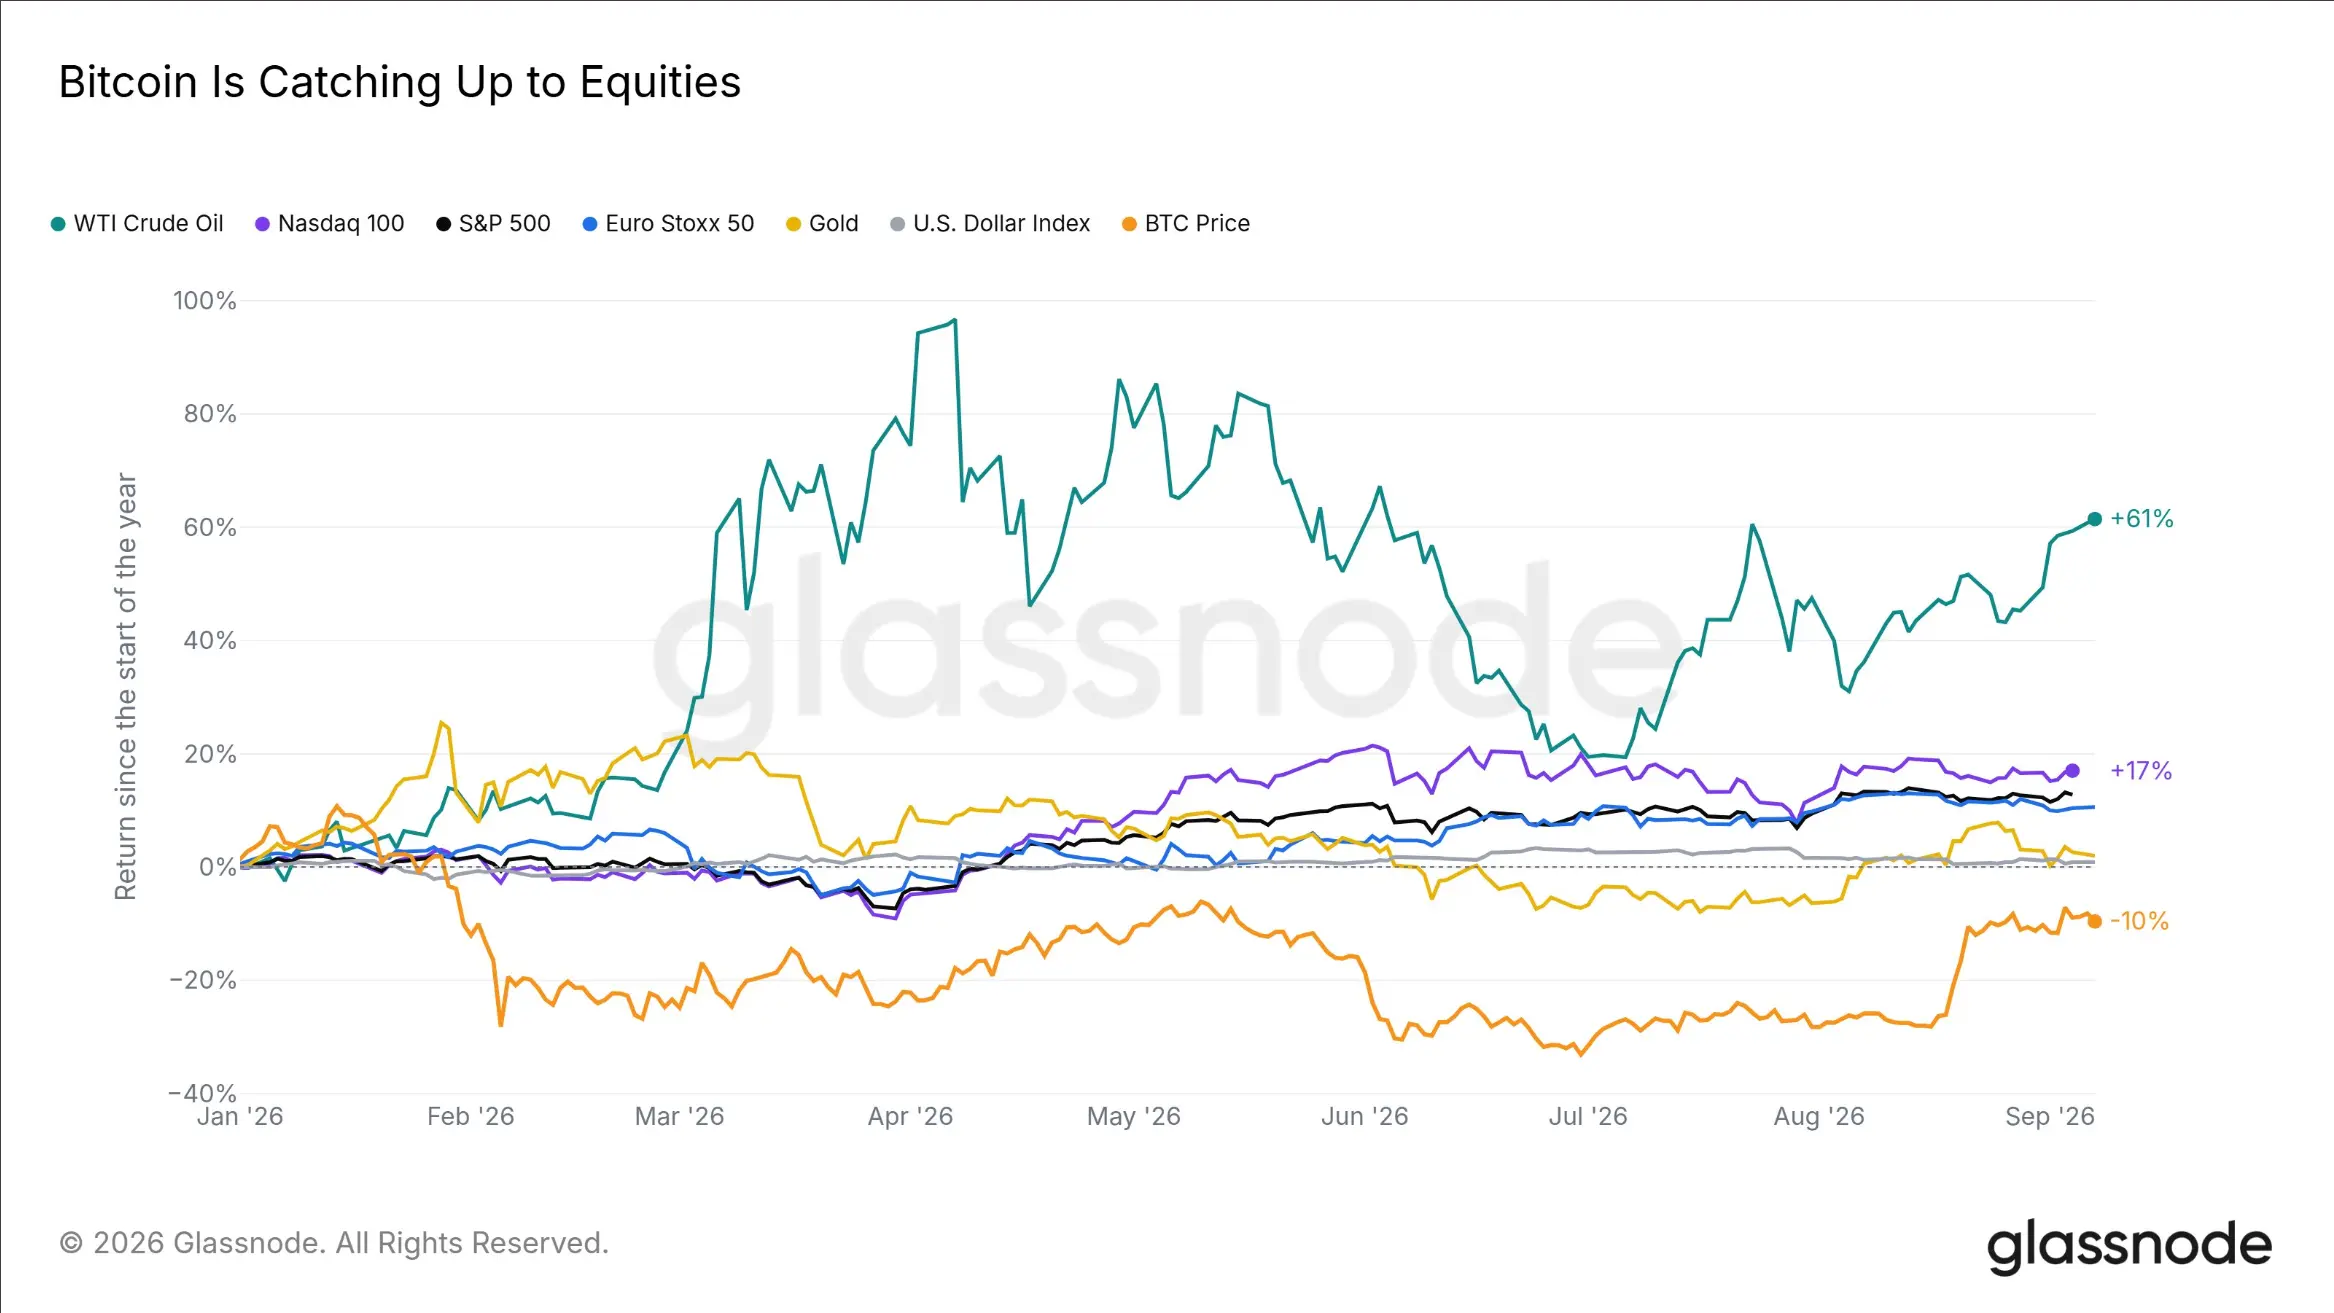
Over the past 21 trading days, Bitcoin rose 23%, while the S&P 500 and Nasdaq 100 were roughly flat, and the Euro Stoxx 50 declined slightly. Among the seven asset classes we track, Bitcoin was the best performer during this period.
However, the year-to-date picture is the opposite. Bitcoin is still down 10% from the start of the year, while the S&P 500 is up 13%, and crude oil, the best performer this year, is far ahead of both.
Bitcoin spent the entire summer at the bottom of this performance ranking and only recently began to narrow the gap with other assets. The strong performance over the past month has only repaired part of the first-half decline.
Market Expectations Outpace the Data
This Bitcoin rally occurred amid a generally tight bond market. The 10-year U.S. Treasury yield closed at 4.8%, matching a two-year high; the 2-year yield was around 4.38%, about 63 basis points above the 3.75% federal funds target rate. The bond market is betting that monetary policy may tighten further.
However, actual inflation data does not support this view.
U.S. core inflation has fallen to 2.5%, a two-year low, while U.S. inflation expectations remain at 3.6%. The gap between the two has reached a three-year high.
With core inflation continuing to cool and Treasury yields at cycle highs, the Federal Reserve is finding it increasingly difficult to justify rate hikes. The August CPI data, due on September 11, 2026, and the FOMC rate decision on September 16 will directly test this contradiction.
If core inflation moves toward the 3.6% inflation expectation, the case for tightening will strengthen; if core inflation remains at current lows, it suggests that the rise in bond yields may have gotten ahead of economic data.
Multiple Angles Point to the Same Resistance Zone; Price Stalls Below It
Last week's report set the overhead resistance zone for Bitcoin between $83,000 and $86,000. This rally tested that assessment but did not actually reach the zone.
On September 3, 2026, Bitcoin spot price made a new high above August's high but ultimately stalled 1.5% below the lower bound of the resistance zone, then traded in a narrow range below $80,000.
The distribution of long-term holder cost basis explains why this resistance zone matters.
Approximately 1.07 million BTC have a cost basis between $83,000 and $86,000, the vast majority of which belongs to long-term holders, with the densest cost concentration around $85,000. This supply has barely moved over the past 30 days.
What has changed is the supply structure below. Supply between $76,000 and $82,000 is mainly held by recent buyers and continues to grow; accumulated supply in the $62,000 to $65,000 range has decreased, indicating that some BTC bought at those levels has been moved.
The market has rebuilt support below spot price, but the overhead resistance zone has not yet been absorbed.
Liquidation Distribution Also Points to the Same Resistance Zone
The derivatives market provides a similar answer.
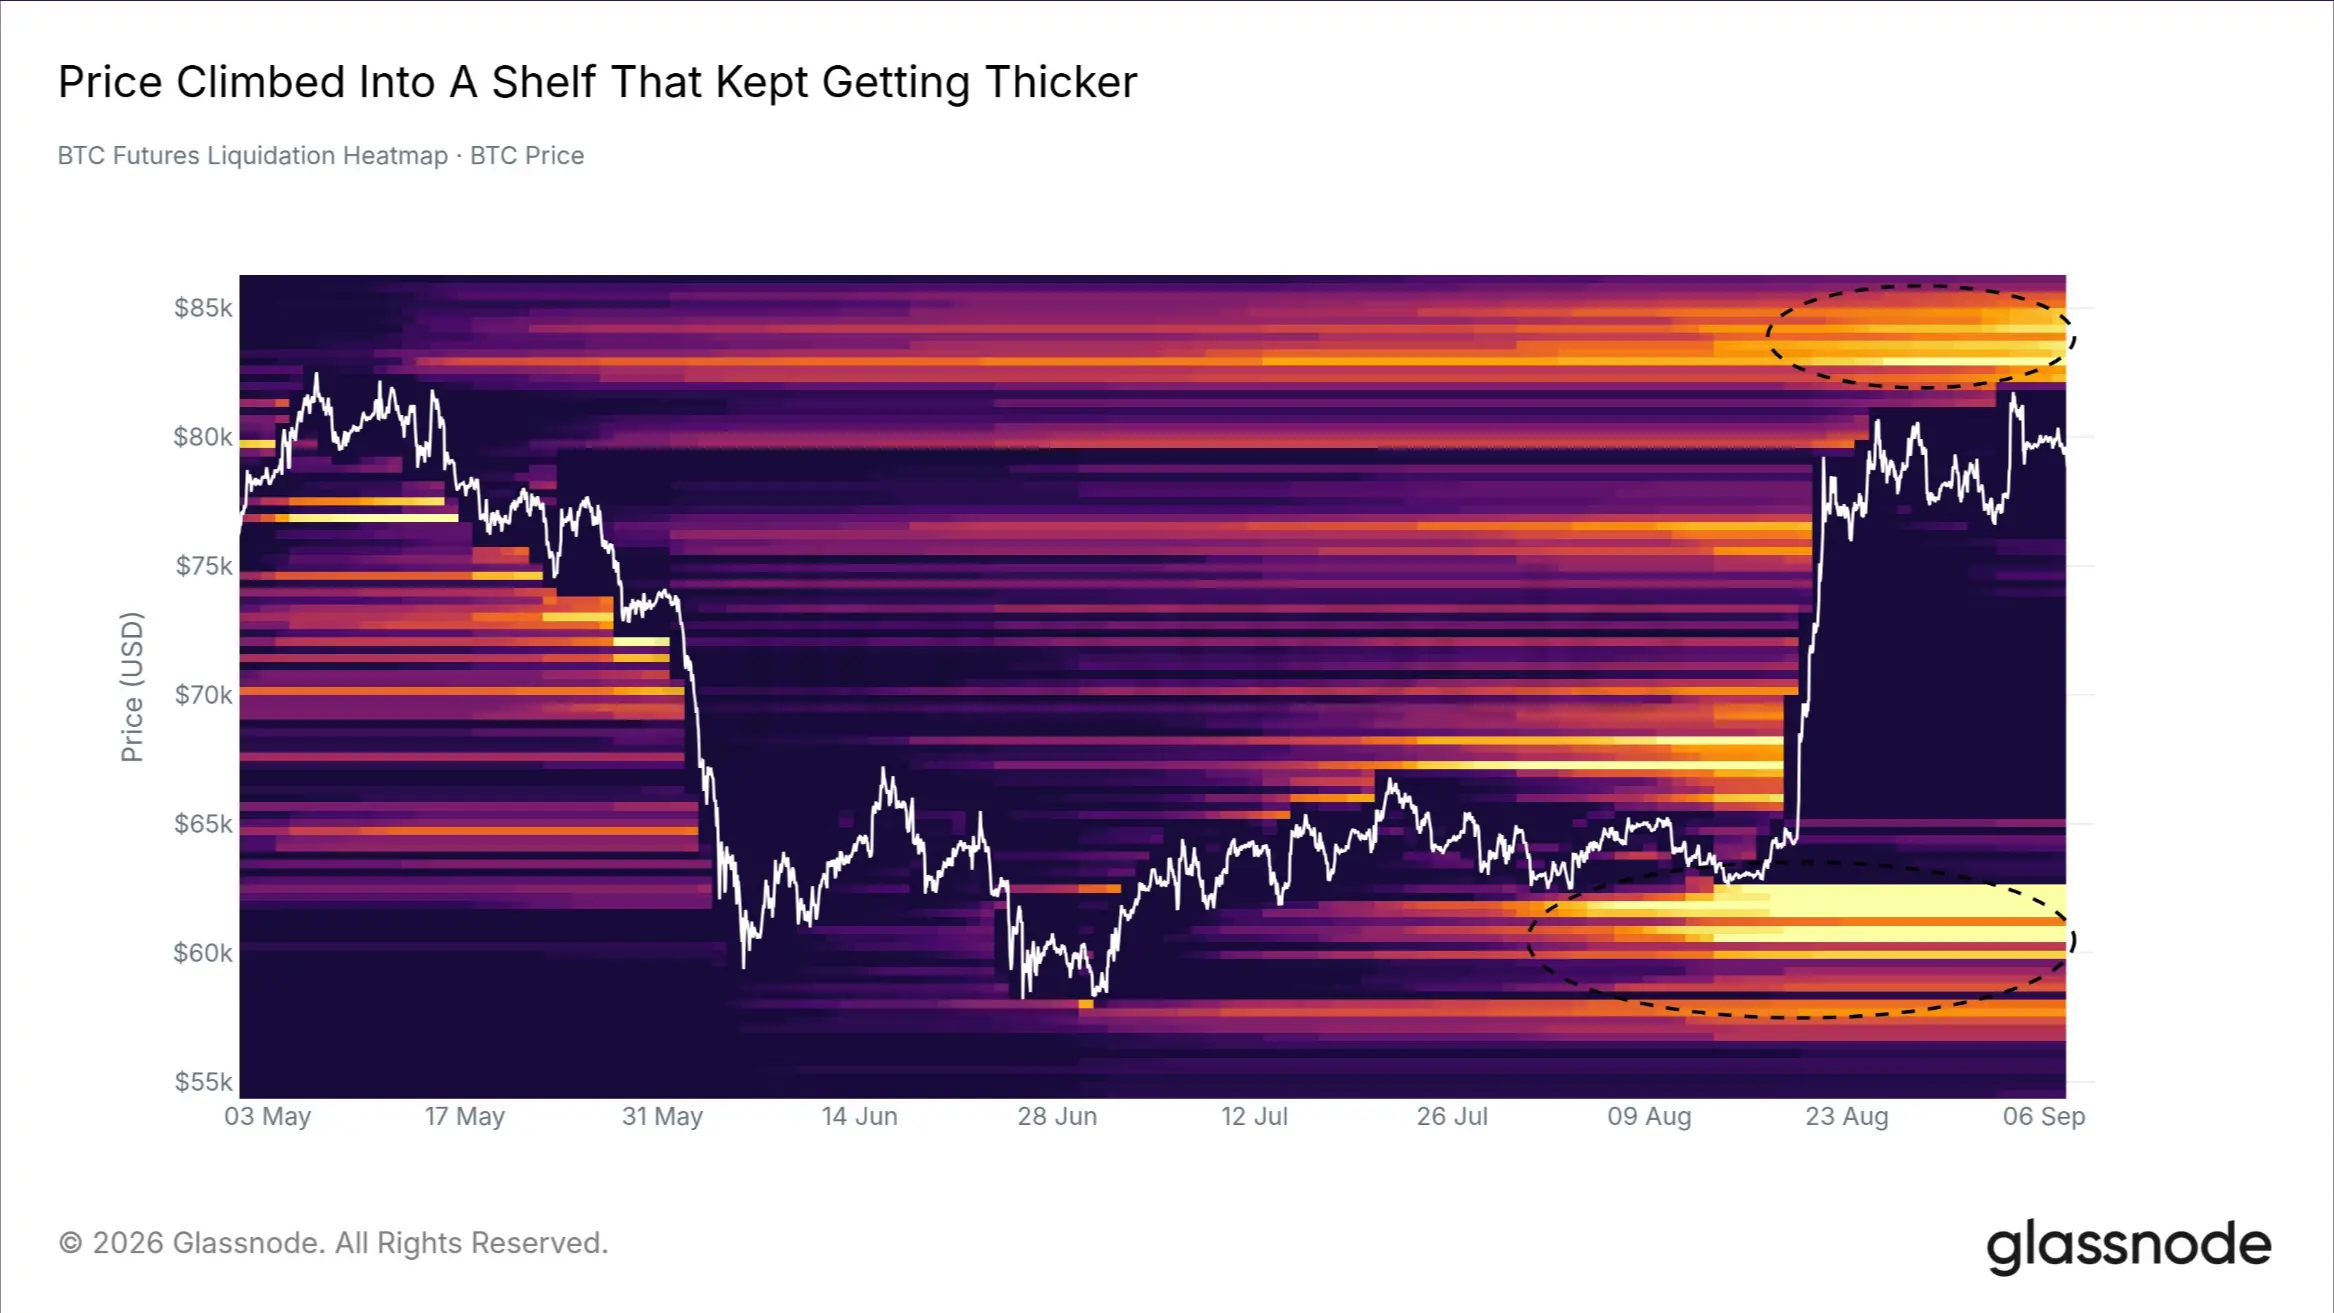
From the Bitcoin futures liquidation heatmap, the short liquidation zone between $82,000 and $86,000 has expanded by 21% since the August 19 short squeeze; meanwhile, the overall size of the liquidation map has shrunk by about one-third.
Currently, the $82,000 to $86,000 range has concentrated one of the largest liquidation volumes since this model began recording.
As price rose, it entered the expanding short liquidation zone and ultimately stalled below it. Below the current price, a long liquidation zone remains between $60,000 and $63,000, continuing to define the market range from below.
If price breaks sustainably above $86,000, it will trigger the densest short liquidation liquidity in the market; if it falls below $63,000, it could begin to hit long positions below.
Institutional Breakeven Lines Also Approach $86,000
A third independent indicator points to the same location.
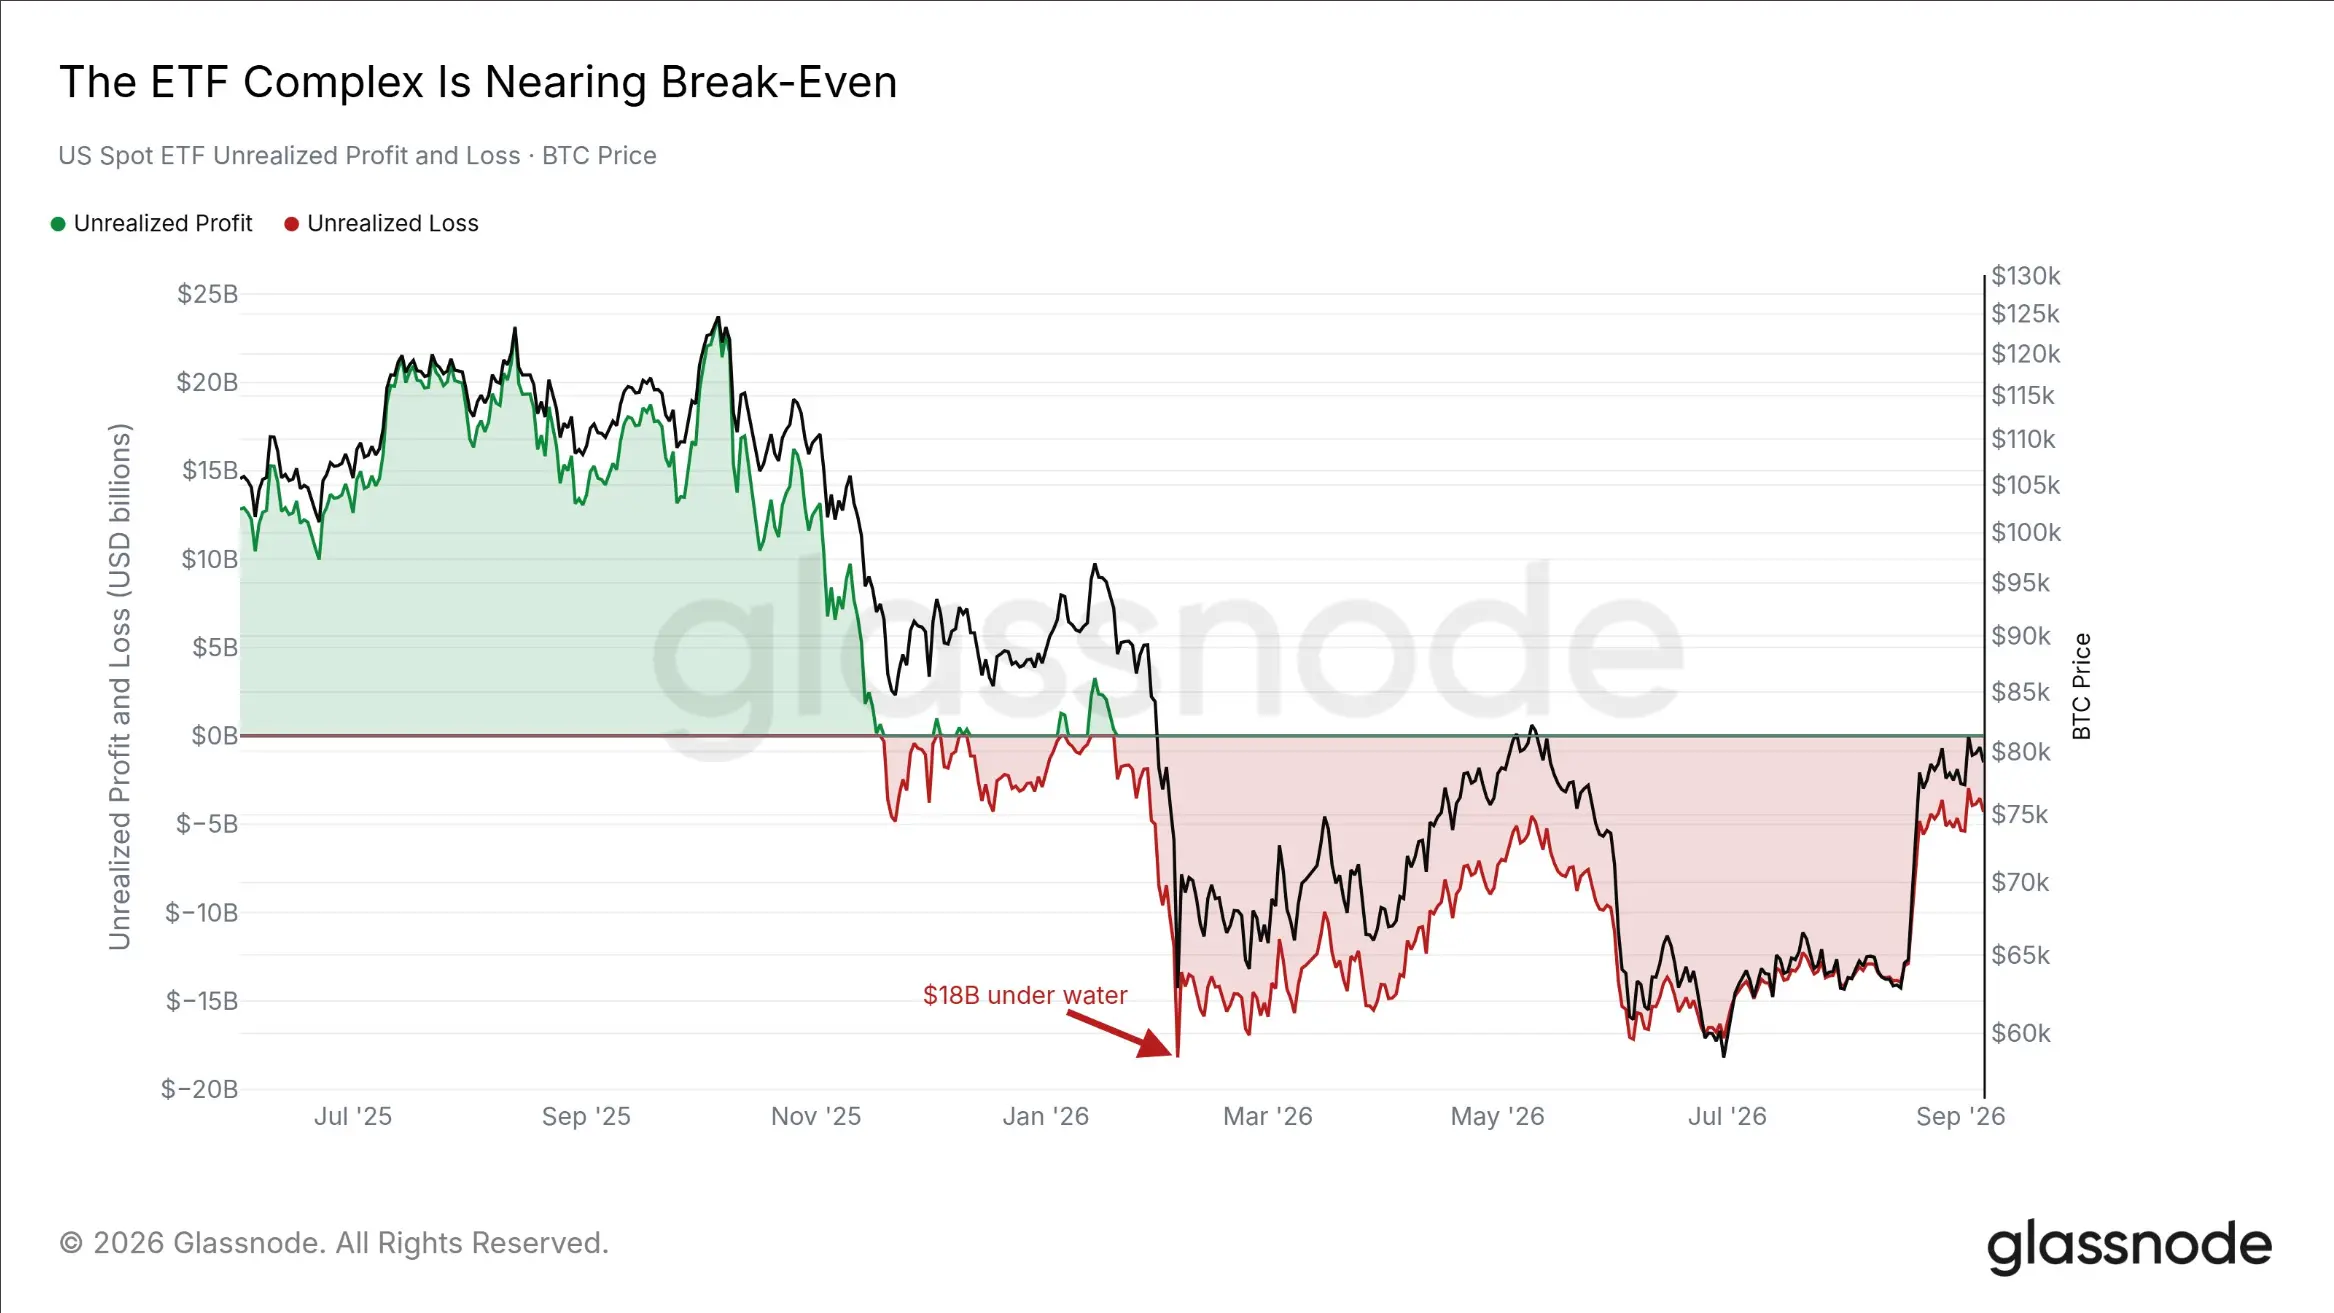
Based on U.S. spot ETF holdings data, using the BTC cost basis corresponding to shares issued since the ETF's inception, the breakeven point is approximately $86,000.
Over the past 228 trading days, the ETF's corresponding BTC holdings have remained below the breakeven line. Its unrealized loss reached a low of about $18 billion on February 5, 2026; as Bitcoin rebounded, the loss narrowed to about $3.9 billion. This is the closest the ETF portfolio has been to breakeven since January.
Corporate treasury breakeven is around $80,500, slightly below the current price.
All five cost-basis models we track are currently above Bitcoin spot price, ranging from the true market mean at $76,600 to the ETF breakeven at $86,000.
Overhead resistance is not a single technical line but a cluster of real cost-basis zones. If Bitcoin reclaims $86,000, the largest institutional holders will return to overall profitability for the first time this year.
Sell Pressure Is Weakening; The Closer to Resistance, the Less Selling
As Bitcoin approached the resistance zone, the market did not show a significant increase in supply.
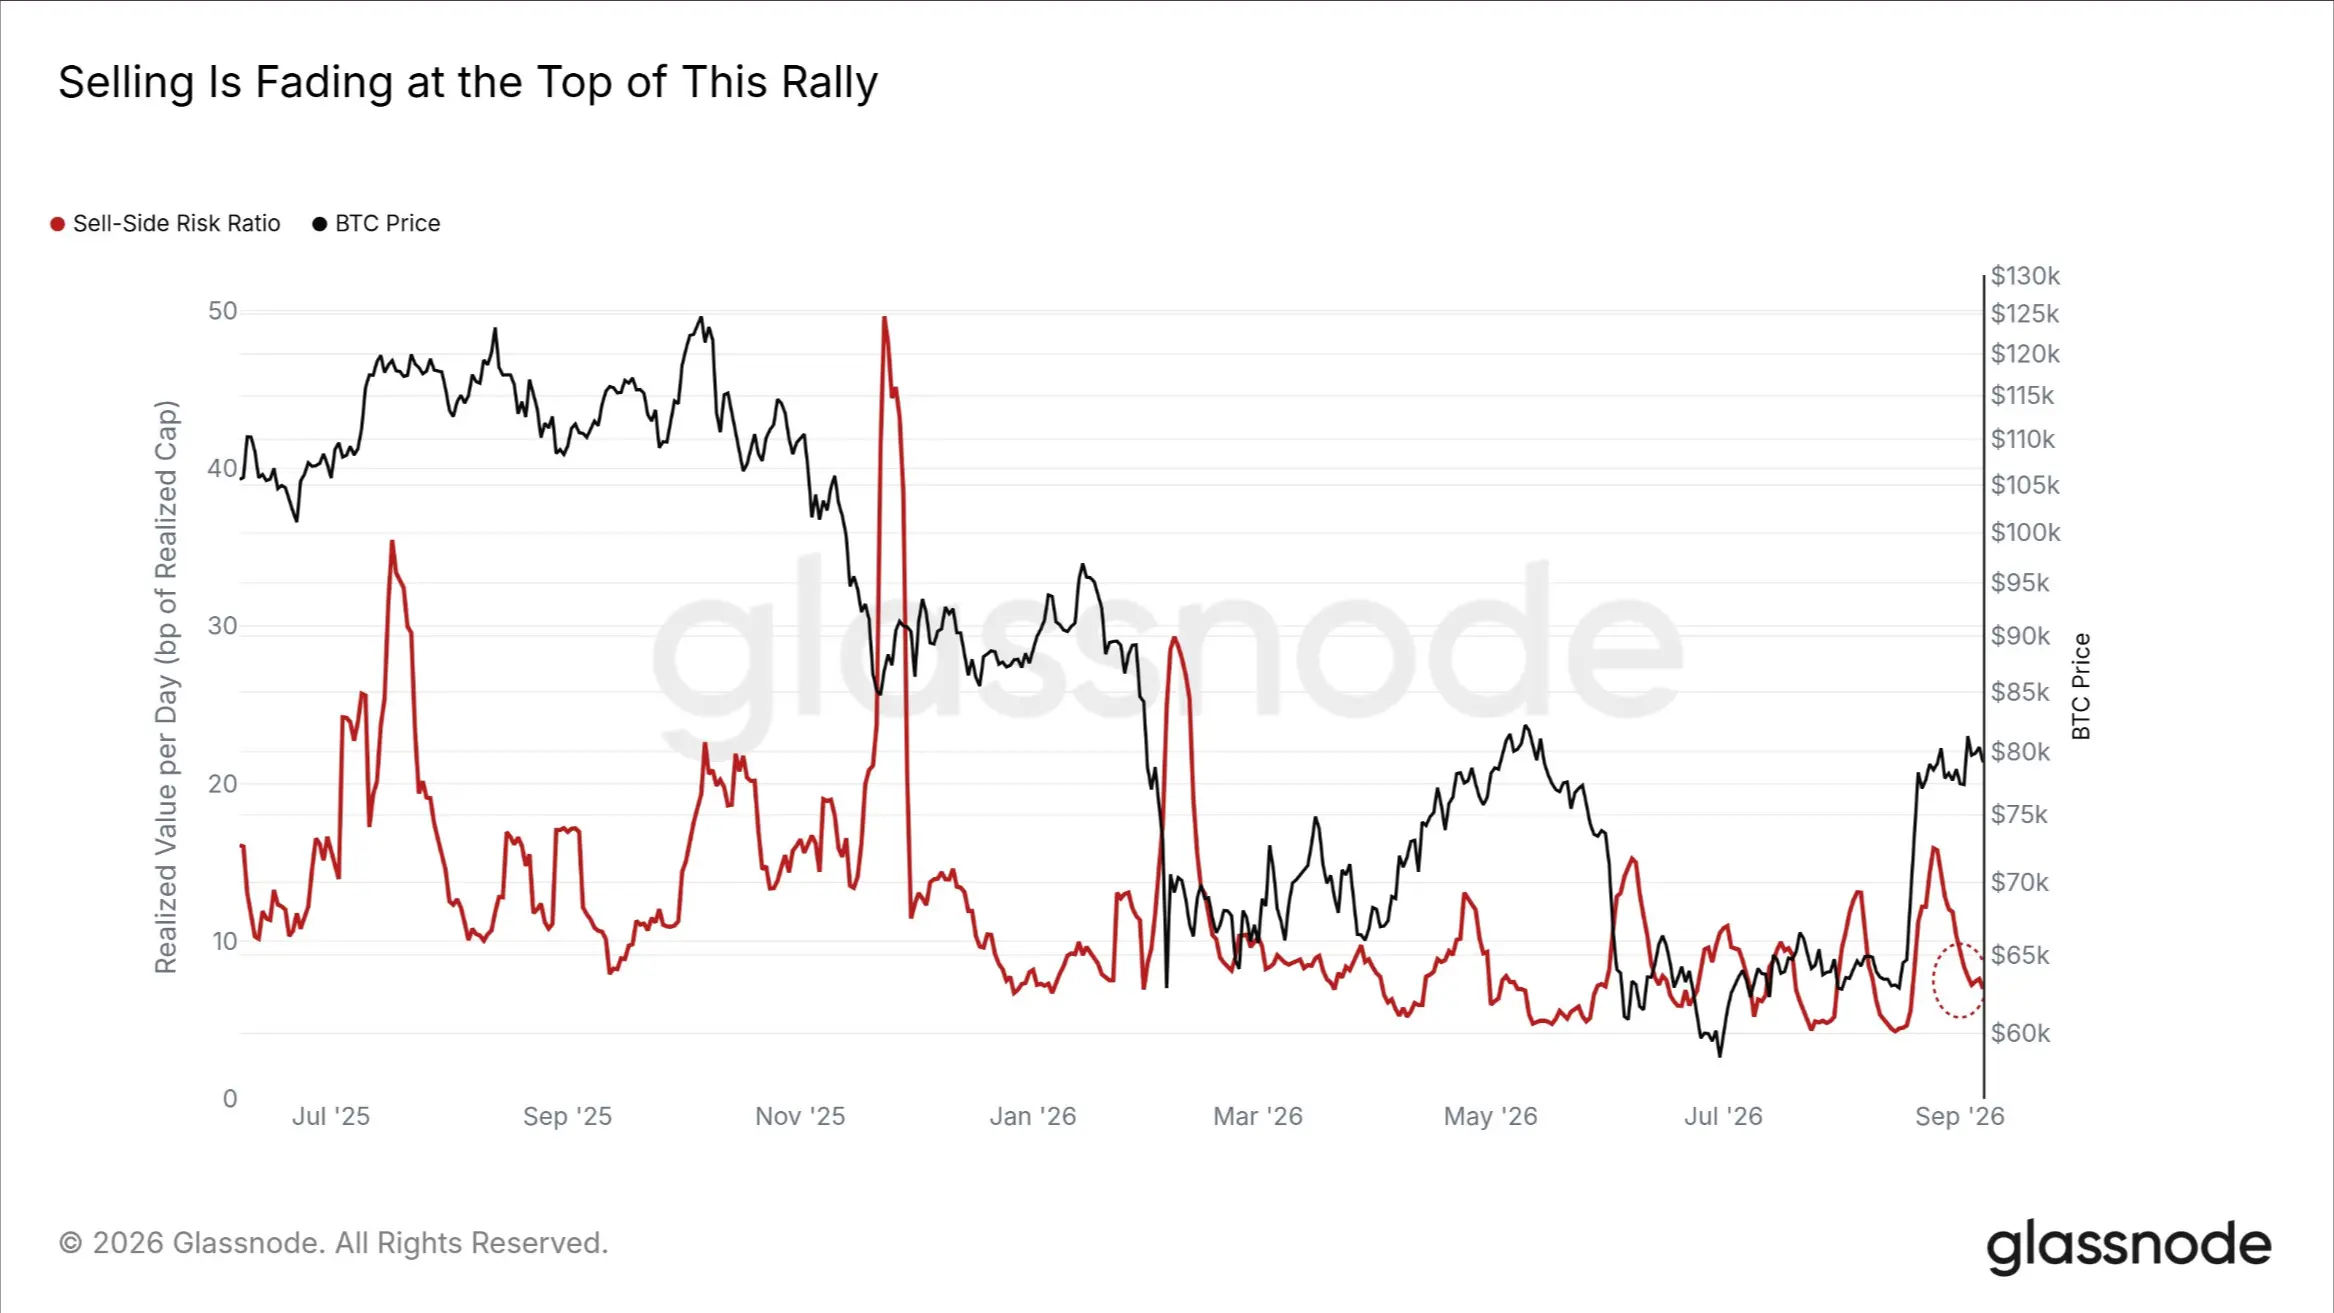
The seller risk ratio measures the sum of realized profits and losses relative to realized market cap. The 7-day average of this indicator has now fallen to 7 basis points per day, less than half of August's peak of 16 basis points.
At the market tops in July and October 2025, this indicator rose to 35 and 23 basis points, respectively. Over the past year, only a few trading days recorded readings below current levels.
The share of realized profits contributed by long-term holders also fell from August's peak of 88% to 47%. The realized profit peak on September 3 was less than half of August's peak.
The main sellers this month are recent buyers, while long-term holders have not significantly realized profits, and short-term holder sell pressure is also weakening.
If this indicator continues to rise and breaks above 16 basis points again, it would indicate that sell pressure has returned to near August's peak. Until then, selling power in the spot market remains limited.
Market Is Between Bottom Repair and Top Confirmation; Bottom Indicators Have Exited Extreme Weakness
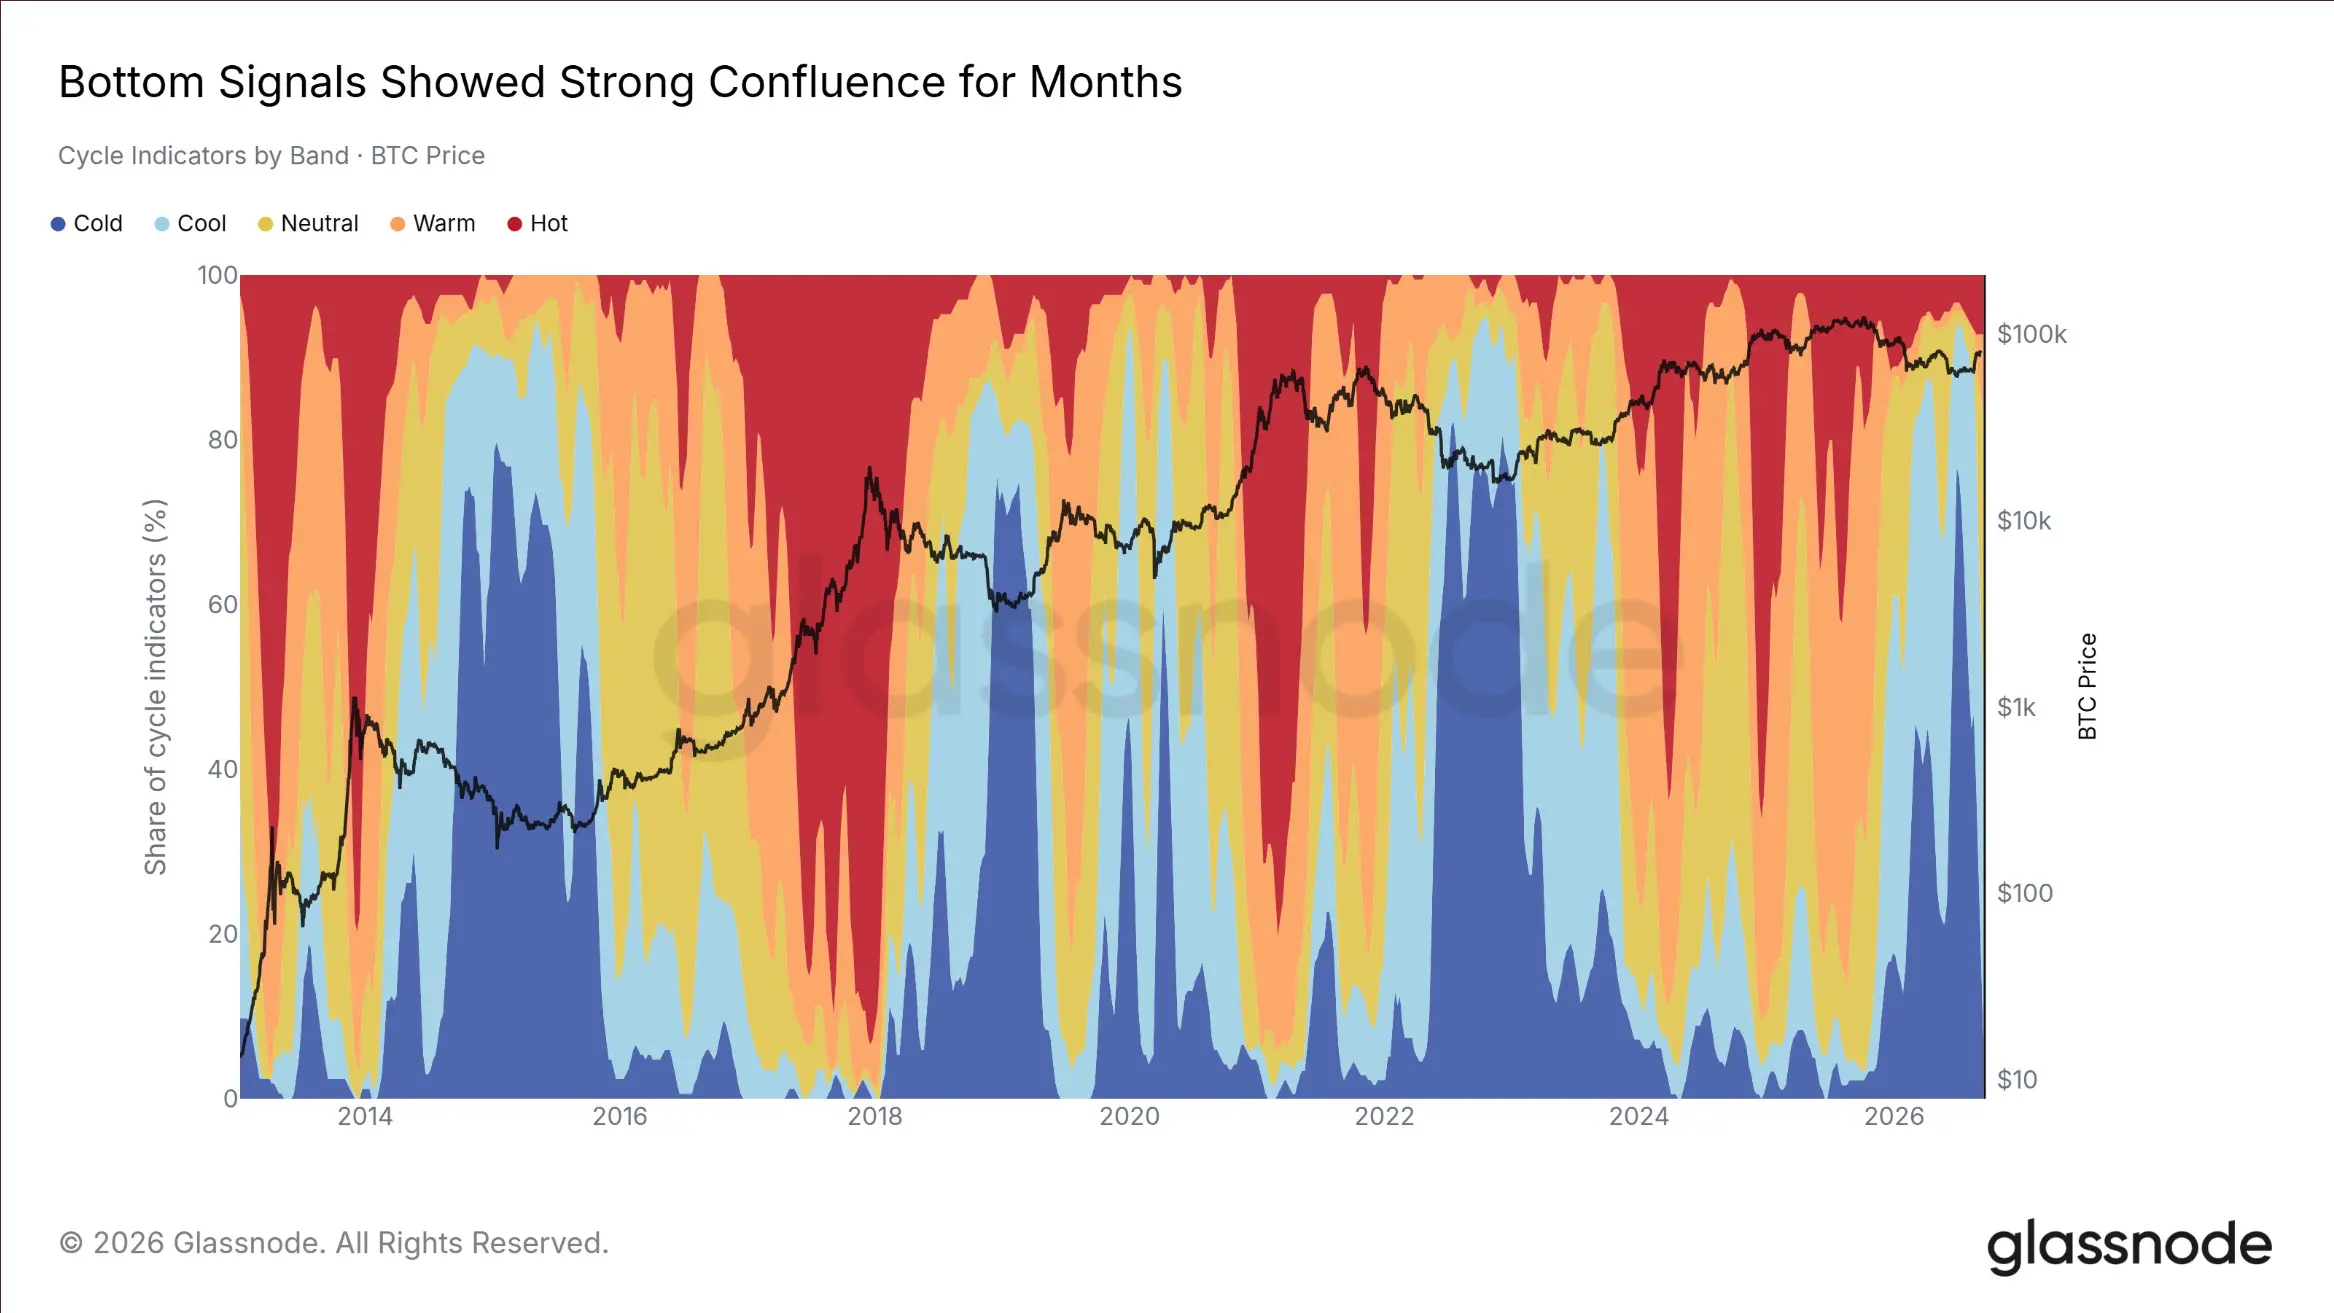
Among the 45 cycle indicators tracked by the Market Compass dashboard, the proportion in the extreme weakness zone peaked at 82% for the week ending June 29, 2026, and remained above the long-term median for 41 consecutive weeks.
This was the strongest bottom signal confluence of this cycle.
As Bitcoin rose and market valuations gradually repaired, the proportion of indicators in the extreme weakness zone fell to 2%, and bottom signals have largely been eliminated.
However, the market has not moved to the other extreme. Currently, three-quarters of indicators are below their respective historical midpoints, and in the past 43 weeks, no week has seen more than half of indicators break above 50.
Bitcoin has exited the value zone but has not yet entered clearly overvalued territory. If more than half of indicators break above 50, that would be a clearer confirmation signal of a market cycle shift.
Altcoins Have Not Shown Abnormal Rotation
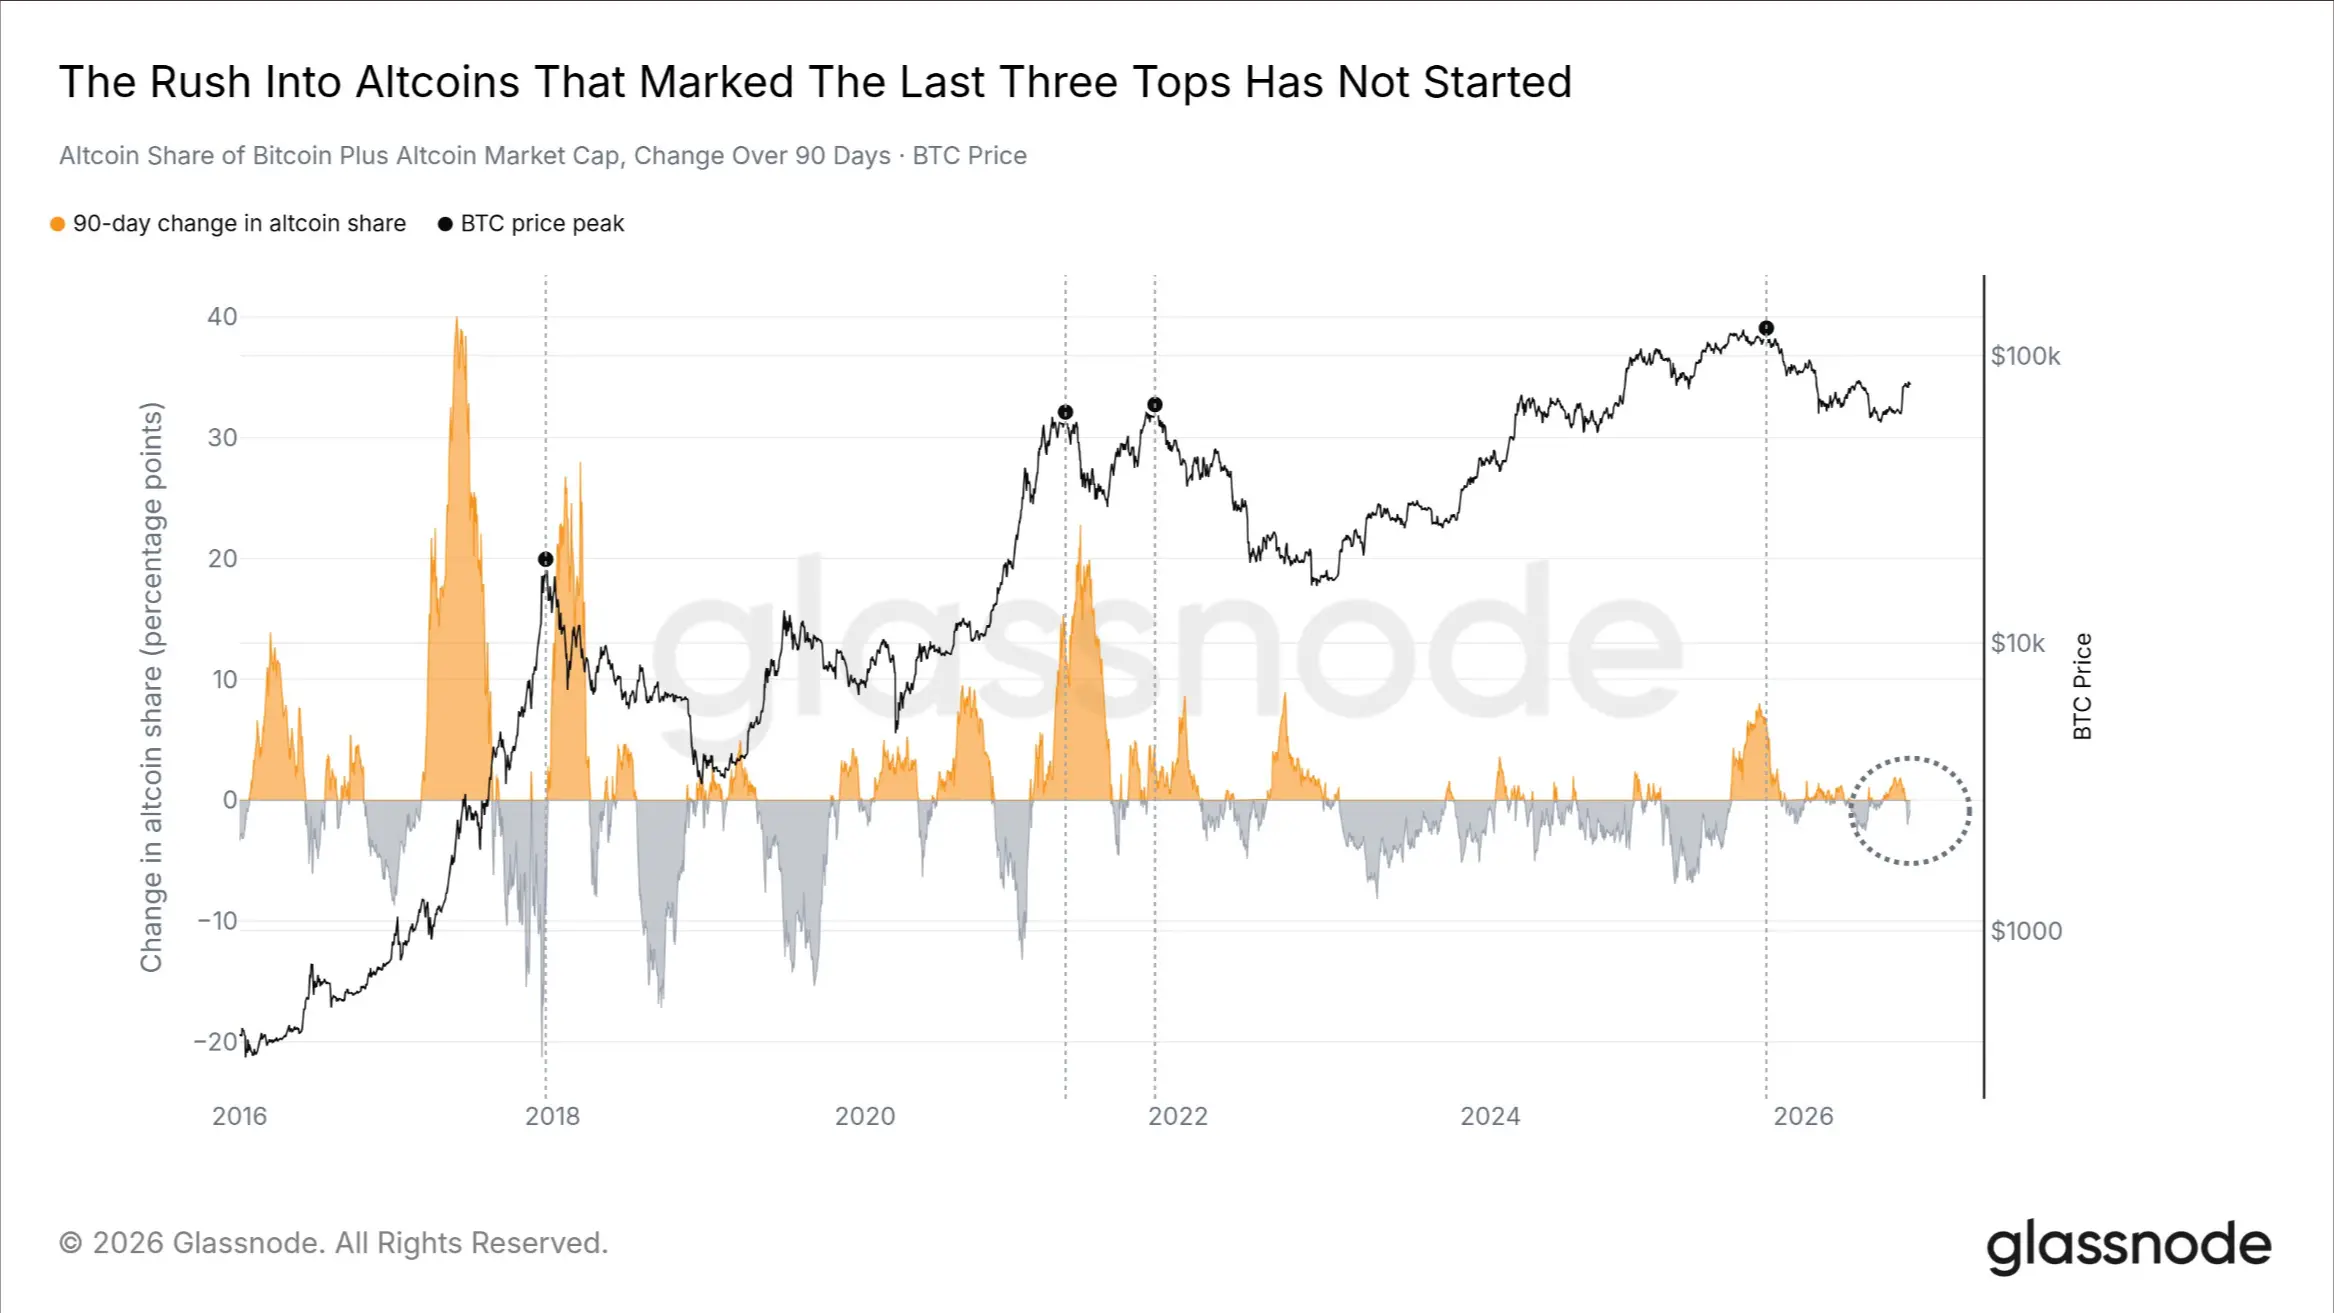
Over the past month, total altcoin market cap rose 21%. However, what needs to be observed is not whether altcoins are rising, but whether their rise relative to the overall crypto market is strong enough, and whether they have begun to take market share from Bitcoin.
Of the four Bitcoin price tops marked on the chart, three occurred after altcoins significantly increased market share over the preceding 90 days, by at least 2.8 percentage points. The December 2017 top was the only exception.
Currently, altcoins' share of the combined BTC and altcoin market cap has actually declined by 0.9 percentage points over the past 90 days.
Although altcoins have risen in dollar terms, their performance has not outpaced Bitcoin. All crypto asset classes have risen almost in sync, with the largest-cap coins still leading.
Before a cycle top truly forms, there is usually a clear rotation of capital: money flows rapidly from Bitcoin into riskier altcoins, and altcoin market cap growth exceeds Bitcoin's own growth rate.
This phase has not yet appeared. If over the next 90 days, altcoin market share increases by 2.8 percentage points or more, while Bitcoin approaches its all-time high, that would constitute a warning similar to previous cycle tops. Currently, neither condition is met.
Conclusion
Bitcoin is consolidating below the $83,000 to $86,000 resistance zone, and three independent indicators—long-term holder cost, liquidation distribution, and ETF breakeven lines—all point to the same resistance range.
The current market remains in a state of oscillation where support has been repaired but the top has not yet been broken.
Compared with August, the most notable change in this round of market activity is a significant reduction in sell pressure: the seller risk ratio is less than half of August's peak, long-term holders have not realized profits on a large scale, but short liquidation liquidity above is continuing to increase.
If Bitcoin can sustain closes above $86,000 while the seller risk ratio remains at low levels, it would indicate that the market has absorbed overhead sell pressure.
Conversely, if the seller risk ratio breaks above 16 basis points again, or if price falls below the $62,000 to $65,000 support zone, the current assessment would be invalidated.
This content is for informational and educational purposes only and does not constitute investment advice related to BTCC. BTCC makes every effort but cannot guarantee the truthfulness, accuracy, or originality of the content above.