


The Fed's Quiet Balance Sheet Expansion: Tapering or T-Bill Buying Spree?
 wallstreetcn
Odaily News: Original source: Quoth the Raven, by Peter Schiff of SchiffGold
Compiled by Odaily News: Qin Xiaofeng (@QinXiaofeng 888 )
The following analysis breaks down the Federal Reserve's balance sheet in detail, covering its various components and changes in amounts, along with historical interest rate trends.
Balance Sheet Breakdown
Since February of this year, the Federal Reserve (Fed) has been quietly conducting quantitative easing. The pace of asset accumulation has slowed in recent months, and August even saw negative growth. When this round of QE restarted, the goal was to purchase Treasury bills to maintain high liquidity. As shown in the chart below, this operation is still ongoing—the Fed net purchased $29 billion in Treasury bills in August. The net decline in the balance sheet was mainly due to the maturity runoff of mortgage-backed securities (MBS) and 5-10 year Treasury notes.
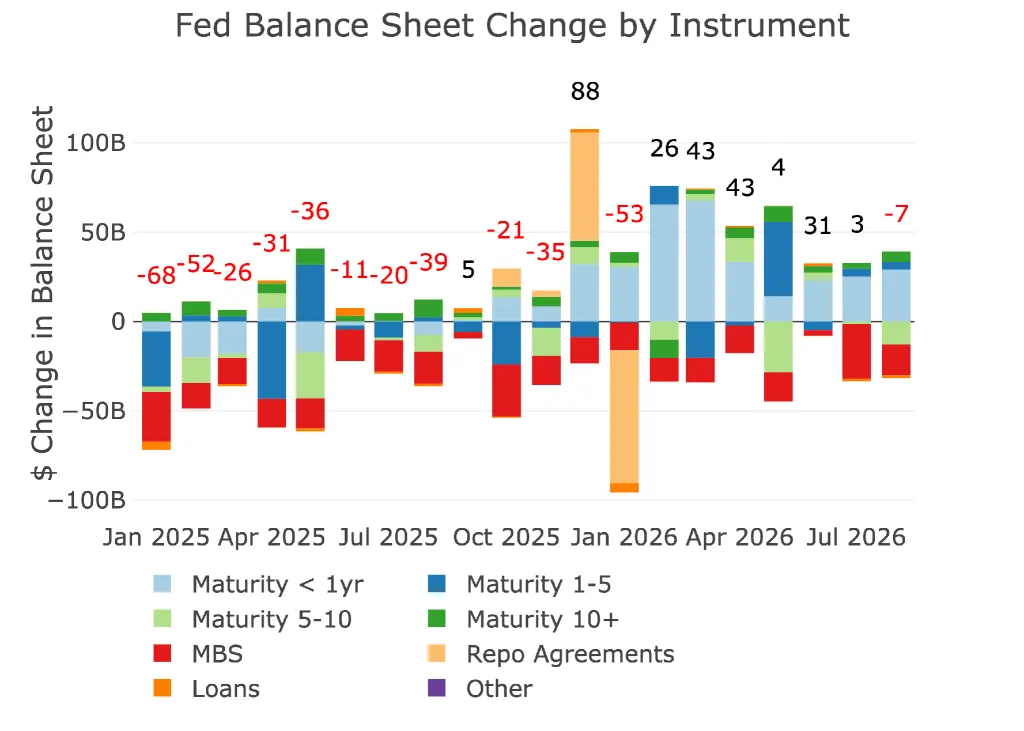
Figure 1: Monthly changes by instrument
Extending the timeframe to ten years and aggregating data annually yields the chart below. Note how quickly the Fed could undo all its previous balance-sheet reduction efforts when the next crisis hits. It took four years to reduce the balance sheet by about $2.2 trillion. Yet in 2020, it expanded by $3 trillion in just a few months, and by $4.5 trillion over two years.
So far this year, the Fed has expanded its balance sheet by $90 billion. While not a large increase compared to past years, it is noteworthy—the balance sheet is growing, not shrinking, which makes it harder for inflation to decline.
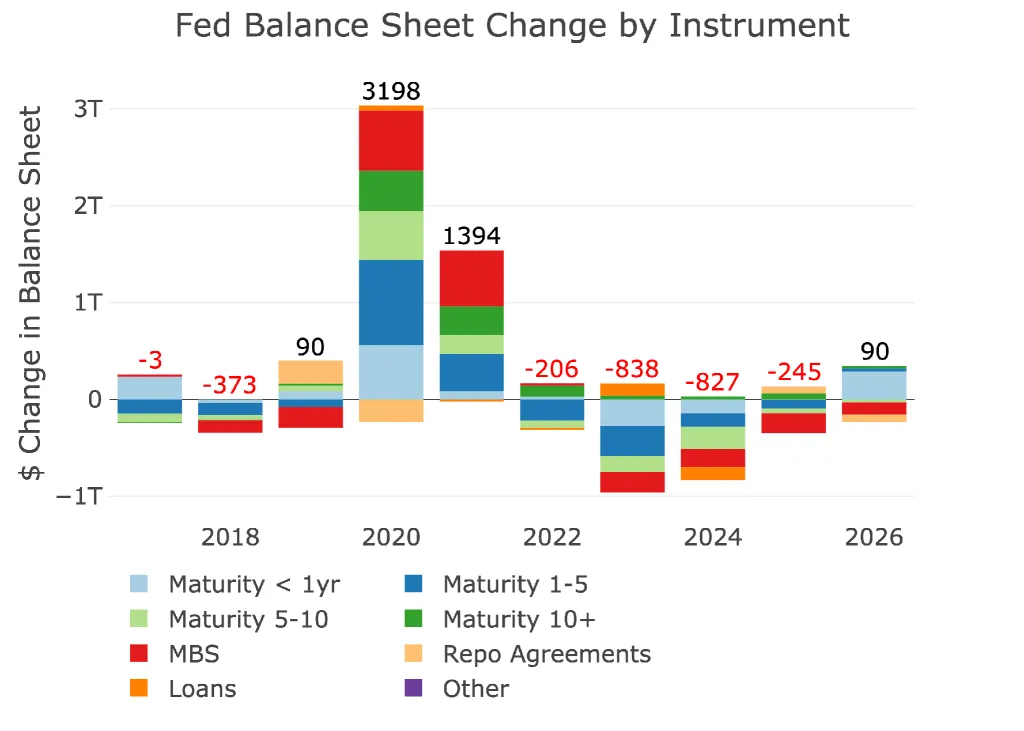
Figure 2: Monthly changes by instrument
The table below details the Fed's operations and recent efforts to manage the balance sheet in more detail.
The most noteworthy point is that over the past year, the Fed has increased its holdings of Treasury bills by $344 billion! This increase cannot be ignored. Why is the Fed focused on buying Treasury bills? Treasury bills are typically the most liquid instruments in Treasury issuance, so the Fed's intervention for liquidity reasons is puzzling.
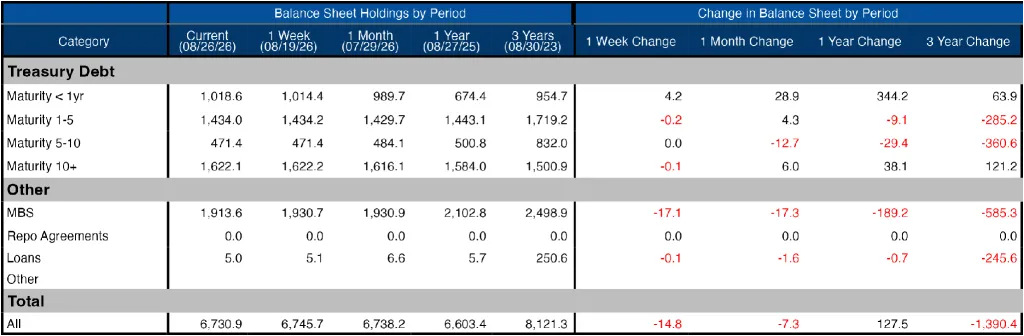
Figure 3: Balance sheet breakdown
Weekly operational details are shown in the chart below. The trajectory of continuous weekly Treasury bill purchases is clearly visible.
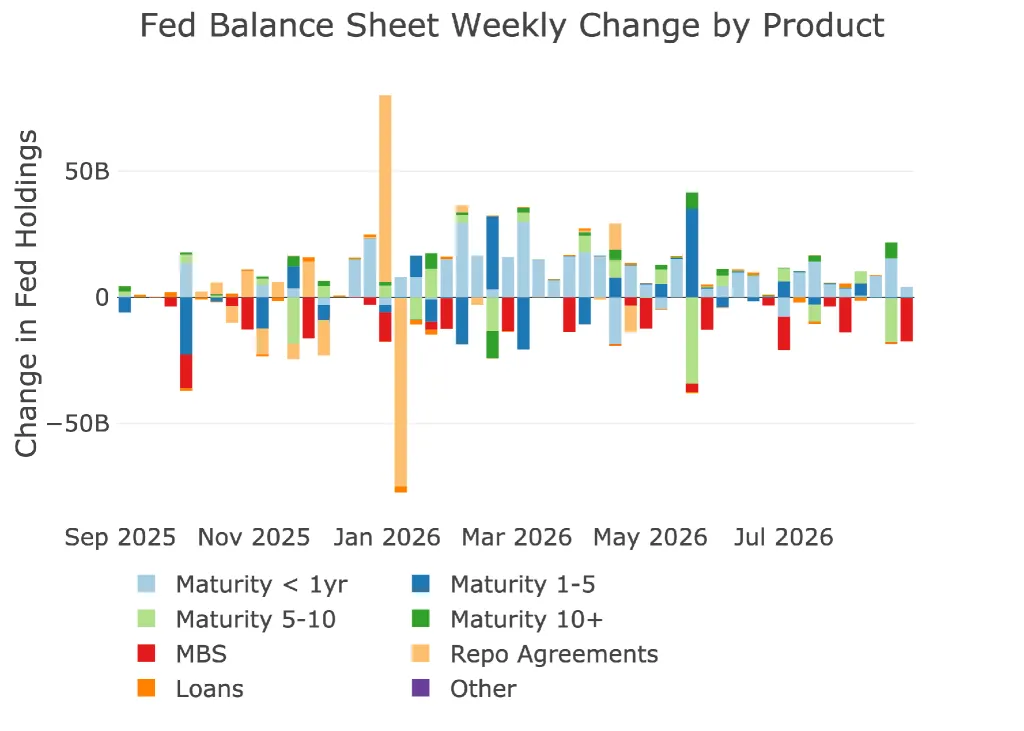
Figure 4: Weekly changes in the Fed's balance sheet
The chart below shows the balances of loan and repo line items. These are emergency facilities established after the collapse of Silicon Valley Bank (SVB). All related facility balances have now dropped to zero, but as mentioned above, the Fed wants to see more use of the repo market (the standard repo facility, or SRF).
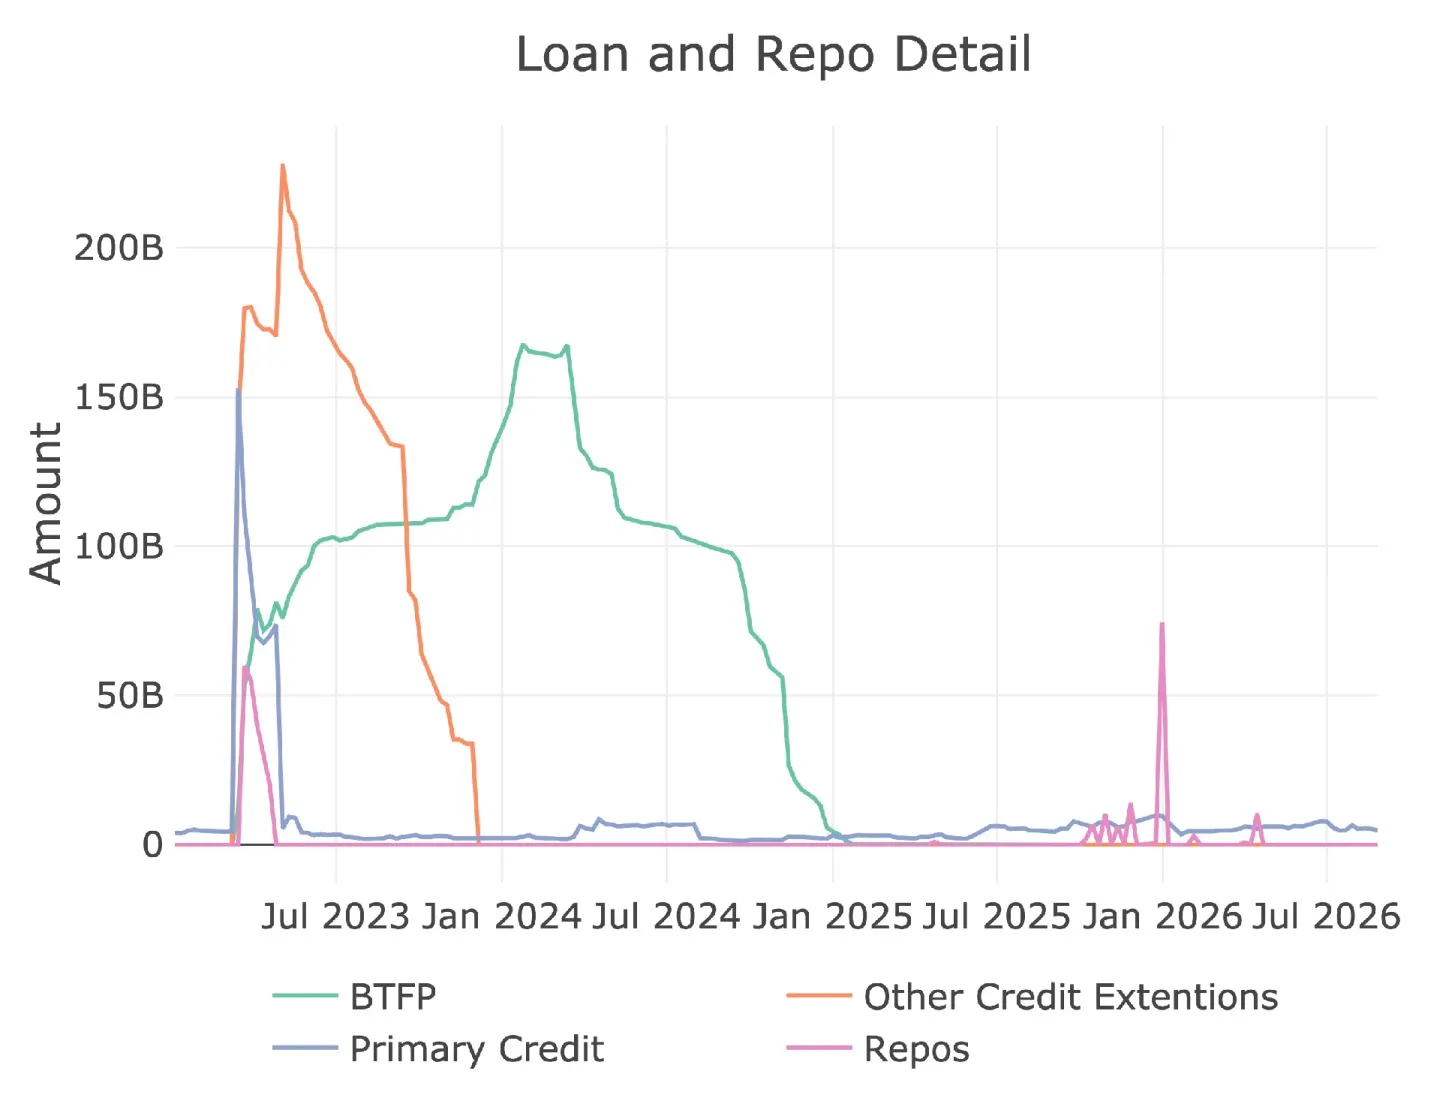
Figure 5: Loan line item details
Yields
Since September 2022, yields across maturities have largely fluctuated within a range, roughly between 3.25% and 4.75%. This range was broken in June—the 30-year yield decisively broke above 5%, and the 10-year above 4.5%. This is exactly why the Treasury intervened in the market. They saw cracks in the bond market that could have major implications.
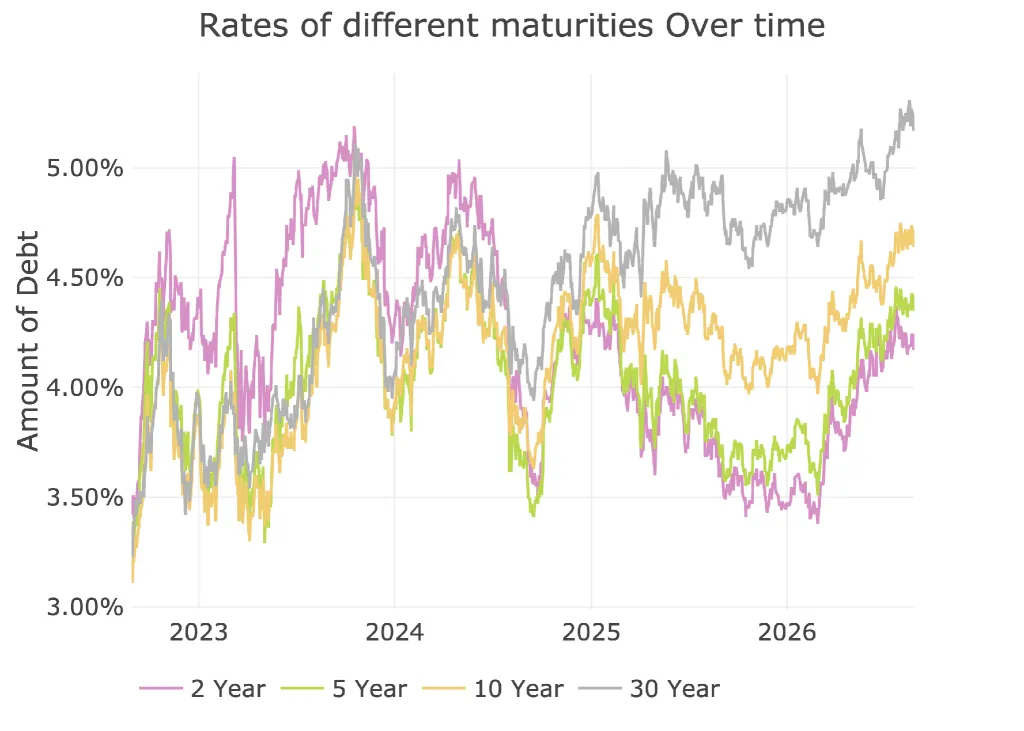
Figure 6: Interest rate trends by maturity
The yield curve spread has begun to widen again, meaning investors are demanding more compensation for locking up dollar funds for longer periods.
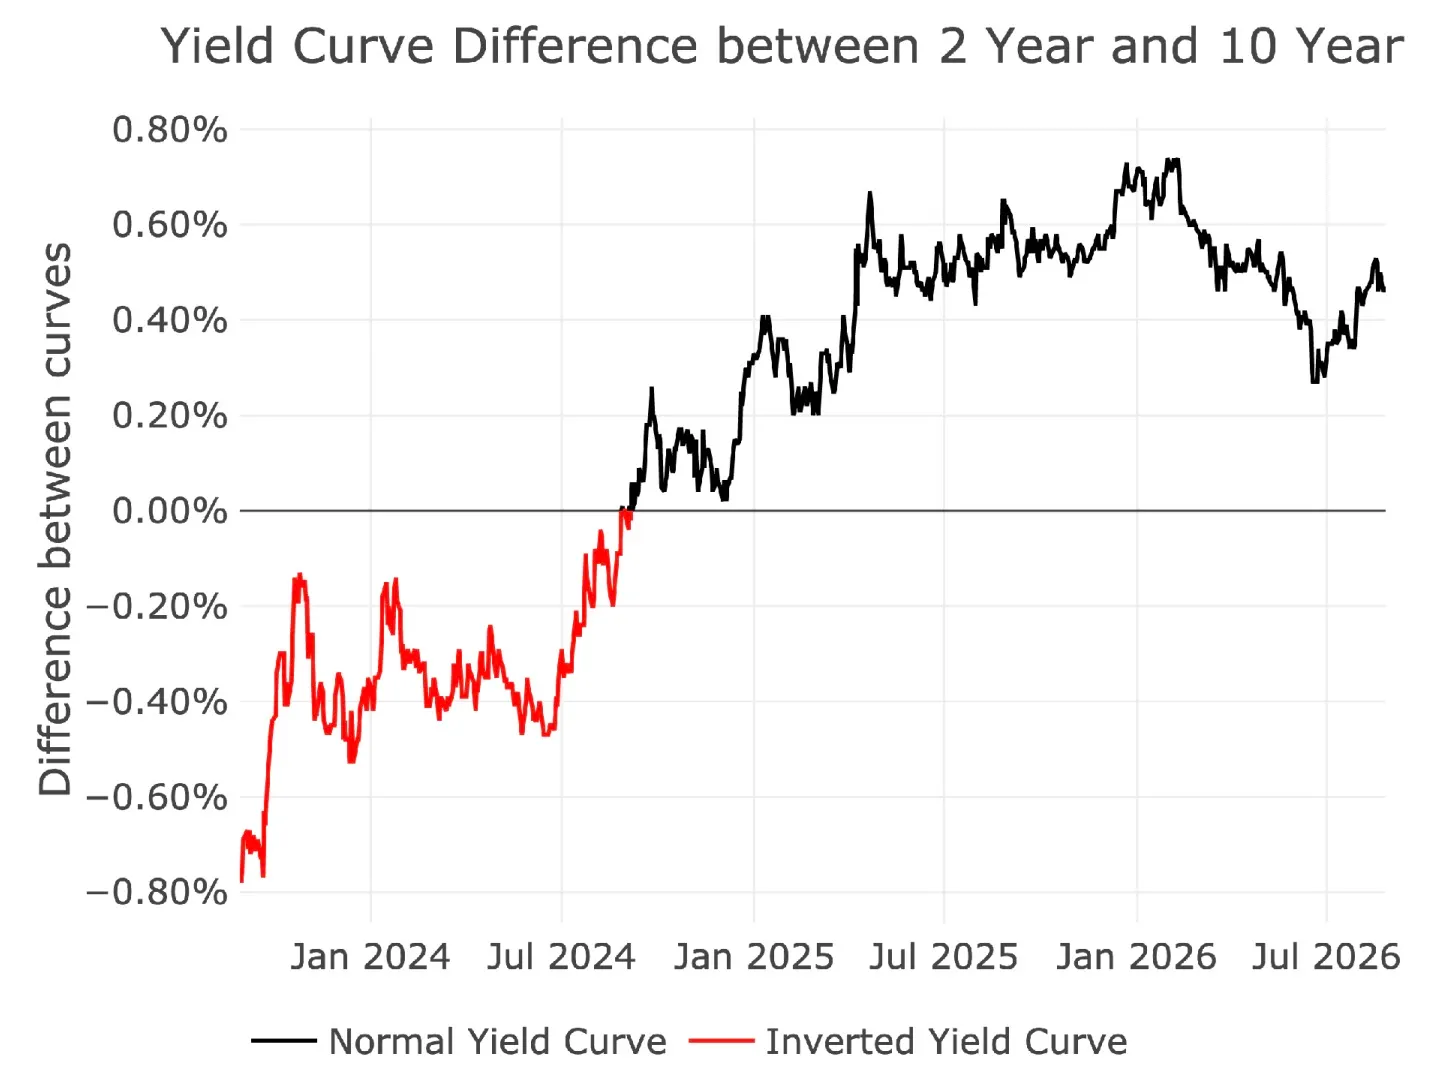
Figure 7: Yield curve inversion tracking
The chart below shows the current yield curve, as well as the curves from one month ago and one year ago. Once again, it is clear that the yield curve is beginning to steepen, which makes the Treasury's operations more difficult.
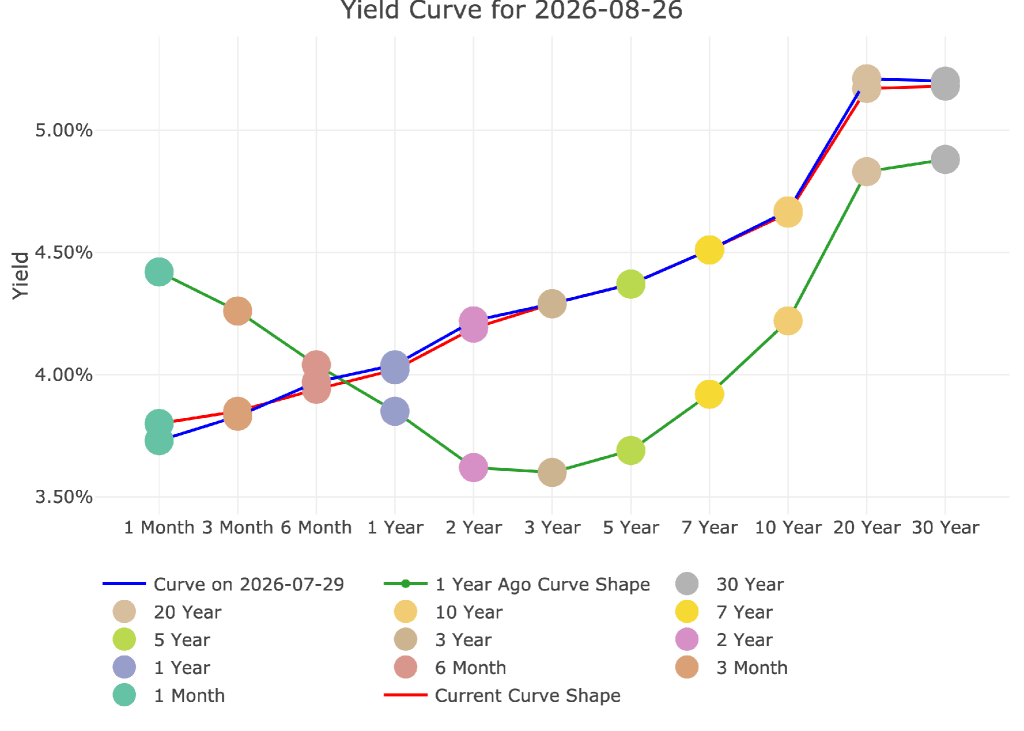
Figure 8: Yield curve inversion tracking
Waning Overseas Interest in US Treasuries
Perhaps the most worrying development is the decline in international interest in US Treasuries. Total foreign holdings of US debt have fallen from a peak of $9.4 trillion in the first quarter. At a time when the US Treasury is issuing more and more debt, foreign holders are not stepping in to buy, which is undoubtedly a very bad signal.
Note: Data is lagged, with the latest data through June.
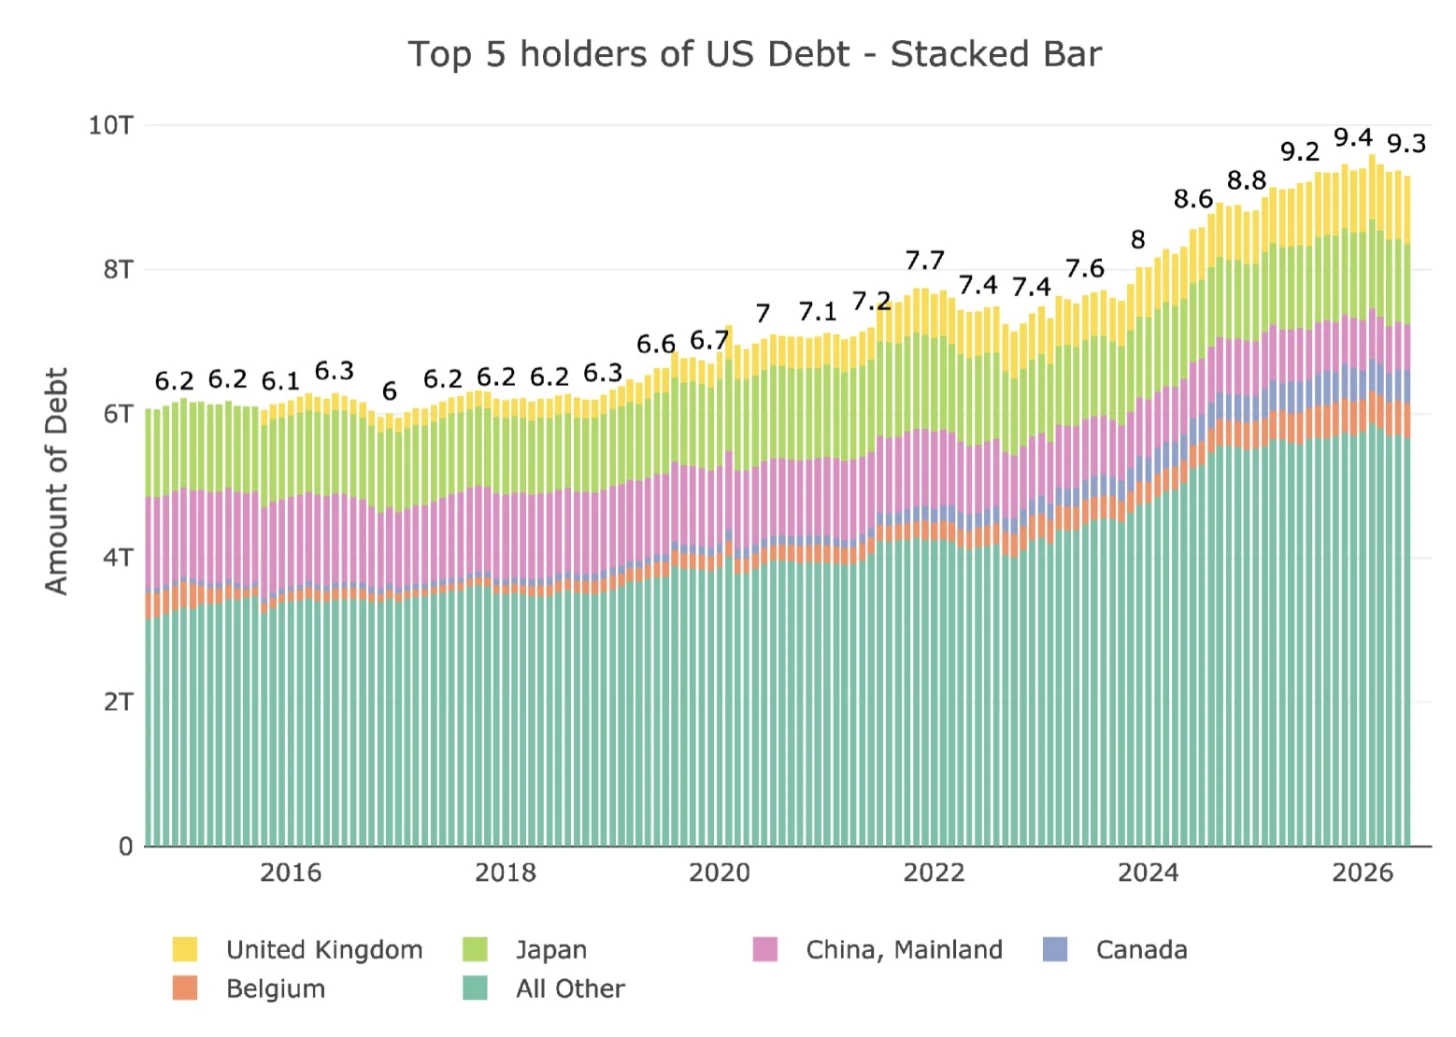
Figure 9: International holders
The chart below lists the holdings of major countries. China's holdings of US debt have fallen to $630 billion, a decrease of $100 billion from last year. The UK now holds more US debt than China. Japan's holdings have been roughly flat over the past decade, fluctuating between $1 trillion and $1.25 trillion. Japan cannot turn into a seller, or it would exacerbate the pain. This is one of the reasons the US intervened in the foreign exchange market.
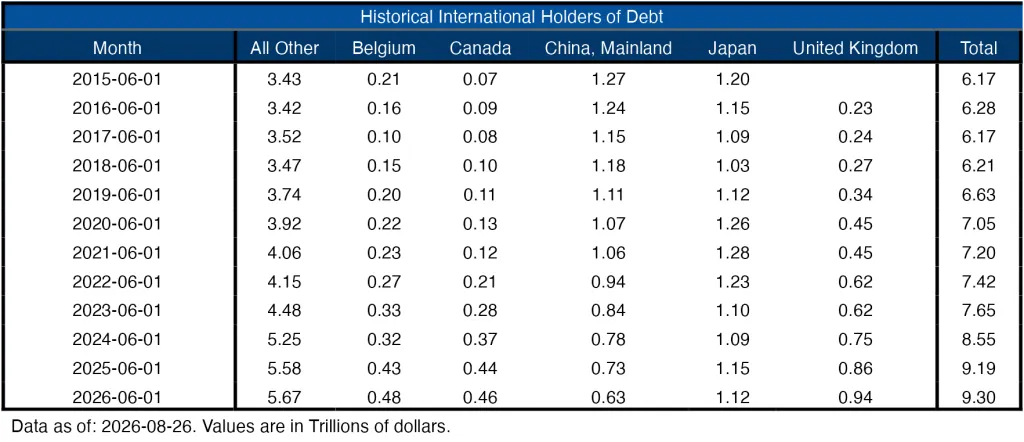
Figure 10: Weekly average changes in the balance sheet
Historical Perspective
The final chart examines the balance sheet from a broader perspective. It is clear that since the global financial crisis, the Fed's use of its balance sheet has fundamentally changed. The chart also highlights the contrast between rapid expansion and slow reduction. The Fed can essentially never shrink its balance sheet back to previous levels; it can only make small cuts between crises and then blow it up again during the next crisis. Based on the trajectory of the Fed's balance sheet, the next crisis may be closer than everyone thinks!
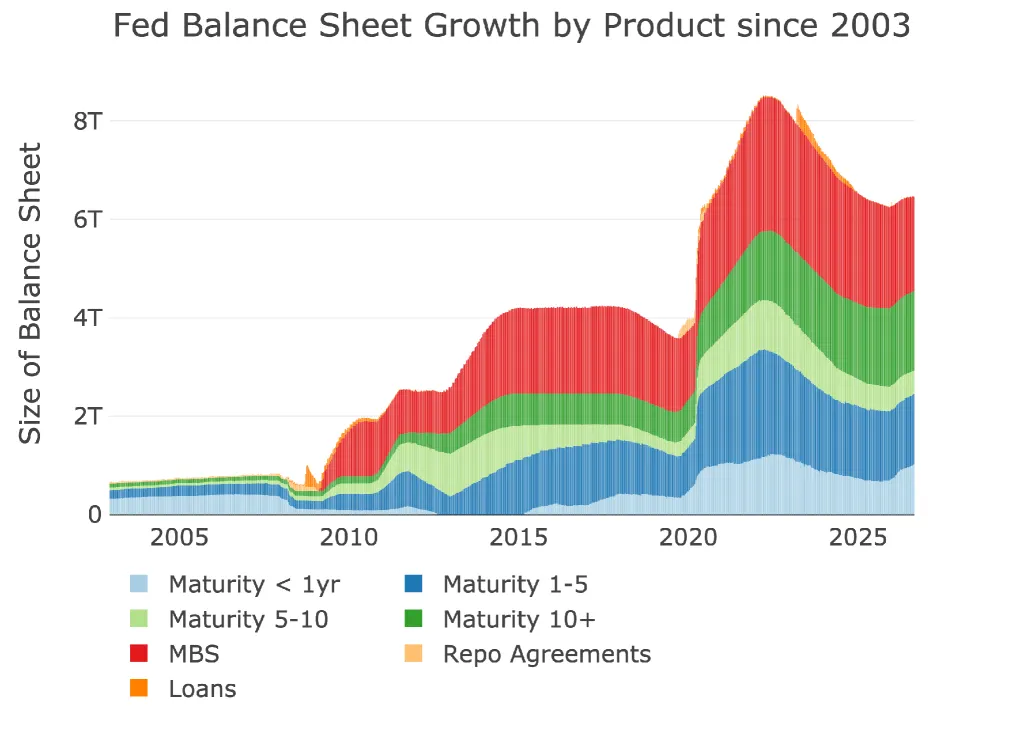
Figure 11: Historical trend of the Fed's balance sheet
Conclusion
Warsh's arrival brings a new slogan: after more than five years of effort, the Fed is ready to control inflation. Easier said than done. This is actually more of a math problem. If the Fed raises rates, government borrowing costs will continue to rise, which is unacceptable. The only option is to keep rates unchanged or cut them—they just need a suitable excuse.
Warsh Promises No Excuses on the 2% Inflation Target
Federal Reserve Chair Kevin Warsh drew a clear red line for the central bank's credibility from the podium at Jackson Hole last Friday, declaring the long-standing 2% inflation target for the personal consumption expenditures (PCE) price index a "firm, fixed target." He said price stability "will not happen automatically... the Fed's job is to achieve price stability, no excuses." Investors noted that gold hit an intraday high of $4,612 per ounce on Thursday, a reminder that the market is still hedging against the possibility that inflation remains persistently well above the Fed's comfort zone.
PCE inflation is running at 3.7% year-over-year, with a six-month annualized pace above 4%. Even after cooling from post-pandemic peaks, 54% of items in the PCE basket have risen more than 3% over the past year, compared with only 32% before the pandemic. Warsh said the "65 consecutive months of elevated inflation" is entirely the central bank's responsibility. Comparable consumer price index (CPI) data also show the same stubborn pressures, indicating that price growth has not yet shown substantial improvement.
Warsh described the labor market as "broadly consistent with full employment." Business investment in equipment and intangible assets is growing at a 9% rate, with more than half related to artificial intelligence projects. S&P 500 company profits are growing more than 20%, and profit margins are "quite high." Corporate bond spreads and leveraged loan spreads are trading near historic lows, while the July Senior Loan Officer Survey showed some easing in commercial and industrial lending standards.
Warsh also addressed the Fed's own communication practices. He warned that conventional forward guidance could trap policymakers and market participants in a "hall of mirrors"—both reacting to each other's signals rather than to the real economy. He argued that short-term interest rates should remain the primary tool of monetary policy, adding that balance sheet experiments and other unconventional measures "should be used sparingly, if at all, in other circumstances." Referring to the monetary tradition before quantitative easing, he said "money matters" and urged the Fed to focus on the money created by the central bank and the broader financial system.
Warsh also identified artificial intelligence as a "new variable" that could affect productivity, noting that annualized token sales at two leading AI labs have exceeded $100 billion, up more than 500% from a year ago. Faster productivity growth helps suppress prices over the long term, but the speed of AI-related investment raises overheating concerns, as also seen in the recent rise in gold.
Whether the Fed can tame prices without launching a new round of unconventional policies remains to be seen. For now, investors appear to be hedging this uncertainty by continuing to hold and buy gold—an asset that has stood the test of time through decades of inflation and recessions.
This content is for informational and educational purposes only and does not constitute investment advice related to BTCC. BTCC makes every effort but cannot guarantee the truthfulness, accuracy, or originality of the content above.