Solana vs Avalanche: Which Blockchain Dominates the 2025 Altseason?

High-speed blockchain rivals face off as altcoin season heats up
The Infrastructure Showdown
Solana's raw throughput clashes with Avalanche's subnet architecture—both chains claim transaction supremacy while traders chase the next parabolic move. Network activity spikes 47% across both ecosystems as capital rotates from Bitcoin dominance.
Developer Wars
Builders flock to Solana's low fees but grapple with stability concerns. Avalanche's custom blockchain approach attracts enterprise players—though decentralization purists question both networks' validator counts. Daily active addresses tell conflicting stories across competing metrics.
The Final Trade
With institutional money flooding the altcoin space, technical superiority might matter less than market momentum. Remember when fundamentals mattered? Neither do hedge funds chasing 100x returns.
KEY TAKEAWAYS
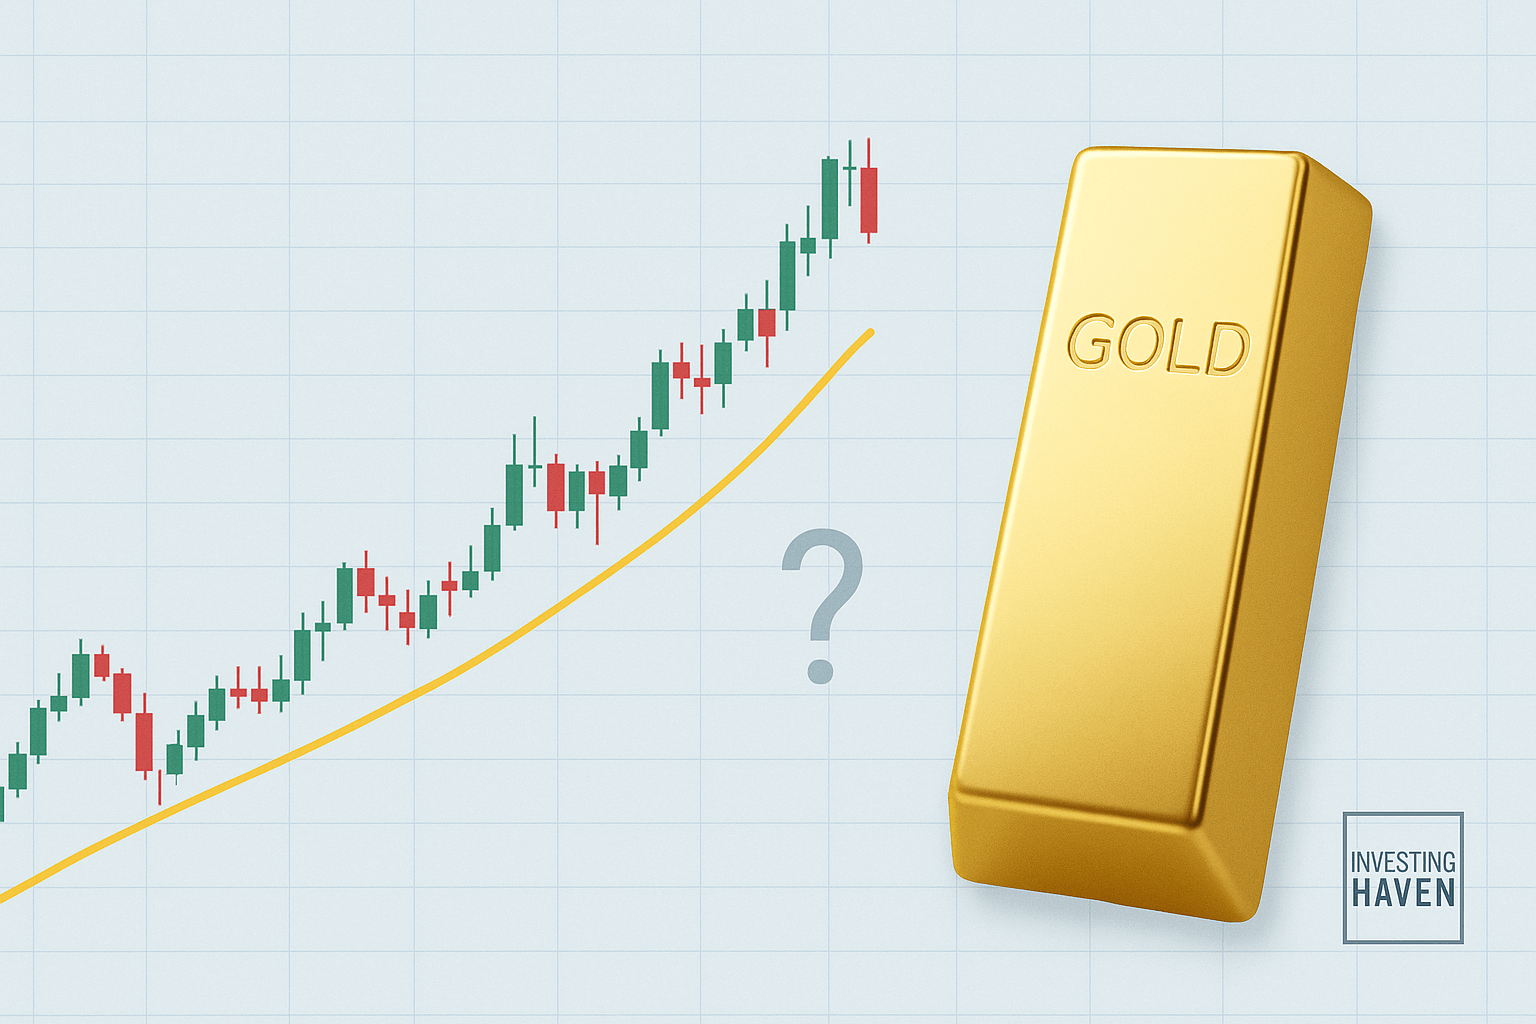
- Gold’s sharp drop below $4,000 signals a cooling phase after months of steady gains.
- The $3,800–$3,900 range is the main support zone that could determine if prices stabilize or fall further.
- ETF outflows show short-term profit-taking, but strong Asian demand continues to support the market.
- Rising US real yields and Fed policy signals remain the biggest macro factors influencing gold’s direction.
- A sustained move above $4,100 would indicate renewed buying strength and a possible return to the uptrend.
Gold’s rally has slowed after months of strong performance. A sudden sell-off pushed prices under $4,000, marking the biggest daily decline in years. Investors are now watching whether the metal can find solid ground or if this slide could extend further.
The next few trading sessions will show if this is a healthy correction or the start of something bigger.
RECOMMENDED: Why Do USD Moves Now Drive Both Gold And Crypto?
Price Action And Key Levels To Watch
Gold’s short-term outlook depends on how it behaves between $3,800 and $3,900. This range is the main support zone where buyers have stepped in before. If prices hold there, gold may consolidate and rebuild strength.
A break below $3,800 could point to more weakness, possibly toward the mid-$3,600s. On the upside, resistance sits between $4,000 and $4,100, the area that capped the last two rallies.
Momentum indicators such as the RSI and MACD can help gauge whether selling pressure is easing or if buyers are regaining control.
ALSO READ: Platinum, Gold, Palladium & Silver Dominate YTD Performance
Market Flows And Investor Behavior
ETF data shows that gold funds have recently seen outflows after months of steady inflows.
This means some investors are locking in profits as prices cool off. However, physical demand in Asia, especially from India during the festival season, remains strong. That steady demand provides a floor for prices even as short-term traders exit.
RECOMMENDED: How Renewed Central-Bank Gold Purchases Are Re-Shaping Prices
Macro Factors Shaping The Next Move
Three factors will decide gold’s next direction: US real yields, the Federal Reserve’s interest rate outlook, and global risk sentiment.
Higher yields usually weigh on gold, while any signs of rate cuts or market uncertainty could quickly revive demand.
Conclusion
Gold’s current test lies in whether it can stay above the $3,800–$3,900 zone and regain momentum. If support holds and ETF flows stabilize, prices could rebound toward $4,100. Keep an eye on:
- Support zone: $3,800–$3,900
- Resistance zone: $4,000–$4,100
- Momentum signals and ETF inflows
Join the original market-timing research service — delivering premium insights since 2017. Our alerts are powered by a proprietary 15‑indicator system refined over 15+ years of hands-on market experience. This is the same service that accurately guided investors through stock market corrections and precious metals rallies.
Here’s how we’re guiding our premium members (log in required):
- Gold Overheated. Silver Breakout Back Test. What’s Next? (Oct 18th)
- In Focus: Gold’s Hot Sentiment and Silver’s Intraday Reversal. (Oct 11th)
- Is Silver Ready To Crush Its 45-Year Resistance? (Oct 4th)
- Will Silver Set a Major Top at $50/oz? Our Deepest Analysis Yet. (Sept 27)
- Silver Rally Fueled by Absent Speculators (Sept 20)
