Bitcoin Defies Fed Moves: Market Shrugs Off Policy Shifts with Bullish Resilience

Bitcoin just gave the Fed a masterclass in irrelevance.
While traditional markets obsess over every basis point and policy whisper, BTC charts its own course—defying conventional wisdom and central bank posturing with characteristic swagger.
The Decoupling Dance
No longer tethered to macroeconomic theater, Bitcoin's momentum stems from organic adoption drivers—institutional inflows, hedging demand, and pure network effect. The Fed's lever-pulling? Barely a blip on crypto's radar.
Finance's New Independent
Traders watching Treasury yields might as well be reading tea leaves. Bitcoin's ecosystem operates on different fundamentals: hash rate, holder accumulation, and that relentless march toward digital scarcity. Sorry, Jerome—your playbook's gathering dust.
Where traditional assets knee-jerk, Bitcoin innovates. Another day, another reminder that decentralized money doesn't wait for permission—or policy meetings.
(Of course, Wall Street will still try to charge 2% management fees for 'exposure' to this rebellion.)
Bitcoin (BTC) price: The consolidation continues
So what can be gleaned from the bitcoin charts today?
The daily chart for BTC shows a market in limbo, with price action basically trading sideways since June, but with an ever so slightly upwards trajectory.
Bitcoin opened today at $116,836, but dipped to a low of $114,747 immediately after the Fed’s announcement, before bouncing to its current price for a net loss of less than 1% on the day.
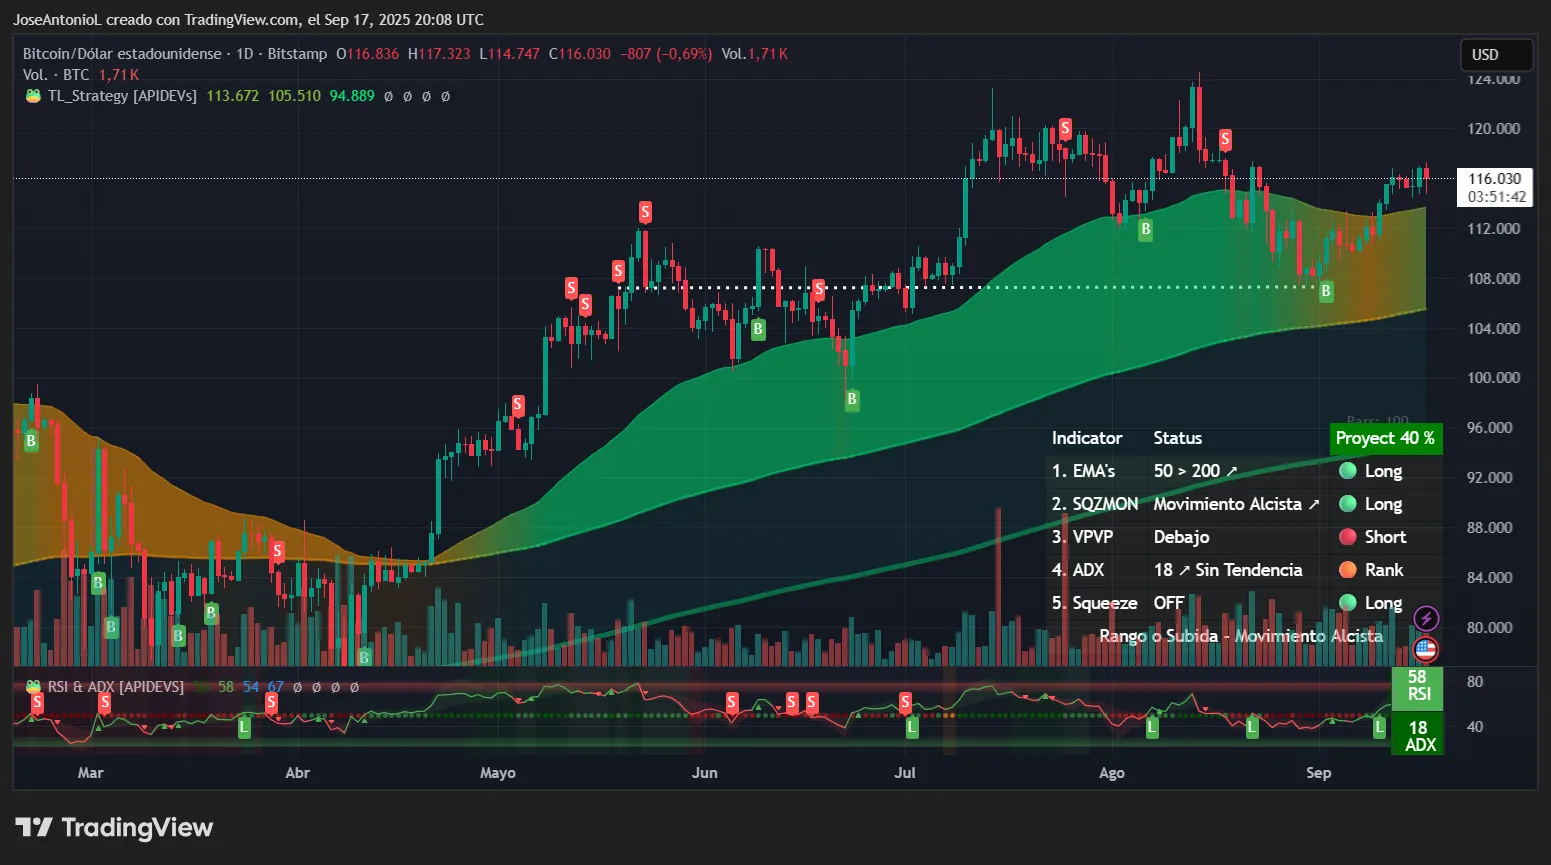
The Relative Strength Index, or RSI, for Bitcoin sits at 58 in neutral to bullish territory. RSI measures price momentum on a scale of 0 to 100, where values above 70 indicate overbought conditions and below 30 suggest oversold levels. Bitcoin has gained a bit of momentum since dropping below its average price over the last 50 days of $110,000 back in late August
The Average Directional Index, or ADX, which measures trend strength regardless of direction, for BTC is currently at 18. For traders, this shows that the market is basically neutral—traders are essentially waiting for a catalyst to establish the next major move. (Anything under 25 tells traders that a trend isn’t really in place.)
This typically means range-bound trading will continue until a breakout occurs hitting a new all-time high or breakdown below $104,000, which is the average price of Bitcoin over the last 200 days.
It’s these exponential moving averages, or EMAs, that offer a glimmer of hope.
Until a few days ago, the 50-day EMA (the average price over the last 50 trading days) and the 200-day EMA started to compress, hinting at potentially bearish times. This bounce has been enough to increase the gap, which means Bitcoin is still in a bullish formation. Slow, yes, but bullish nonetheless.
The key question now is whether the Fed's signal of two more cuts before year-end will be enough to reignite risk appetite, or if concerns about persistent inflation and political interference at the central bank will keep buyers on the sidelines.
Over on Myriad, predictors are bullish. Users on the prediction market, developed by Decrypt’s parent company Dastan, place the odds at 61% that Bitcoin keeps rising and hits $125K before it drops back down to $105K. They also believe there’s an 80% chance Bitcoin stays above $105K throughout the entire month of September.
Disclaimer
The views and opinions expressed by the author are for informational purposes only and do not constitute financial, investment, or other advice.
