Dogecoin and Solana Set to Shatter September’s Crypto Slump: Bullish Signals Emerge

Crypto's favorite underdogs are defying seasonal trends. Dogecoin and Solana show surprising resilience as September's historical downturn fails to materialize.
Technical Breakouts Ahead
Both assets display strong support levels while traditional markets wobble. Trading volumes spike as institutional money quietly accumulates positions.
Market Momentum Builds
Retail traders flock back to meme coins and high-performance blockchains—because nothing says 'sound investment' like internet jokes and single-point failure risks.
The September curse meets its match as these tokens prepare for potential rallies. Sometimes the market makes sense—until it doesn't.
Dogecoin (DOGE) price: Breaking out—but beware
Dogecoin has been on a roll over the last week, rising by over 11%, which is typically an indicator of retail investments in crypto coming back.
Today, though, appears primed for a correction, with Doge so far dipping about 5% in the last 24 hours and currently trading for $0.2649.
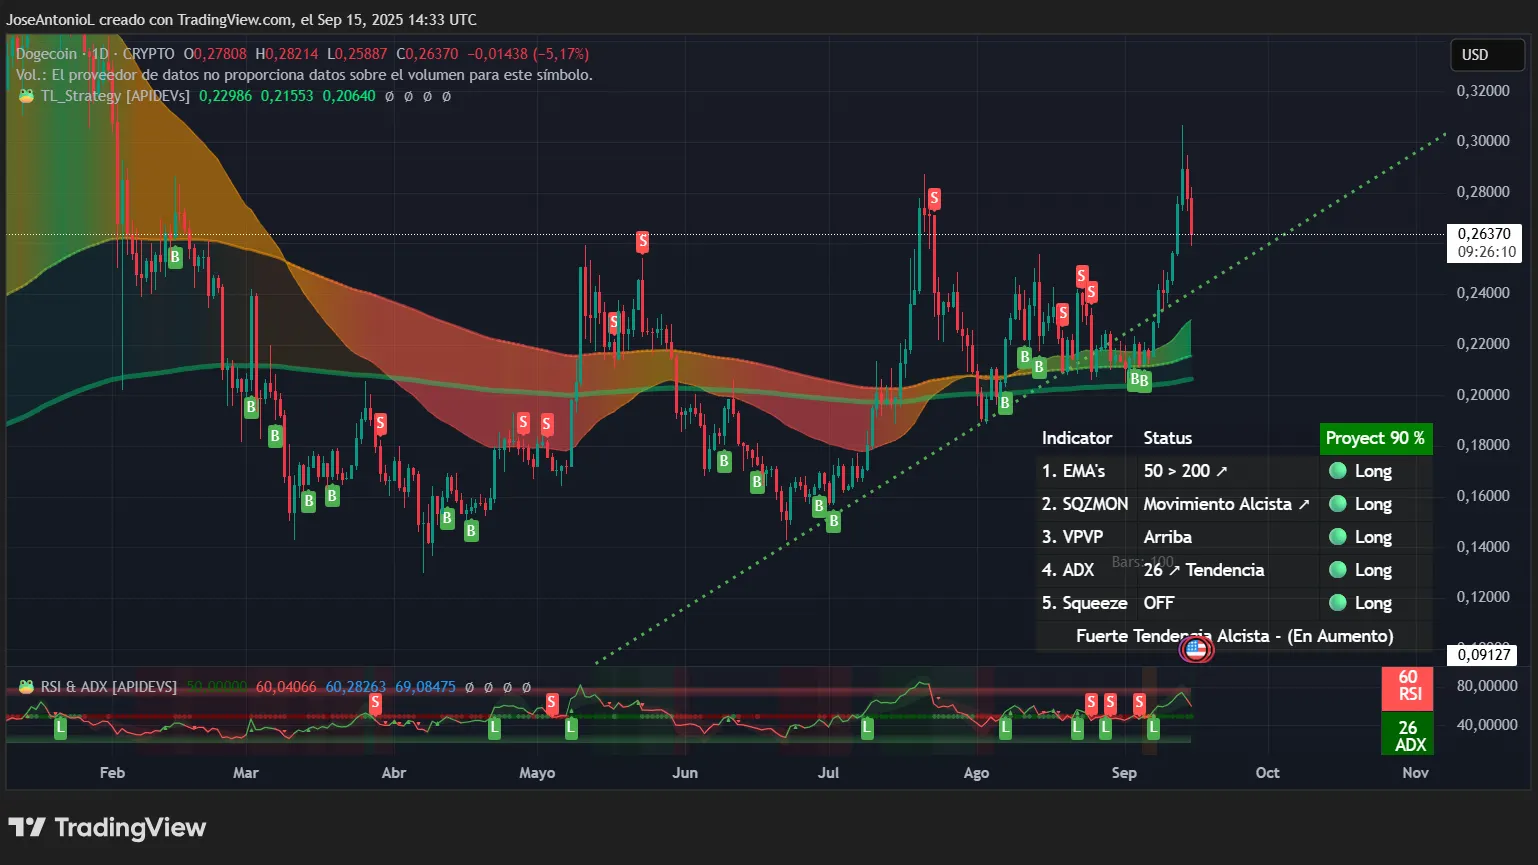
Despite today’s drop, the technical picture shows strength.
The Relative Strength Index, or RSI, for Dogecoin is at 60, which traders would normally interpret as bullish. RSI measures trading momentum, with readings below 30 signalling oversold territory and above 70 signally overbought. At 60, DOGE is hot, but not yet overbought, meaning traders would expect more upside to come.
The Average Directional Index, or ADX, for DOGE is at 26, which confirms a trending environment. ADX measures trend strength, regardless of direction, on a scale from 0 to 100. ADX readings above 25 tell traders there’s a trend in place, and the recent upward movement is strong enough to be considered directional.
But current price support for the token at around $0.23 shows the current correction underway WOULD lead to more short-term downside, but it isn’t yet cause for alarm for traders.
Exponential moving averages, or EMAs, give traders a sense of price supports and resistances, based on price averages over the short, medium, and long term.
When looking at both the 50-day and 200-day EMAs, dogecoin is currently trading well above both moving averages, with the gap between them widening. That’s a pattern traders call "bullish divergence," which typically occurs in strong uptrends. When shorter-term averages pull away from longer-term ones, it signals sustained buying pressure across multiple timeframes.
In terms of price movement, Dogecoin finally broke its bullish symmetrical triangle, first testing support NEAR the the 20-day EMA before climbing back.
Solana (SOL) price: What Red September?
Solana may be the standout coin so far is what is historically a bad month for crypto assets.
SOL is up nearly 10% since last Monday, now trading at around $232 with a market cap above $126 billion.
The token today peaked at $244.08 before consolidating at its current levels, falling back to the upper side of an ascending channel that has been in place since early August when the coin entered into “golden cross” territory.
A golden cross happens when the average price of an asset over the last 50 days crosses above the average price over the last 200 days. This is widely interpreted as a strong bullish signal, because it shows prices are accelerating upwards more quickly over time.
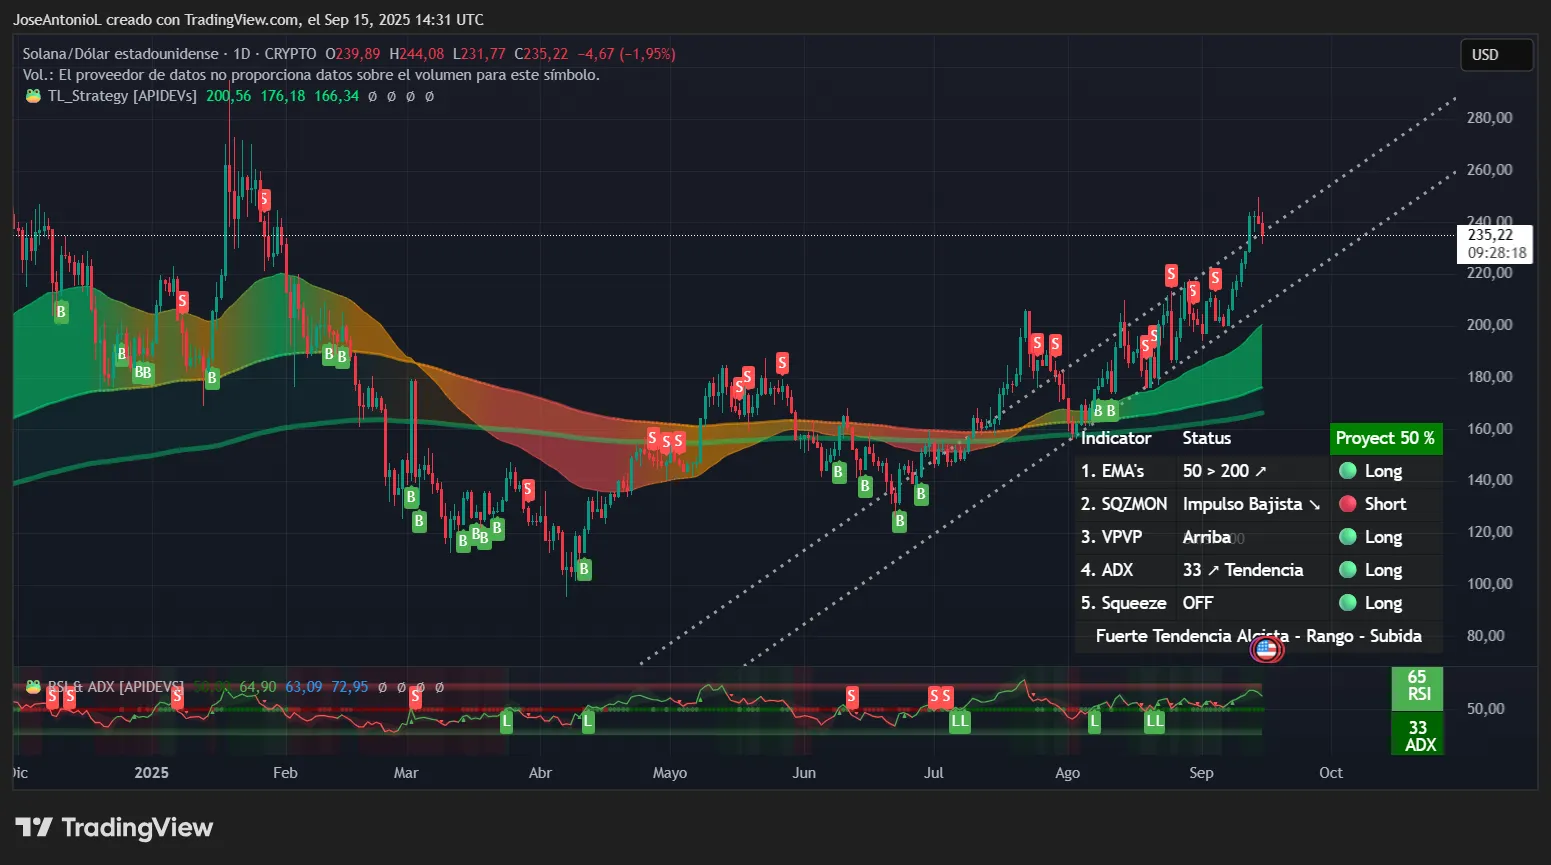
Like with DOGE, technical indicators for solana paint a bullish picture, with a slight warning that a small correction could be in the cards.
SOL’s RSI is at 65, which shows strong buying momentum approaching but not yet reaching overbought territory above 70. The ADX at 33 confirms exceptionally strong trend strength. Readings above 30 indicate a powerful directional MOVE that trend-following traders (and their algorithm setups) typically capitalize on. For swing traders, an ADX this high tells them to continue trading with the trend rather than anticipate reversals, since momentum tends to persist at these levels.
The EMA configuration (the average price of Solana in the last 50 and 200 days) reveals SOL trading decisively above both the 50-day and 200-day moving averages. But the Squeeze Momentum indicator, which traders use to determine trends or price compressions before the next big move, is showing a bearish impulse that creates an interesting divergence in the data.
This contradiction between price action and momentum suggests the market is at an inflection point—either momentum will catch up to price (bullish continuation) or price will correct to match momentum (bearish reversal).
In either scenario, we may see a small dip in the immediate future. But the overall picture on SOL remains bullish in the medium to long term.
That bullish sentiment is reflected in the shifting odds on SOL markets on Myriad. Users now believe there's a 90% chance Solana hits $250 before dropping to $130, up roughly 15% since last week. Myriad users also believe it's likely Solana hits a new all-time high price above $294 this year, placing those odds at 59%, up from 45% last week.
Disclaimer
The views and opinions expressed by the author are for informational purposes only and do not constitute financial, investment, or other advice.
