Crypto Explodes as Fed Turns Dovish: What It Means for Ethereum, Solana and Dogecoin

Federal Reserve's dovish pivot sends crypto markets soaring—again proving that nothing makes digital assets rally like traditional finance losing its nerve.
Ethereum: The Institutional Favorite
ETH leads the charge as smart money floods into defi protocols and institutional staking products—because apparently even Wall Street wants yield when bonds can't deliver.
Solana: The Retail Rocket
SOL's throughput advantage becomes the narrative du jour as retail traders pile into meme coins and NFTs, because nothing says 'sound investment' like buying JPEGs with sub-second settlement times.
Dogecoin: The Meme Machine
DOGE pumps on pure speculation and Elon Musk tweets—demonstrating that in crypto, fundamentals are optional but meme potential remains mandatory.
The Fed's monetary policy now serves as crypto's ultimate catalyst—turns out printing money does have innovative uses after all.
Dogecoin (DOGE) price: Return of the meme king
Dogecoin has rallied 9% to $0.23 over the past 24 hours, significantly outperforming Bitcoin's modest gains. Doge now sits comfortably in the top 10 coins by market capitalization, with a total value of more than $35 billion.
Besides the typical overreaction to the broader market movement, the surge comes amid a whale accumulation of over 680 million DOGE (worth $157 million) in August, with technical indicators suggesting more upside ahead.
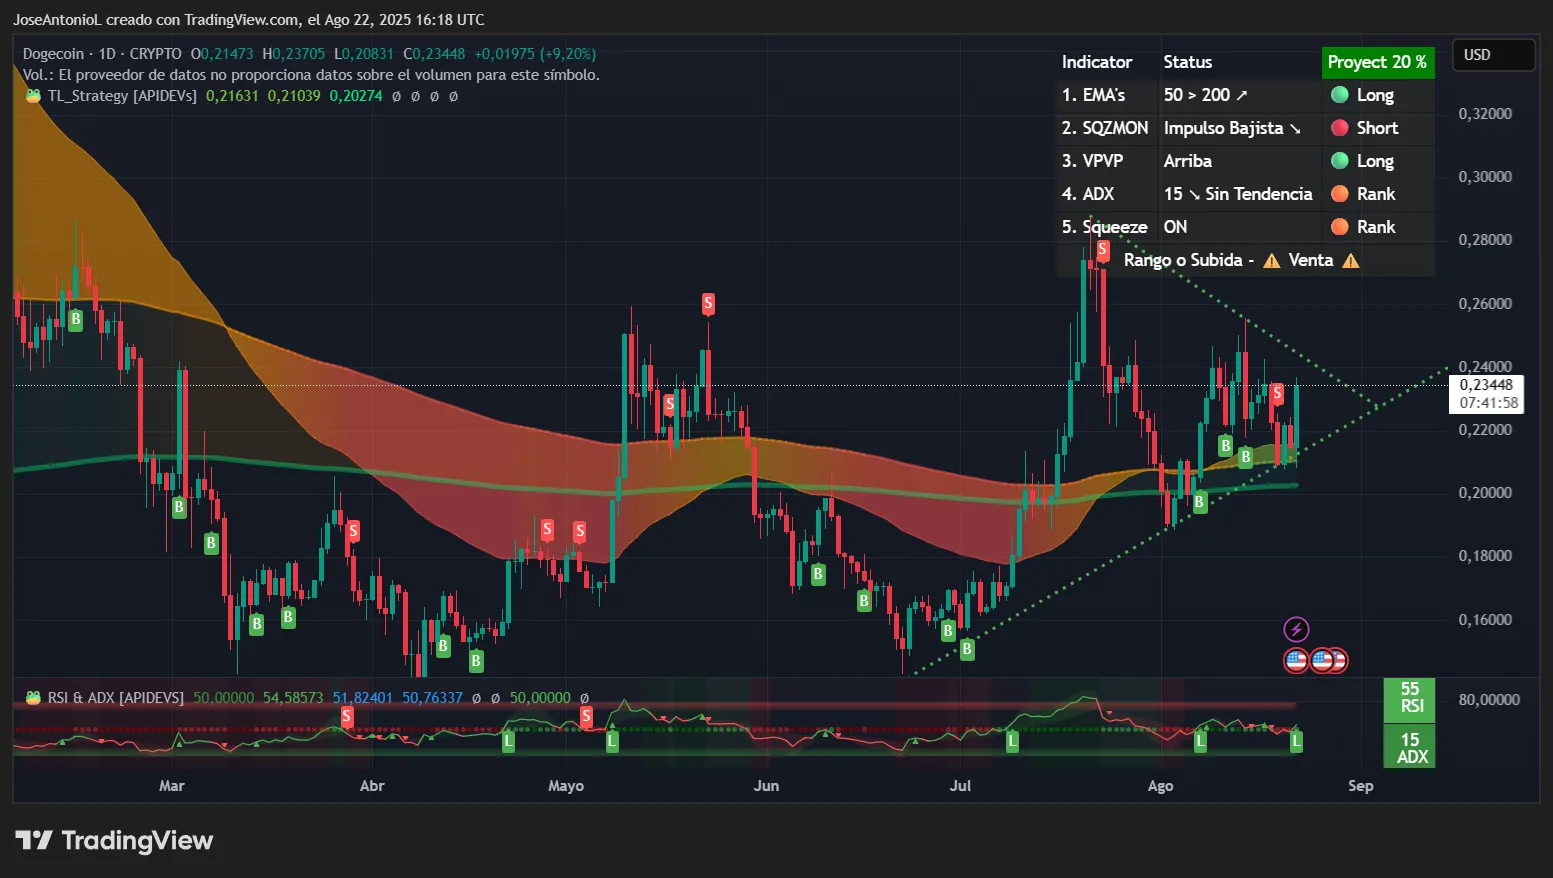
Dogecoin is still in the symmetrical triangle keeping prices in a compression phase since July. Today’s spike could be interpreted as an expected bounce from the triangle’s support—with some room for continuation until a decisive breakout.
If the pattern holds, expect lower highs and higher lows for at least a few more days.
The coin’s Relative Strength Index, or RSI, sits at 55. RSI measures momentum on a scale from 0 to 100, where readings above 70 indicate overbought conditions and below 30 suggest oversold. At 55, DOGE has room to run before hitting levels where traders typically take profits, signaling healthy buying pressure without excessive speculation.
DOGE’s Average Directional Index, or ADX, is at 15. This confirms the behavior inside a triangle, with very low momentum in either direction. This indicator measures trend strength on a scale where readings above 25 confirm a strong trend, and below 20 suggests no clear direction. DOGE's low ADX reading indicates the recent bearish correction is weakening—think of it as the selling pressure running out of steam—potentially setting up for a trend reversal if buyers step in with conviction.
The 50-day Exponential Moving Average (the average price over the last 50 days) provides support around $0.20—basically today’s starting price—while the 200-day EMA sits at approximately $0.18. When the current price trades above both these levels, as DOGE currently does, it typically signals a bullish market. The coin recently entered into a “golden cross” formation, which experienced traders typically interpret as decisively bullish. But the gap between the EMAs is so slow, it’d be hard for most traders to expect a flight to the moon any time soon. The more likely interpretation is something closer to “it’s not dumping anymore.”
The Squeeze Momentum Indicator shows "on" status and aligns with the other indicators, suggesting volatility is building after a period of compression. When this indicator fires, it often precedes explosive moves as the market breaks out of its trading range. Combine this with whale accumulation and ETF speculation—and the fact that the tail before the triangle is bullish—and you’ve got a setup that may please bull traders.
Solana (SOL) price: The “Ethereum killer” flexes
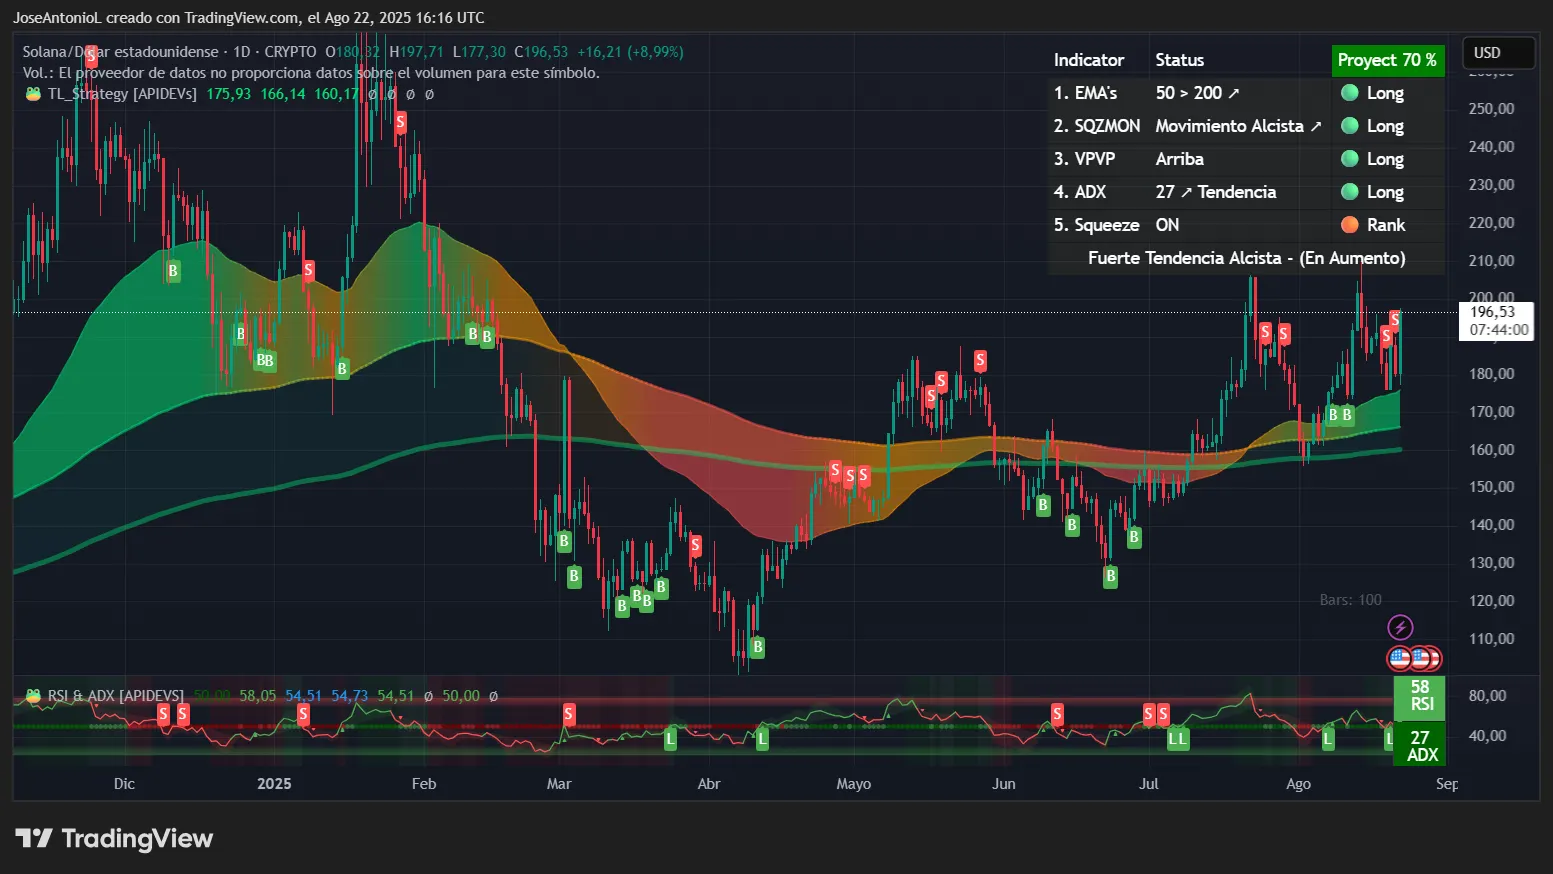
Solana posted an impressive 8.99% gain to $196.53, with trading volume exploding to $3.8 billion—nearly double the daily average. SOL now sits just outside the top 5 coins by market cap, valued at over $105 billion.
We’d be remiss if we didn’t mention that the coin’s bullish spike also coincides with Kanye West's YZY meme coin launching on solana late last night. Ye’s meme briefly hit a $3 billion market cap before settling at $1.5 billion, stress-testing the network's capacity for on-chain volume.
Whether Solana bulls should be thanking Powell or Ye (it’s Powell, let’s be real), there’s no doubt sentiment on SOL is shifting. On Myriad, a prediction market developed by Decrypt’s parent company Dastan, the odds of Solana hitting an all-time high price of $294.33 before the end of year spiked today by more than 10%. The odds, though, still favor the bears, but they’re narrowing: Myriad users currently give SOL a 44.4% chance of breaking its record.
The charts seem to line up with the shifting view.
Solana’s ADX is now at 27, crossing above the crucial 25 threshold that confirms trend establishment. SOL's reading suggests the recent uptrend has legs, with momentum building rather than exhausting.
SOL’s RSI at 58 sits in what traders call the "sweet spot"—strong enough to show genuine buying interest, but well below the 70 level where profit-taking typically emerges. This positioning allows for another 20-30% upside before reaching historically overbought conditions where corrections often occur.
The 50-day EMA at $166 provided crucial support during the recent dip, with its current price now trading comfortably above that mark at $196. The 200-day EMA further below at $160 creates a safety net of support levels. This expanding gap between moving averages—with the faster 50-day pulling away from the slower 200-day—typically occurs during sustained uptrends and gives buyers multiple entry points on any pullbacks.
The coin also recently entered into a golden cross. But unlike DOGE, the EMA’s here are drifting apart. This shows that bullish momentum, while slow, is building up.
Ethereum (ETH) price: Altcoin king roars
Ethereum, the king of altcoins, protector of decentralized smart-contracting “world computers,” and first of its name, is today smiling atop its throne. ETH is on fire.
Even after yesterday’s losses, today the king of altcoins led crypto majors with a commanding 12.16% surge above $4,700, briefly touching $4,830, and approaching its 2021 all-time high of $4,878.
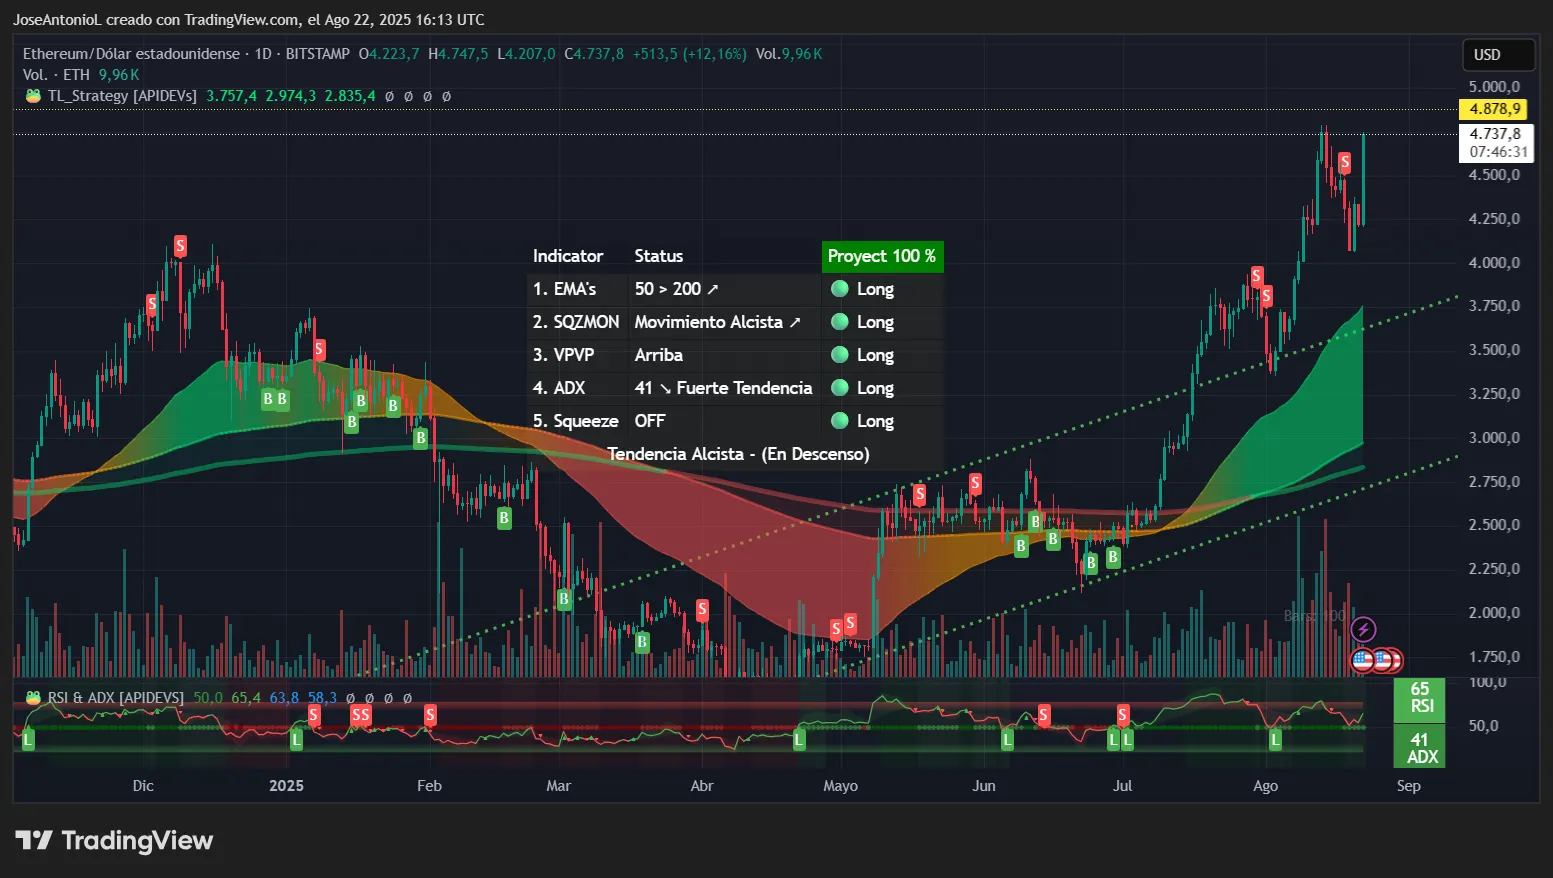
The ADX at 41 signals extremely powerful momentum—readings above 40 indicate a power trend where corrections tend to be shallow and brief. Historical data shows ETH can sustain ADX readings above 40 for weeks during major rallies. And prices are well over any statistical support—which can be a damocles sword as it makes sharp drops just as likely as unusually bullish moves.
RSI at 65 approaches but hasn't reached the 70 overbought threshold. In strong uptrends, RSI can remain between 50-70 for extended periods—this is called "embedded RSI."
The Squeeze Momentum Indicator also suggests the explosive MOVE has already been released from the recent compression phase. This often marks a trending period where momentum remains stable, so it can be a safe bet for bulls.
What are prediction markets saying? We’re so glad you asked. On Myriad, the odds of ETH hitting $5,000, well above its 2021 all-time high, have soared to 89%, rocketing up by more than 17% since yesterday. A separate market has ethereum hitting a new all-time this year as a near-lock at 94%.
Disclaimer
The views and opinions expressed by the author are for informational purposes only and do not constitute financial, investment, or other advice.
