Ethereum’s ’Golden Cross’ Emerges: Bulls Charge Into Dominance

Ethereum just flashed a textbook bullish signal—and traders are piling in like Wall Street on a Fed pivot rumor.
The Golden Cross Arrives
ETH’s 50-day moving average sliced through its 200-day counterpart this week, marking the first confirmed golden cross since the 2024 rally. These crosses historically precede major uptrends—and this one’s got extra juice with spot ETF volumes hitting $1.5B daily.
Whales vs. Retail
On-chain data shows addresses holding 10K+ ETH added 2% to their bags last week. Meanwhile, retail traders yolo’d into meme coins (again). Some things never change—like hedge funds frontrunning the little guy.
What’s Next?
With the Merge upgrade now priced in, all eyes are on Layer 2 adoption metrics. Arbitrum and Optimism collectively processed 8M transactions yesterday—double January’s peak. Scalability’s improving, but gas fees still read like a luxury surcharge.
Closing Thought: When the golden cross shines, even the bears start checking their privilege. Just don’t remind anyone what happened after the 2021 signal…
Crypto market: The macro view
The cryptocurrency market is showing renewed strength today, with the total crypto market cap rising 2.77% to $3.8 trillion, according to Coinmarketcap, even as individual assets post wildly divergent performances.
Traditional markets continue their bullish trajectory, with both the S&P 500 and Nasdaq Composite closing at all-time highs on July 10. The S&P 500 gained 0.27% to end at 6,280.46, while the tech-heavy Nasdaq closed up 0.09% to 20,630.67, showing resilience despite ongoing tariff concerns from the Donald TRUMP administration.
Geopolitical tensions remain elevated as President Trump starts to impose new tariffs on assets and commodities, and works out deals with foreign countries. Yet crypto markets appear to be shrugging off these macro headwinds, with the overall market cap expansion suggesting risk appetite remains strong.
Ethereum's golden cross breakout
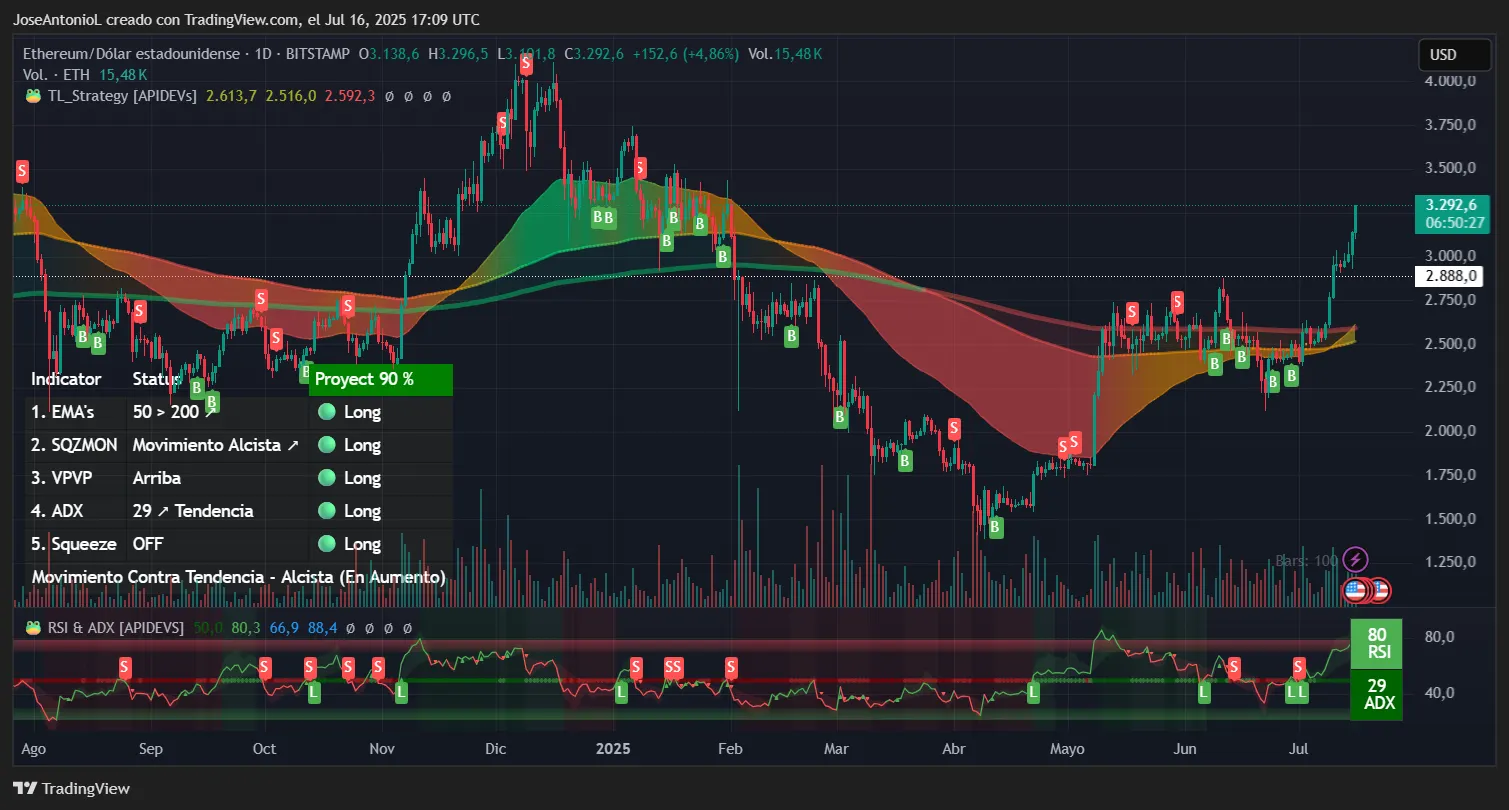
What do the charts have to say about Ethereum? The technical picture for ETH is particularly compelling. Most notably, the coin has formed a golden cross pattern on the daily timeframe.
For traders unfamiliar with this pattern, a golden cross occurs when the 50-day Exponential Moving Average, or EMA, crosses above the 200-day EMA. These EMAs take the average price of an asset over a given period, and when this pattern forms, it typically signals the start of a sustained uptrend and the end of a confirmed bearish trend. This is one of the most widely watched bullish signals for traders who study charts.
Ethereum’s Relative Strength Index, or RSI, is firmly in overbought territory at 80.3 (anything above 70 is considered overbought). While this typically suggests a pullback might be due, during strong bull runs, assets can remain overbought for extended periods as momentum traders pile in. So it may be a good idea to keep an eye on it while riding the momentum, especially considering other indicators are also bullish.
The Average Directional Index, or ADX, also confirms we're seeing a strong trending market. The ADX measures trend strength on a scale of 0-100, with readings above 25 indicating a robust trend is in place. At 29, this suggests the current uptrend has genuine strength behind it and isn't just a brief spike.
On the 24-hour timeframe, the chart clearly shows ETH trading well above both its 50-day and 200-day EMAs, with the golden cross pattern visible. The 50-day EMA appears to be around the $2,888 level based on the chart markings, while the 200-day sits lower. This wide separation indicates strong bullish momentum.
The Squeeze Momentum Indicator shows that volatility has already been released—an event that happened during the two daily candlesticks that generated the golden cross. This suggests we're in an active trend phase rather than a consolidation period preparing for a breakout.
All that is to say, ETH bulls appear to be in control for the time being.
Key Levels (from chart):
SPX6900 leads meme coin mania
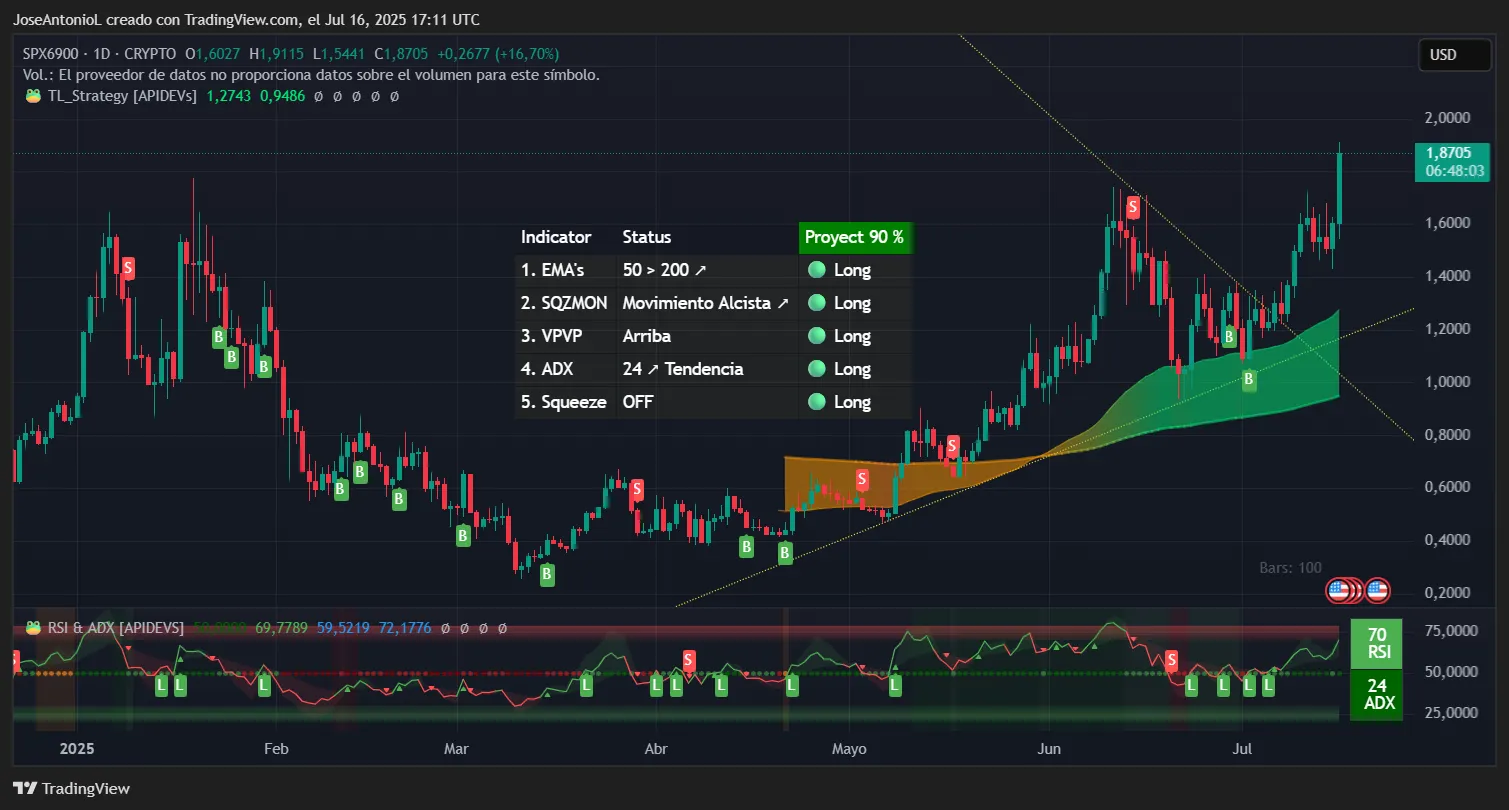
And if you thought Ethereum was performing well (it is), it’s nothing compared to the wild world of meme coins. The Solana-based meme SPX6900 has emerged as today’s standout performer, with the chart showing the token at $1.8705—up sharply in recent sessions.
The coin has surged nearly 20% in the last 24 hours, with Bonk, another solana meme coin, going neck and neck in the race for the top spot among today’s best-performing assets.
The daily chart reveals a powerful breakout from a prolonged consolidation pattern.
The RSI at 70 on the daily chart shows that the memecoin is approaching but not yet in overbought territory. There's still room for upward movement before technical traders might start taking profits. The 70-80 RSI range is often called the "power zone" where strong trends can sustain themselves.
It is important to note that meme coins are often more volatile than other assets and changes in momentum and overall market sentiment can happen in short periods of time.Several things can lead to a sudden sell-off: overreaction to a news event, one of the few whales controlling huge amounts of the coin deciding to realize gains, several take-profit orders being activated simultaneously, and on and on. For these markets, charts are often less useful for traders and the degens who trade memes are likely better off relying on vibes—or, er, “sentiment analysis.”
Nevertheless, with a reading of 24 in the ADX, SPX6900 is just below the crucial 25 threshold that confirms trend strength. However, the indicator is trending upward, suggesting the move is gaining momentum. Once ADX crosses 25, it typically confirms that a strong trend is in place.
The chart shows SPX has definitively broken above its 50-day EMA and is extending gains. The token appears to be in a strong uptrend with price action accelerating away from the moving averages. The Squeeze Momentum Indicator is also listed as "off" on the chart, similar to ETH, indicating we're in an active volatility expansion phase rather than compression.
The technical chart shows what appears to be a breakout from a multi-month ascending triangle or consolidation pattern, which often precedes explosive moves in meme coins. In other words, it could go up, or it could go down, but either way, it’s likely to happen fast.
Key Levels (from chart analysis):
Disclaimer
The views and opinions expressed by the author are for informational purposes only and do not constitute financial, investment, or other advice.
