XRP Shatters Critical Resistance – Bull Run Inbound?

XRP just bulldozed through a major price barrier—and traders are scrambling to position for what could be the start of a sustained uptrend.
The breakout follows weeks of consolidation, with the token finally gaining enough momentum to punch above a stubborn resistance level that had capped gains for months. Market watchers are now eyeing key Fibonacci extensions as potential upside targets.
Volume tells the real story. The surge came alongside a 40% spike in trading activity—classic fuel for continuation moves. Derivatives markets are heating up too, with open interest climbing as leveraged players pile in.
Of course, no crypto rally is complete without the usual suspects: Twitter permabulls declaring 'this time it's different' while institutional analysts quietly update their risk models. But price action doesn't lie—and right now, the charts are screaming bullish.
Will this hold? In a market where 'fundamentals' often mean 'which influencer posted a moon emoji,' technicals might be the only sane play. Either way, XRP's next move could set the tone for altcoins through Q3.
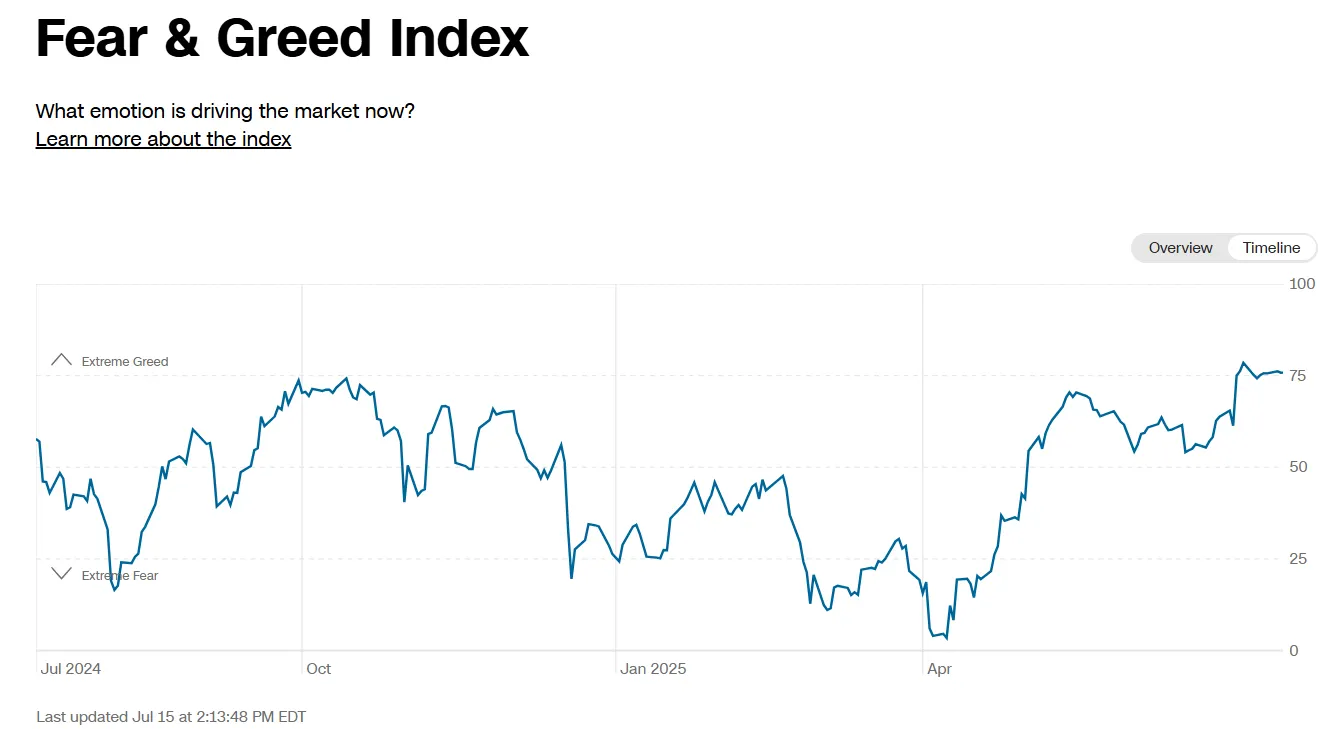 Fear and Greed Index for the stock market. Image: CNN
Traditional markets continue to influence crypto sentiment, with the S&P 500 maintaining its record-breaking trajectory above 6,200 and gold holding firm NEAR $3,400 per ounce. The U.S. Dollar Index's weakness below 97 points has provided additional tailwinds for digital assets, as investors seek alternatives to fiat currencies amid concerns about the $5 trillion debt ceiling increase and its inflationary implications.
The geopolitical landscape has stabilized following the June Israel-Iran tensions, removing a key risk factor that had previously weighed on risk assets. This calmer environment, combined with growing institutional interest in crypto through various ETF applications, has created favorable conditions for breakout moves in select altcoins (that is, crypto assets other than Bitcoin).
The fundamentals of XRP’s bull run
XRP has captured market attention with its explosive move to $2.9292, breaking decisively above the $2.60 resistance level that had capped rallies throughout most of 2025. The coin has reclaimed its long-lost spot as the third most valuable cryptocurrency by market cap and is now eyeing its January high of $3.40, driven by a perfect storm of regulatory clarity, institutional developments, and technical momentum.
In a broader timeframe, the primary catalyst igniting XRP's rally is the resolution of regulatory uncertainty that plagued the token for years. The SEC officially dropped its appeal in the Ripple case in late June, marking the end of a four-year legal battle. Judge Analisa Torres's 2023 ruling that XRP's programmatic sales via secondary exchanges were not securities violations stands as final, providing the regulatory clarity institutional investors demanded.
As a reminder, the founders of the crypto payments company Ripple also created XRP, held large stashes of it, and periodically sold the token over the years to the tune of billions of dollars. The SEC sued Ripple in late 2020 alleging securities violations and wanted said billions disgorged. And, well, that’s all over and done with now, with Ripple escaping with a small fine.
More recently, Ripple's July 2 application for a federal bank charter with the Office of the Comptroller of the Currency signals a major strategic shift. If approved, Ripple WOULD join the exclusive ranks of crypto-native firms with national trust bank licenses, enabling it to act as a qualified custodian and expand its financial services nationwide. The news sent XRP up 3% initially, but momentum has accelerated as market participants digest the implications.
ETF speculation has reached fever pitch with eleven major asset managers filing applications for spot XRP ETFs. The launch of the ProShares Ultra Solana ETF (SLON) and the ProShares Ultra XRP ETF (UXRP) probably lead the pack as the most impactful news, followed by speculation about Grayscale’s efforts to have its own XRP Trust converted to an ETF (much like its Bitcoin and ethereum Trusts).
Prediction market platform Polymarket shows an 85% probability of an XRP ETF approval by end of the year while Myriad Markets, a prediction market developed by Decrypt’s parent company Dastan, gives 70% odds of an XRP ETF being approved before a Litecoin ETF.
The daily chart reveals XRP trading at $2.92, having broken out of a massive compression zone that had been forming since early 2025. This breakout above $2.60 represents a significant technical achievement, as this level had acted as stubborn resistance throughout the year. The Average Directional Index, or ADX, which measures trend strength, shows a reading of 34—well above the 25 threshold that indicates a strong trending market. Think of ADX like a speedometer for trends: below 25 means the market is moving sideways or is not really confident of what’s going on, above 25 shows directional momentum, and above 40 signals a very powerful trend.
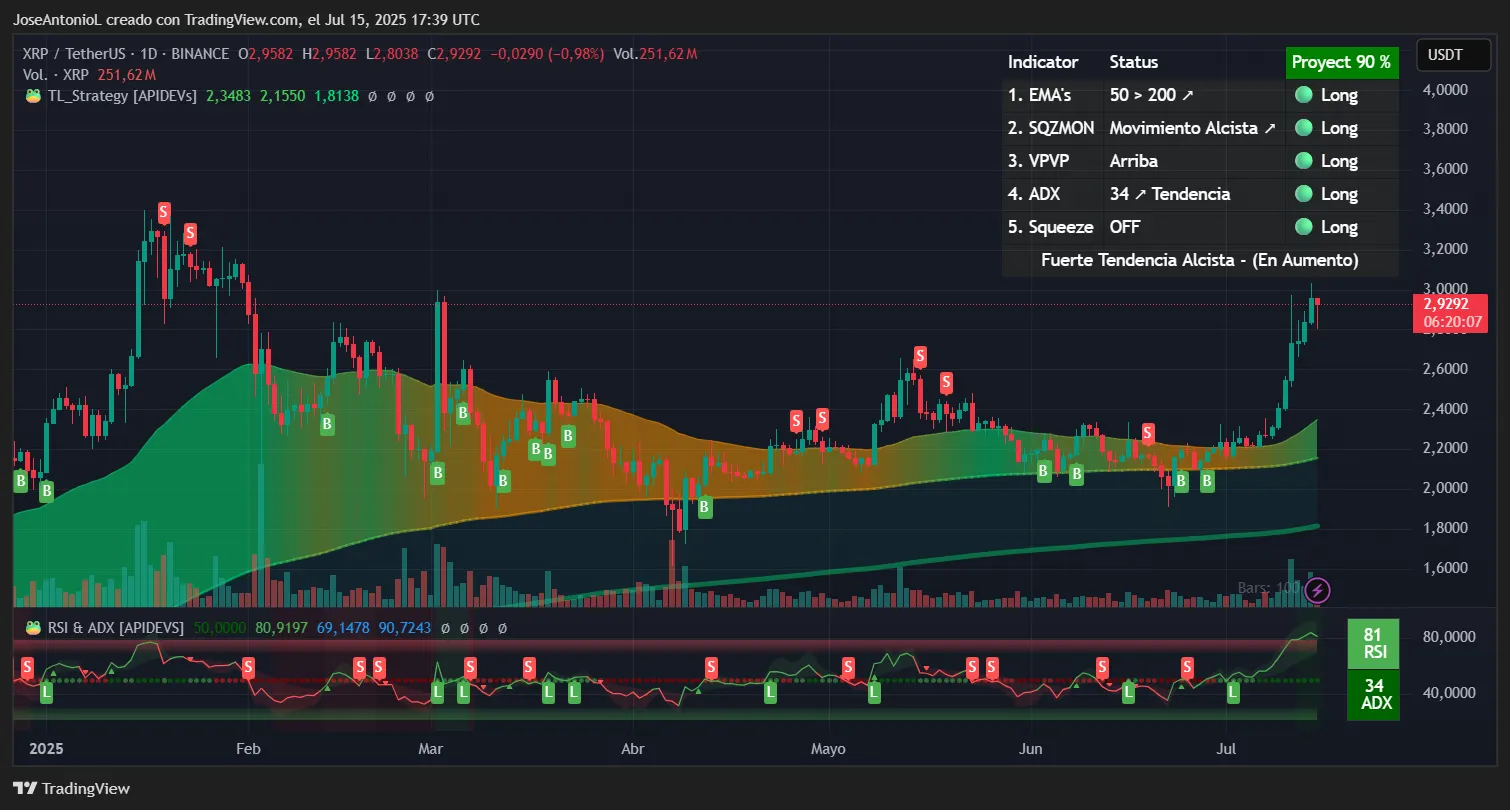
The Exponential Moving Averages, or EMAs, paint an increasingly bullish picture. The 50-period EMA (the faster-moving average that reacts quickly to price changes) moves above the 200-period EMA (the slower, more significant trend indicator), which traders largely interpret as bullish. Also, the gap seems to be expanding ever so slightly since the beginning of the month, which could point to even stronger bullish sentiment in the future if conditions remain the same.
The Relative Strength Index, or RSI, currently reads 81, firmly in overbought territory above 70. While this might typically signal a pullback is due, strong trends can remain overbought for extended periods. The RSI measures momentum by comparing recent gains to losses like a pressure gauge showing when buying might be getting too frenzied. At 81, it suggests powerful upward momentum but also warns that a cooling period could emerge.
This may be why XRP prices today are struggling to keep up the momentum, with the RSI suggesting it may be time for traders to cool down as markets stabilize.
The Squeeze indicator shows "off" status with a long signal (green), indicating volatility is expanding in an upward direction. This tool identifies when price has been compressed (like a coiled spring) and is now releasing that energy. The green signal confirms the breakout is likely to continue rather than reverse.
Volume structure reveals massive accumulation between $2.00-$2.40, visible as the large green and red bands in the lower chart above. This represents where most trading occurred during the consolidation phase, now acting as strong support. The volume spike accompanying the breakout above $2.60 confirms genuine buying interest rather than a false move.
Disclaimer
The views and opinions expressed by the author are for informational purposes only and do not constitute financial, investment, or other advice.
